Here is why SIREN token collapsed | Credit: Veronica Cestari
Share
Key Takeaways
SIREN has plummeted 91% in just 10 days after peaking at an all-time high of $3.61.
Analysis indicates that tight supply control could have contributed to the token’s crash.
Distribution has intensified, with indicators expecting SIREN’s price to hit new lows.
SIREN has collapsed.
The BNB Chain memecoin that briefly became the market’s most-discussed token after surging over 1100% in 30 days has now fallen by 91% over the last 10 days.
At an all-time high, SIREN’s price was $3.61. Today, the cryptocurrency trades at $0.30.
This represents a total loss of $846 million in market capitalization. But the SIREN price crash did not happen without cause, as CCN reveals in this analysis
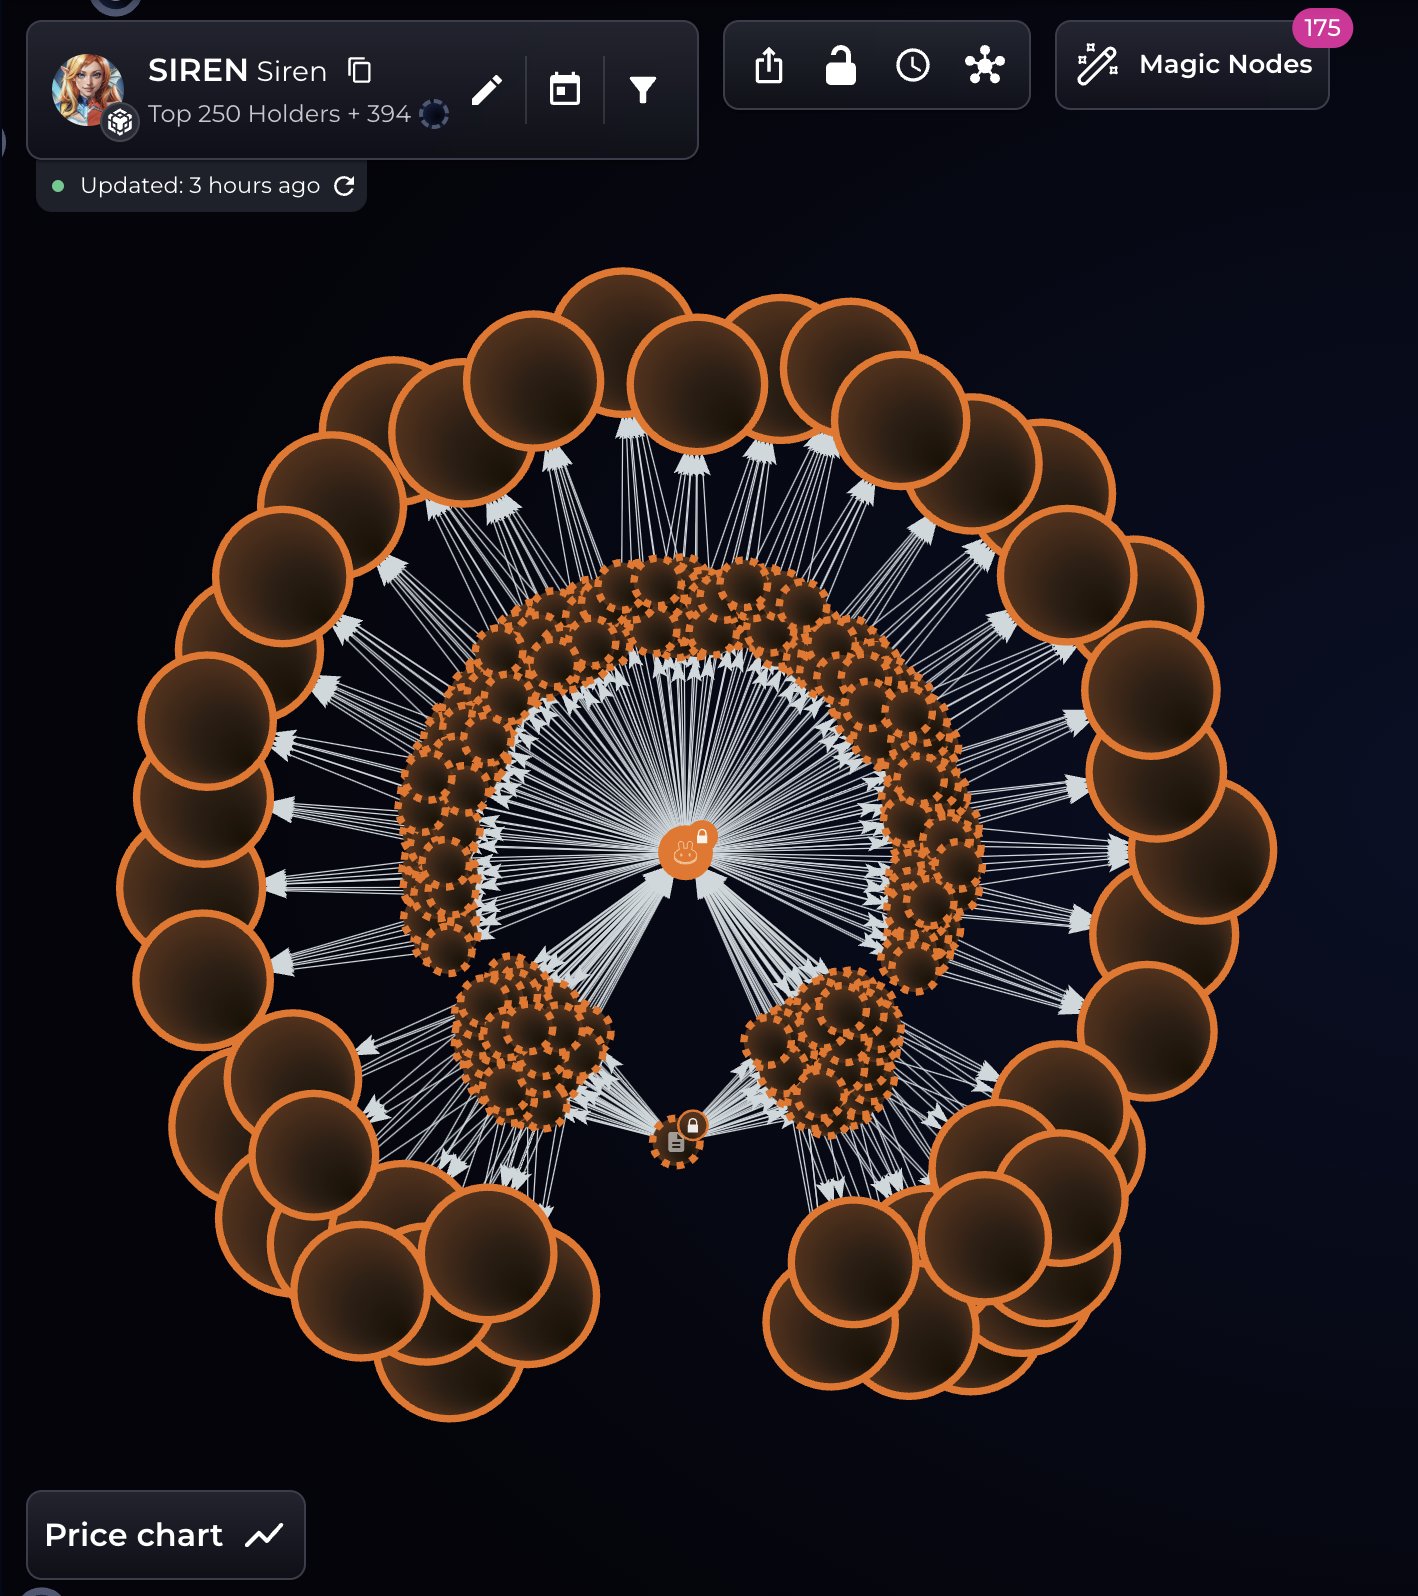
On March 23, visual analytics platform Bubblemaps disclosed that one entity controls over 50% of the SIREN total supply.
According to its findings, the control was linked to a single cluster of approximately 200 interconnected wallets.
That concentration figure was not just a warning sign. Also, it served as a structural indictment of the token’s market integrity from the moment it began attracting retail attention.
The mechanics of what followed are straightforward. The dominant entity reportedly accumulated SIREN at an average cost of approximately $0.045 per SIREN.
As the token’s price climbed toward $3.83 on the back of retail FOMO, the entity distributed tokens into the demand surge.
Selling tokens accumulated at $0.045 into a market paying $3.83 generates an 8,400% return on cost. So, this led to the SIREN price crash, leaving those with a high on-chain cost basis at ridiculous losses.
In addition to the Bubblemaps allegation, on-chain sleuth ZachXBT noted that he linked some of the addresses associated with the supply to market maker DWF Labs.
“I started graphing the 48.5% SIREN cluster today on BSC and noticed the addresses link to several obscure DWF affiliated tokens on-chain (LADYS, RACA, TOMO, etc),” ZachXBT emphasized.
Outflow Intensify
Meanwhile, the netflow data behind SIREN’s price crash tells a story of precise distribution.
According to Coinglass, SIREN’s exchange netflow against price from November 2025 through late March 2026 reveals exactly how sophisticated players behaved during the pump.
From November through late January, netflow was virtually zero, flatlining alongside a dormant price near $0.30.
Then February changed everything. As prices began their first leg upward, large negative netflow spikes emerged as many tokens left exchanges, reducing sell-side supply and supporting the rally.
The critical shift came during the March 20–23 price explosion, which was when SIREN’s price spiked above $3.
Netflow swung violently positive, with massive inflows back onto exchanges reaching nearly $1 million.
That’s the unmistakable signature of distribution as large holders deposit coins onto exchanges specifically to sell into the rally’s peak liquidity.
The aftermath confirms it. Since the spike, netflow has turned deeply negative at -$3.9 million.
Currently, SIREN trades near $0.30, well below its peak. The netflow data suggests the smart money sold aggressively into strength.
So, until large inflows stop and consistent outflows resume at these levels, the distribution risk remains very much alive. If sustained, it could accelerate the SIREN price crash further.
SIREN Price Prediction: No Bounce Back?
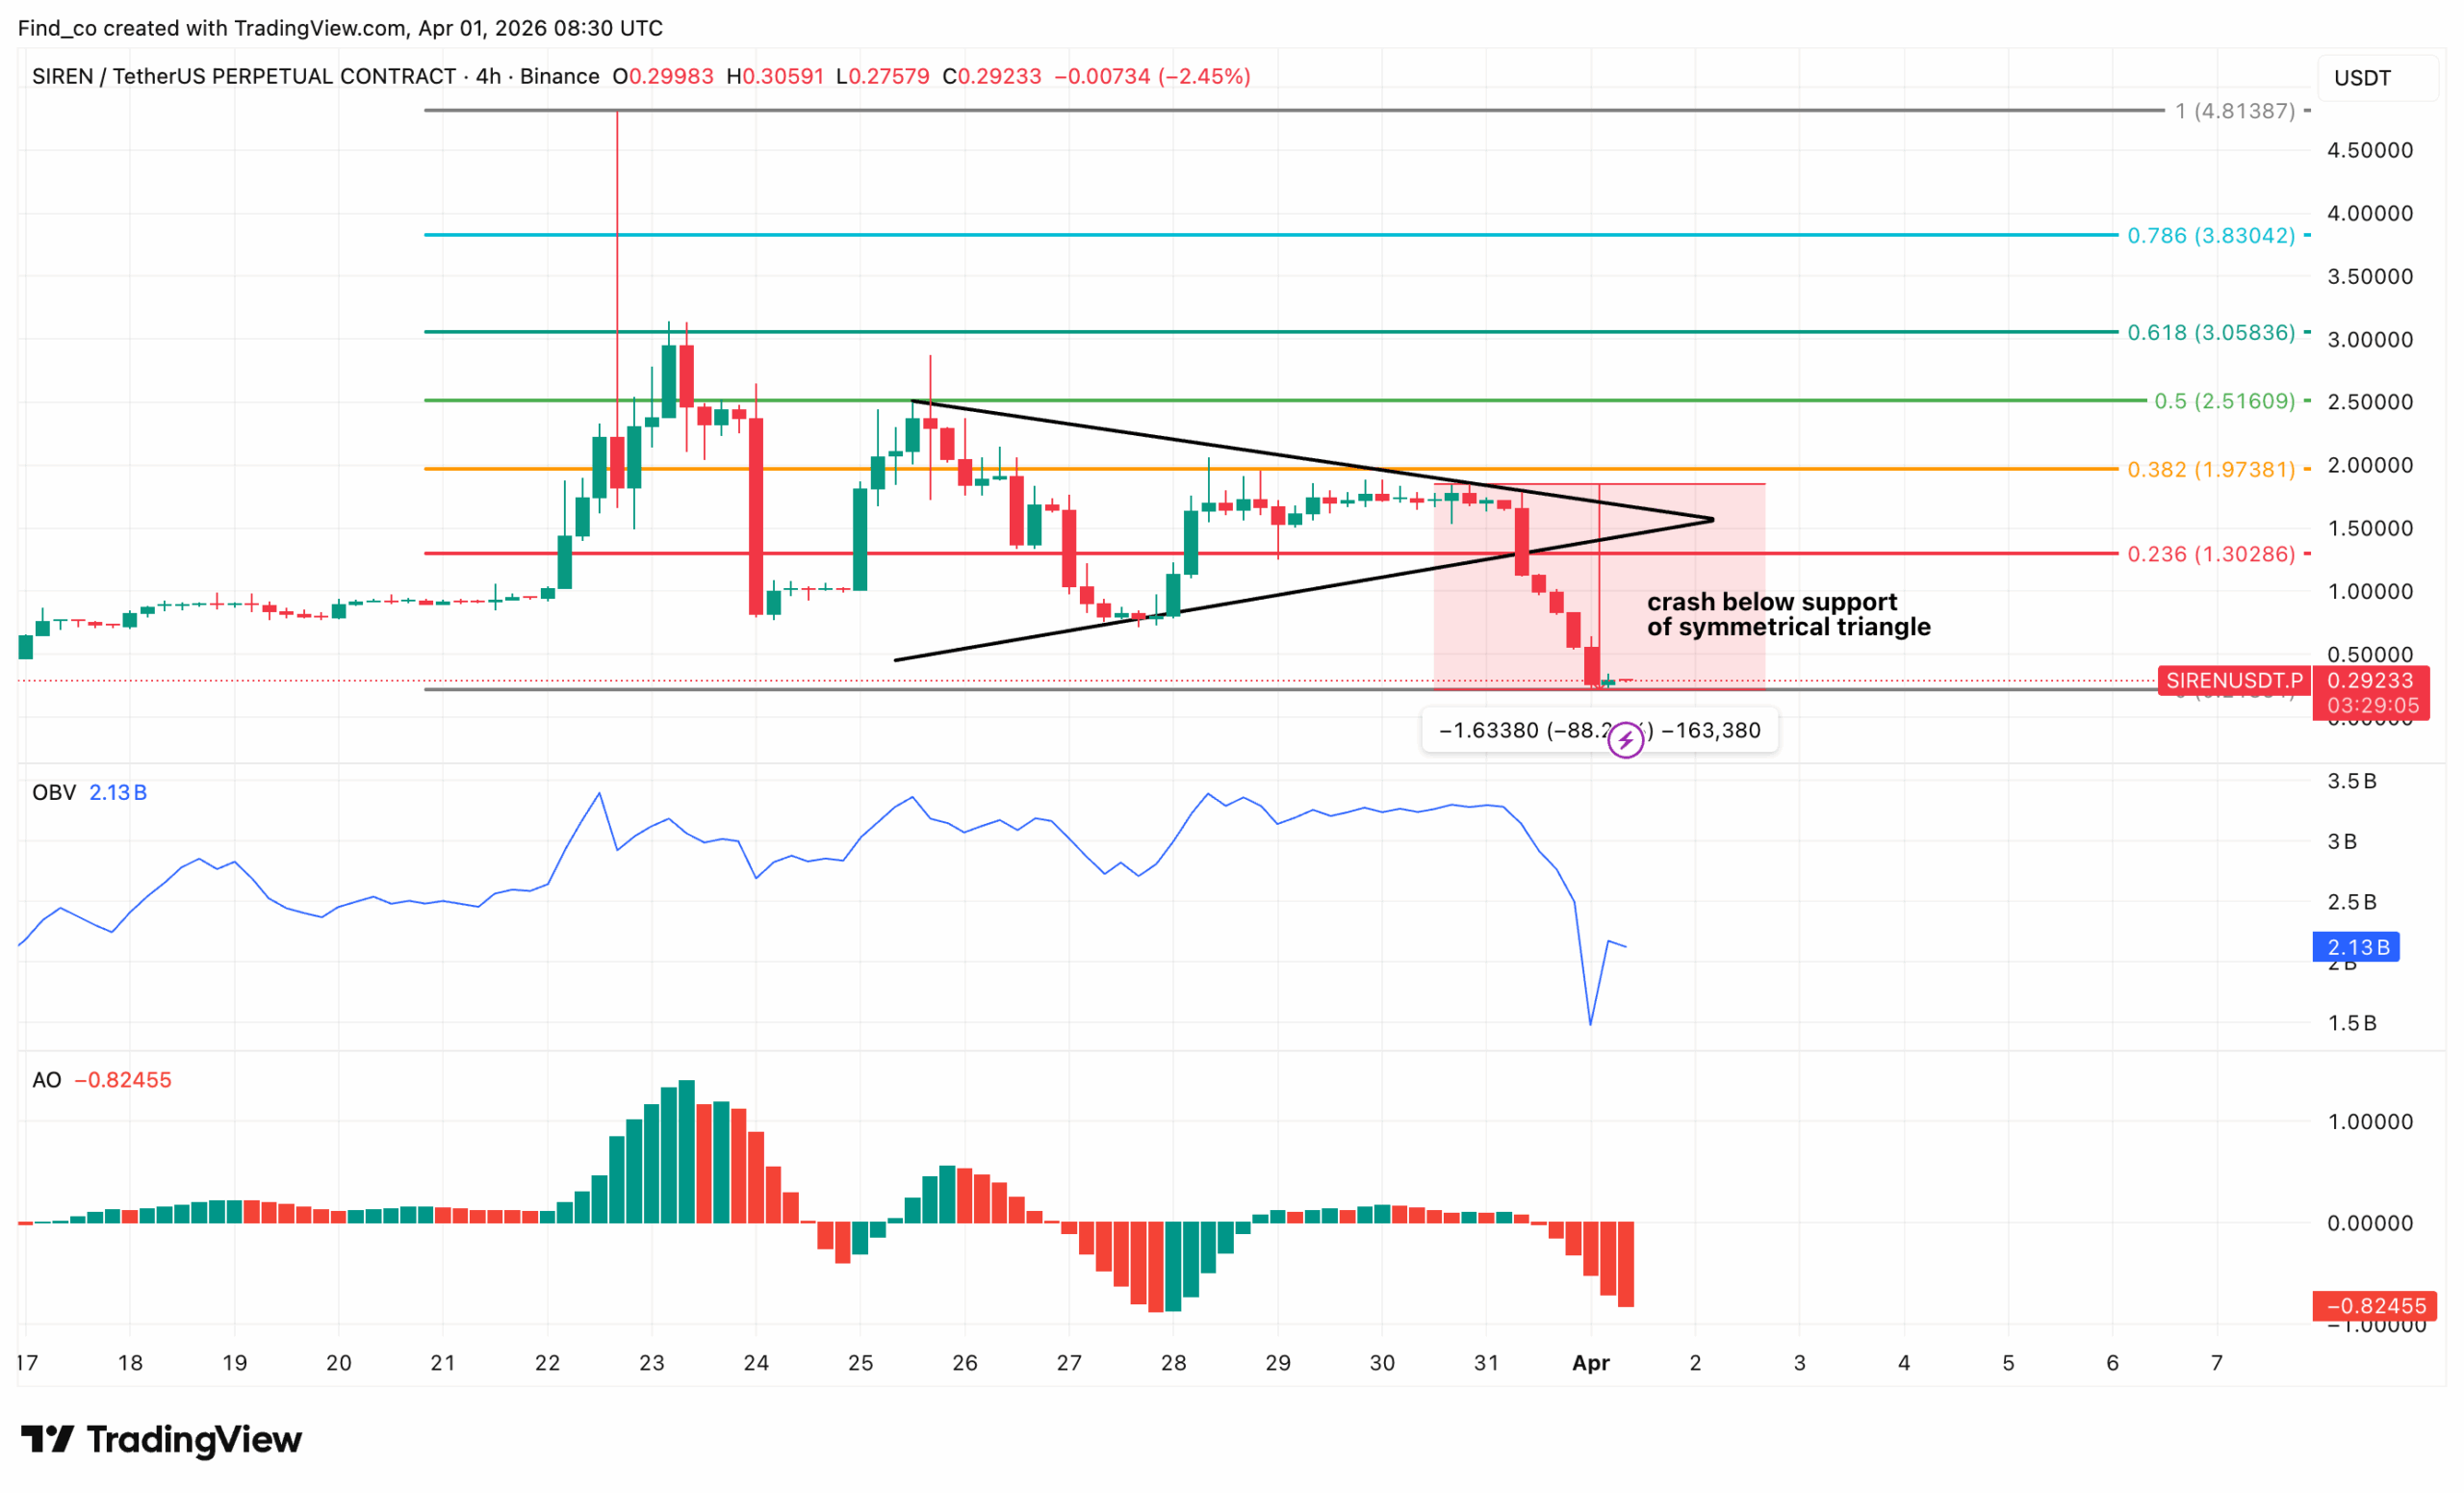
Looking at the 4-hour chart, the SIREN/USDT pair is devastatingly down.
After the March 22 spike, SIREN’s price formed a symmetrical triangle between $1 and $2.80.
Typically, this pattern signals consolidation before continuation. For several days, the token’s price compressed tightly within the triangle, and bulls had reason for hope.
Then the floor gave way entirely. As the chart shows, the SIREN price crash occurred when it broke below the triangle’s support.
The On Balance Volume (OBV) perfectly confirms the distribution narrative.
After steadily climbing through the rally, OBV crashed from 3.5 billion to 1.6 billion in just a few days.
In this case, sellers didn’t just win; they won big. They overwhelmed buyers completely.
Furthermore, the Awesome Oscillator (AO) at -0.825 is now printing its most negative reading on the chart.
This indicates that momentum has fully flipped bearish.
So, as SIREN’s price now sits near its pre-pump base of $0.30. The netflow data has already identified smart money distributing at the top.
If this trend continues, it could drop to $0.20. On the contrary, an increase in buying pressure could invalidate this thesis. In that case, SIREN could rise to $1.30.
Disclaimer:
The information provided in this article is for informational purposes only. It is not intended to be, nor should it be construed as, financial advice. We do not make any warranties regarding the completeness, reliability, or accuracy of this information. All investments involve risk, and past performance does not guarantee future results. We recommend consulting a financial advisor before making any investment decisions.
Victor Olanrewaju is a crypto analyst and reporter at CCN with deep roots in on-chain research and technical analysis. His crypto journey began in 2017, but it was the 2020 Uniswap airdrop that sparked a full-time pivot into the space.
With a foundation in copywriting, Victor honed his craft creating high-converting content for leading crypto brokers — most notably an XRP price prediction that ranked #1 on Google during the 2021 bull run.
He later joined AMBCrypto in 2022, where he combined storytelling with technical and on-chain analysis to cover key market narratives.
In 2024, he expanded his expertise at BeInCrypto, collaborating with analysts and using tools like Glassnode, Santiment, and IntoTheBlock to break down Bitcoin and altcoin trends.
At CCN, Victor covers the top cryptocurrencies, memecoins, macro shifts, blending real-time insights with deep-dive metrics.
He holds a Bachelor’s degree in Physics from the University of Ibadan, equipping him to simplify complex data for a wide audience. Follow his work or connect on LinkedIn or X.