Stablecoin supply fell $7.7B in June, its biggest drop since Terra, even as adjusted transaction volume reached a record $1.79T. | Credit: CCN.com
Share
Key Takeaways
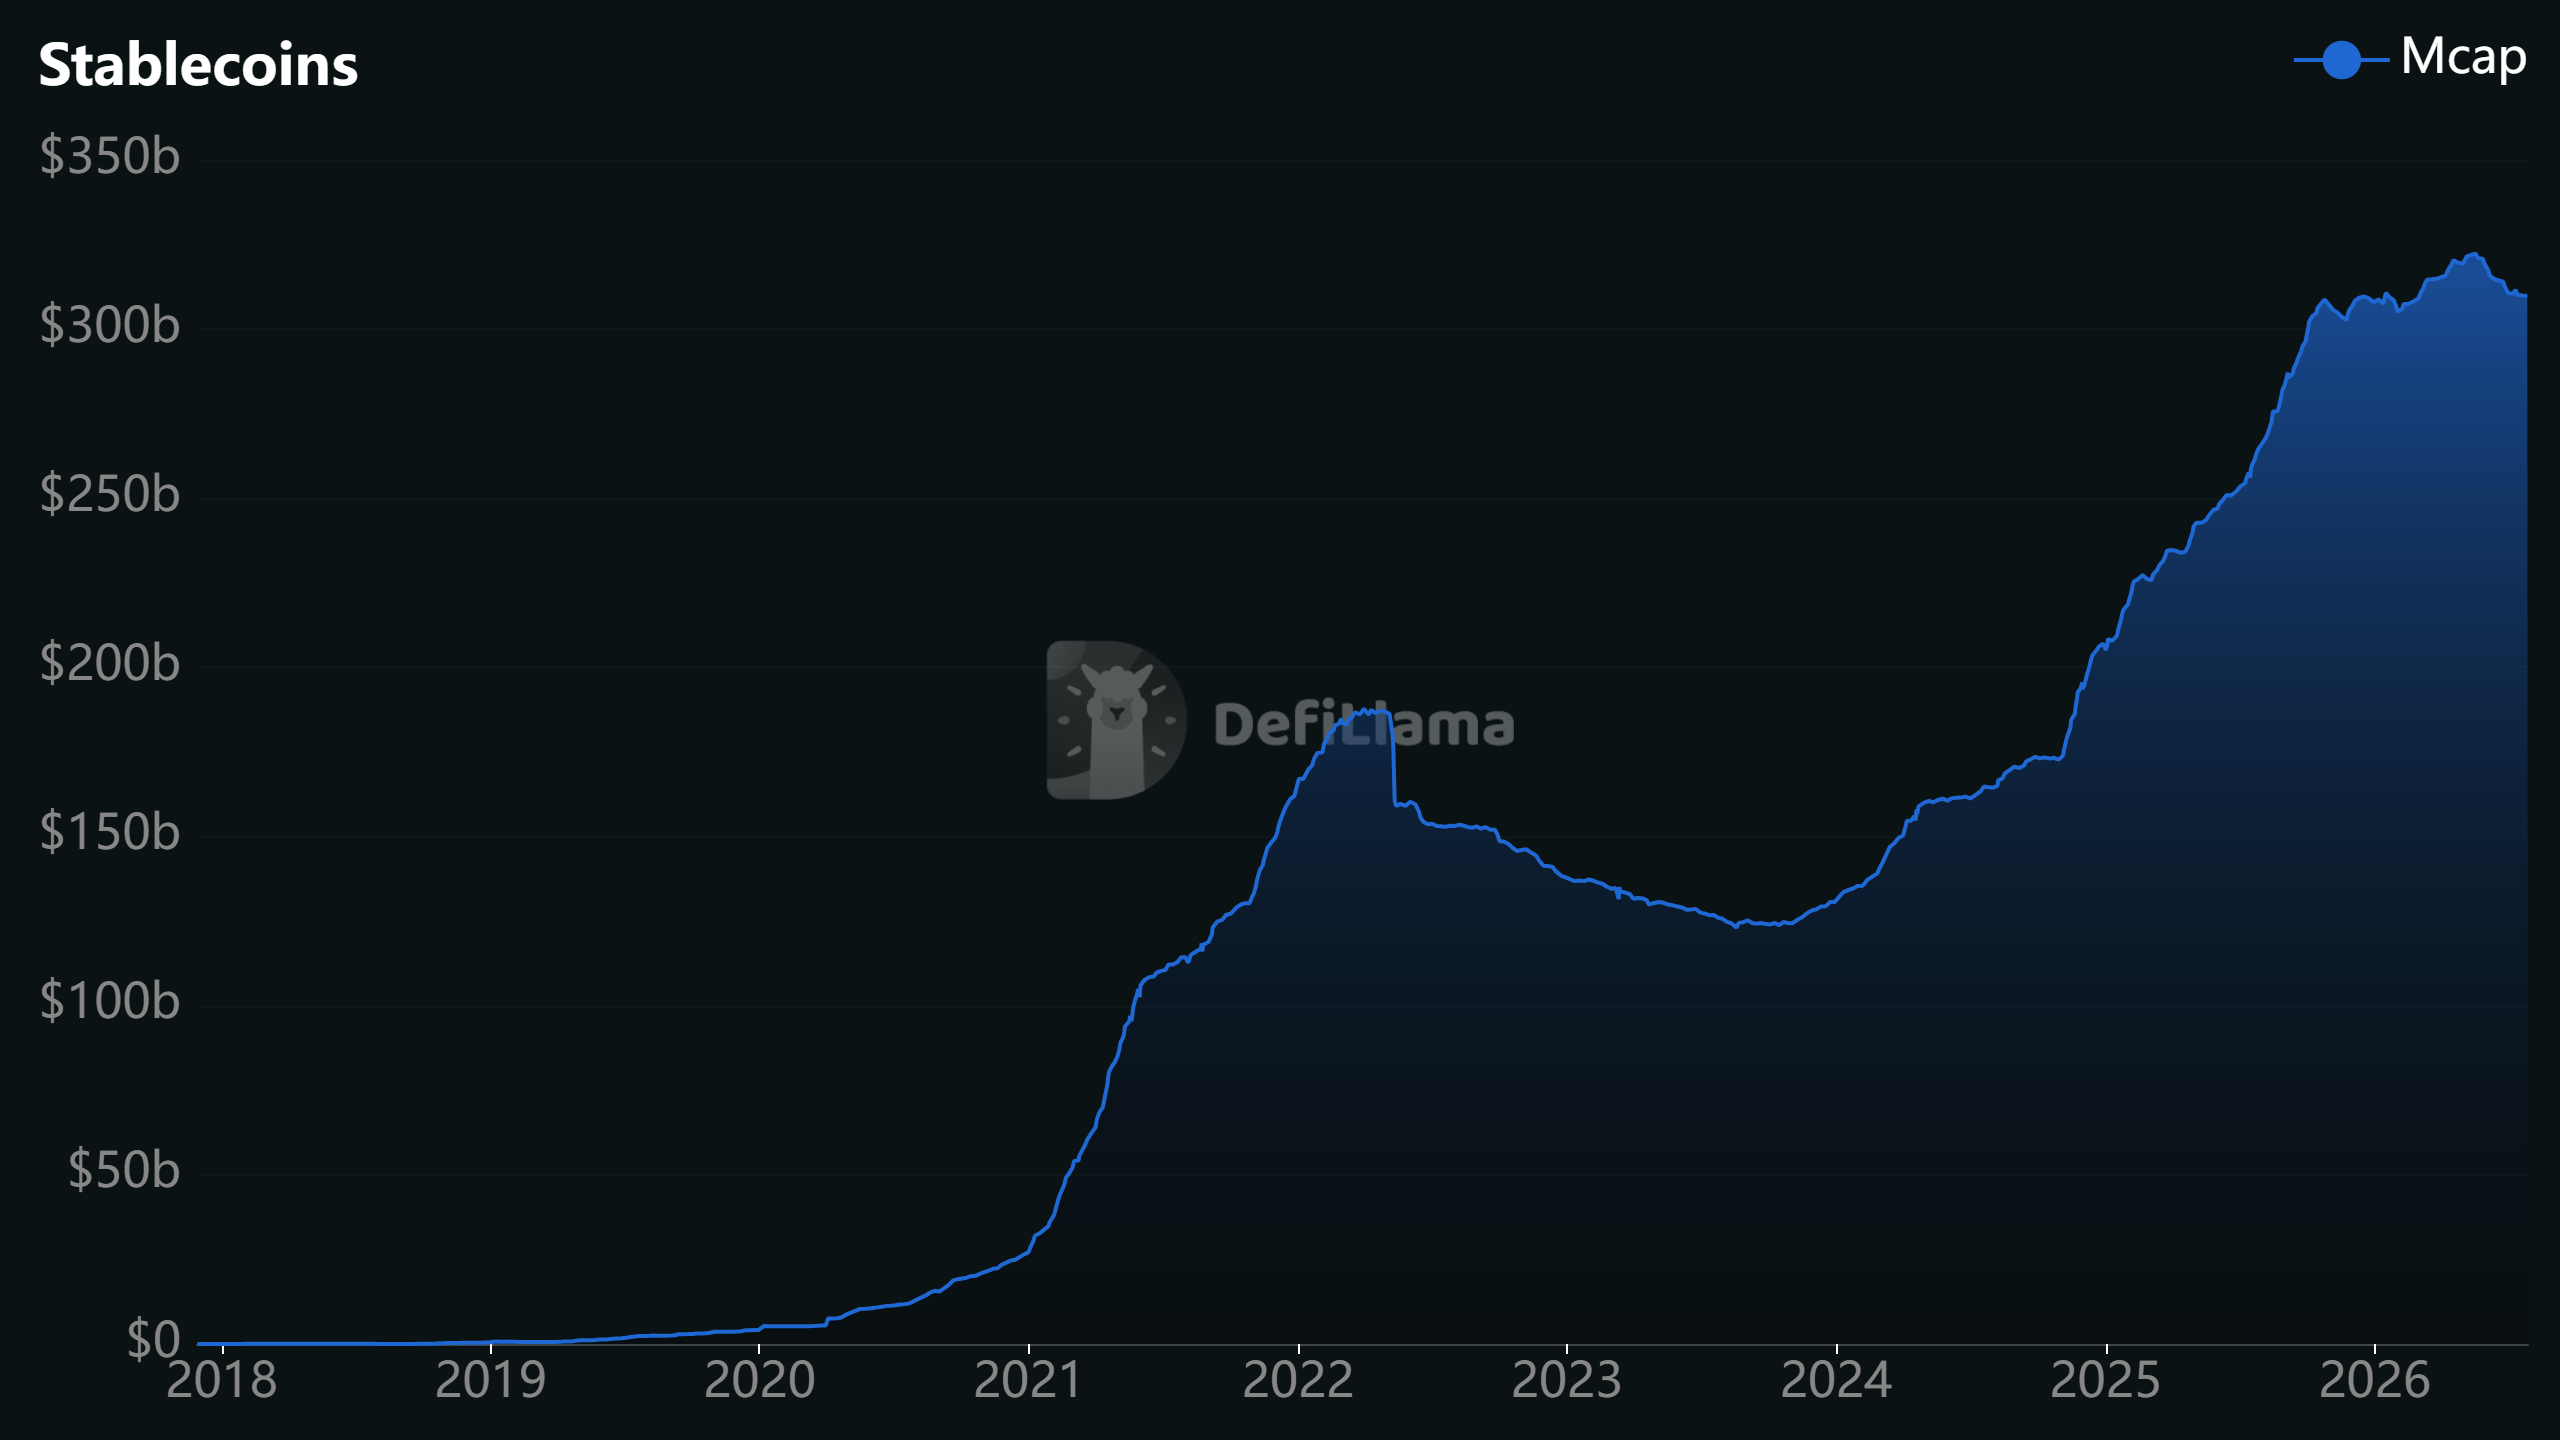
Stablecoin capitalization fell by $7.7 billion in June, its largest monthly decline since the Terra-Luna collapse.
Adjusted transaction volume nevertheless reached a record $1.79 trillion, up 63% month over month and 125% year over year.
USDC processed significantly more adjusted volume than USDT despite having a much smaller circulating supply.
The stablecoin market contracted sharply in June, but the decline may reveal more about how dollar-backed tokens are evolving than about weakening demand.
Total stablecoin capitalization fell by $7.7 billion during the month, marking the largest monthly reduction since Terra-Luna collapsed in May 2022.
The sector has now lost approximately $10 billion from its May peak, leaving its combined value near $300 billion.
Yet stablecoin activity moved in the opposite direction. Adjusted transaction volume climbed to a record $1.79 trillion in June, rising 63% from May and 125% from a year earlier.
The conflicting figures suggest investors are holding fewer idle stablecoins while using the remaining supply more frequently for transfers and settlement.
Our Top Crypto Sports Betting Partners:
Sponsored
Disclosure
We sometimes use affiliate links in our content, when clicking on those we might receive a commission at no extra cost to you. By using this website you agree to our terms and conditions and privacy policy.
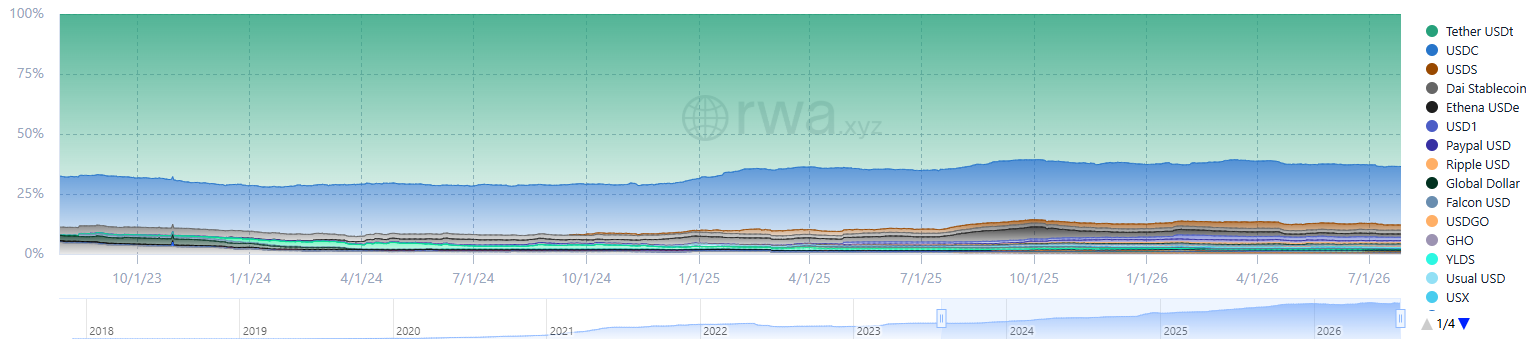
The decline was concentrated among the two largest stablecoins. Tether’s USDT supply dropped from approximately $190 billion in May to $184 billion, while Circle’s USDC fell from a March peak near $80 billion to around $74 billion.
The overall contraction of roughly 3% remains modest compared with the 26% collapse recorded during the 2022 crisis. Crucially, June’s decline did not result from a major stablecoin losing its dollar peg or suffering a run on its reserves.
Instead, part of the capital appears to have migrated toward tokenized Treasury products that offer returns unavailable through conventional payment stablecoins.
The GENIUS Act prohibits issuers from paying holders interest on payment stablecoins. That restriction does not eliminate demand for yield; it encourages investors and corporate treasurers to hold funds in interest-bearing tokenized assets until they need liquidity for transactions.
Tokenized Treasury funds have consequently grown to nearly $16 billion, up from approximately $11 billion in March. Under this model, stablecoins become temporary working balances rather than long-term stores of capital.
Record Volume Shows Stablecoin Velocity Is Rising
June’s record settlement activity indicates that every dollar of stablecoin supply is moving more frequently.
Standard Chartered estimated that stablecoins now turn over approximately six times per month, roughly twice the rate recorded two years ago.
Visa economists have also calculated quarterly stablecoin velocity at 13.56, compared with 1.65 for the US M1 money supply.
USDC demonstrates the clearest divide between market capitalization and practical usage. Despite maintaining a substantially smaller supply than USDT, it processed $18.3 trillion during 2025, compared with USDT’s $13.3 trillion.
In June, USDC accounted for approximately $1.21 trillion of adjusted volume, while USDT processed $576 billion. USDT retains the supply lead and remains widely used as an offshore savings instrument, but USDC has become the more active institutional settlement asset.
The comparison shows why market capitalization alone no longer provides a complete measure of stablecoin adoption.
Payments Growth Changes the Industry’s Scoreboard
Adjusted data still requires careful interpretation. Raw stablecoin transfers include automated activity, exchange movements, and transactions that do not represent real economic payments.
McKinsey and Artemis estimated that identifiable real-world payments accounted for only about 1% of stablecoin activity in 2025. However, that segment still reached approximately $390 billion, around 30 times its level two years earlier.
Business-to-business payments contributed $226 billion, while payroll and remittances generated roughly $90 billion. Corporate transfers, rather than consumer purchases, are therefore driving much of the emerging payments market.
For issuers, shrinking supply can reduce reserve-interest revenue. For networks and payment processors, however, rising transaction velocity creates more opportunities to collect fees.
Disclaimer:
The information provided in this article is for informational purposes only. It is not intended to be, nor should it be construed as, financial advice. We do not make any warranties regarding the completeness, reliability, or accuracy of this information. All investments involve risk, and past performance does not guarantee future results. We recommend consulting a financial advisor before making any investment decisions.
Giuseppe Ciccomascolo began his career as an investigative journalist in Italy, where he contributed to both local and national newspapers, focusing on various financial sectors.
Upon relocating to London, he worked as an analyst for Fitch's CapitalStructure and later as a Senior Reporter for Alliance News. In 2017, Giuseppe transitioned to covering cryptocurrency-related news, producing documentaries and articles on Bitcoin and other emerging digital currencies. He also played a pivotal role in establishing the academy for a cryptocurrency exchange website. Crypto remained his primary area of interest throughout his tenure as a writer for ThirdFloor.