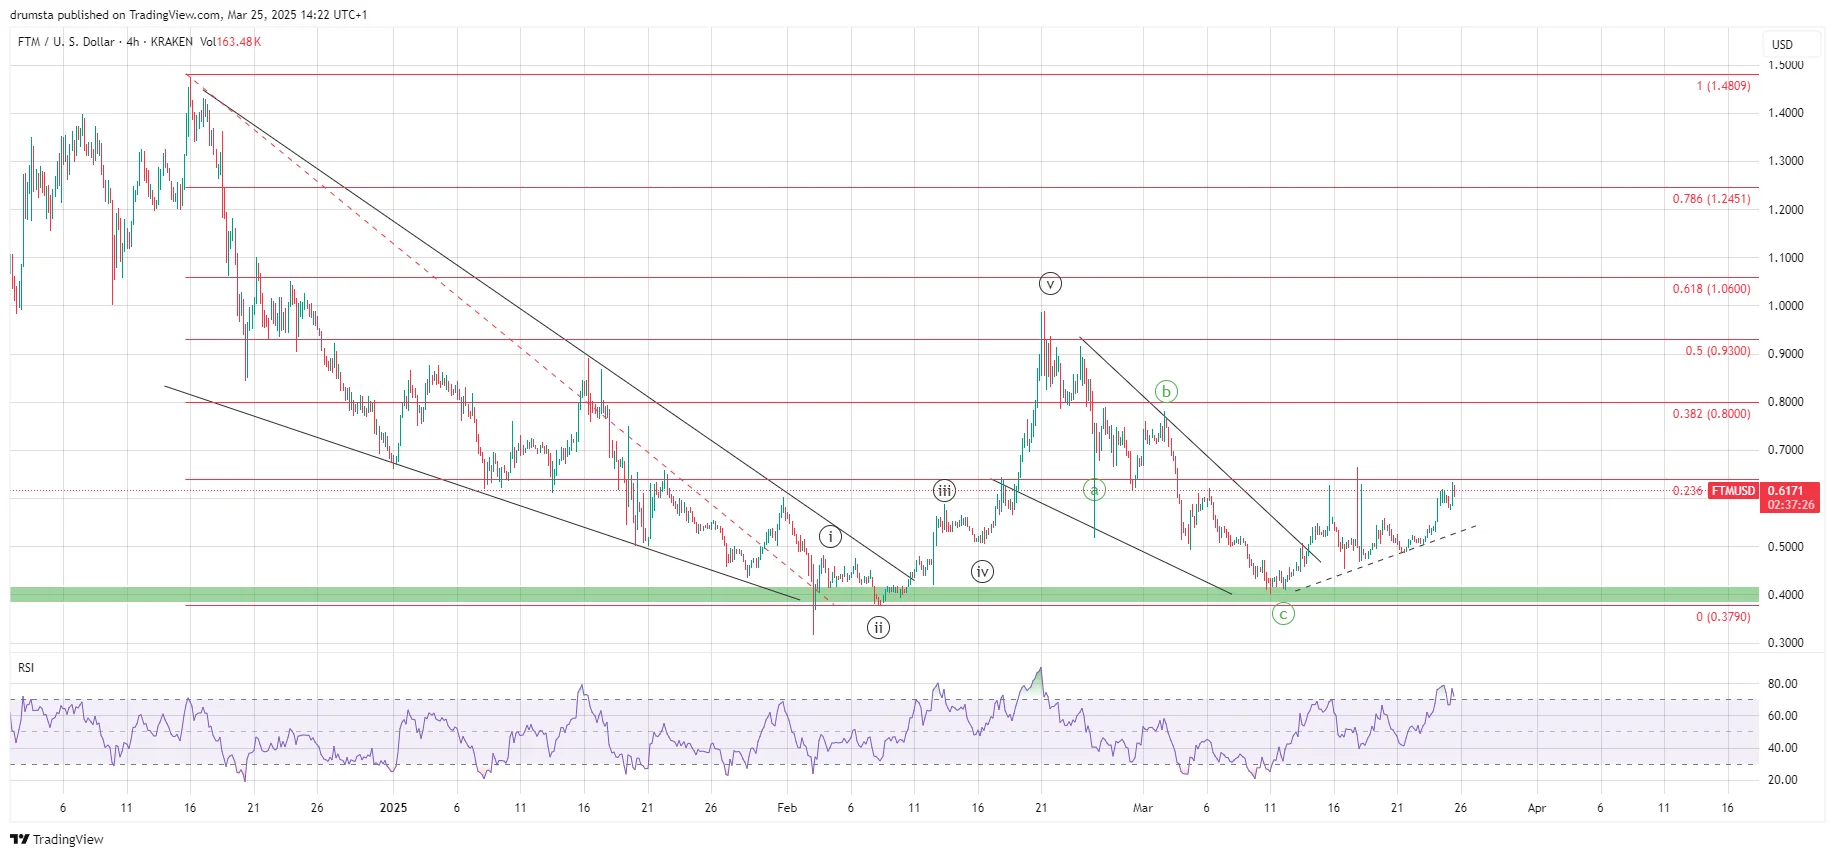
The 4-hour Sonic (S) chart shows a completed corrective structure within a falling wedge, marked by a distinct A-B-C wave count that culminated around the $0.38–$0.40 zone in early March.
This green demand area has held consistently as a base for buyers. Since then, Sonic has transitioned into a new bullish impulse, breaking out of the wedge.
Today, it revisited its high of $6.30 at the 0.236 Fibonacci level, which is being tested for resistance.
FTMUSD strong resistance at $6.30 | Credit: Nikola Lazic/TradingView
The Relative Strength Index (RSI) reading on this higher time frame shows a healthy rise but entered the overbought territory, suggesting potential for a pullback.
This rally also coincides with a confluence of Fibonacci retracement levels—especially the 0.236 ($0.6391) and 0.382 ($0.8000)—which now serve as pivot zones.
Additionally, the long-standing descending resistance‘s break confirms the structure shift.
Should Sonic hold above the breakout zone and establish a higher low, the next phase of this impulse wave could be underway, targeting higher Fibonacci levels at 0.618 ($1.06).
However, a failure to hold above $0.56 could suggest a deeper pullback or a truncated structure.
Sonic Price Prediction
On the 1-hour chart, Sonic (S) reveals a textbook impulsive rally in wave 3 from a low near $0.47, completing waves (i) through (iv) and now pushing into wave (v).
Some signs of struggle are seen, but the room to the upside remains.
FTMUSD in an ending wave of a lower degree | Credit: Nikola Lazic/TradingView
We can see an interaction with the 1.618 Fib extension at $0.712, which would conclude this advancement since March 21 as the higher degree wave 3.
RSI has bounced off neutral zones and remains bullish but must be watched for divergence as Sonic enters higher extensions.
Should the price reject strongly near $0.66–$0.71 without significant volume, a retracement toward $0.5874 or even $0.5621 (0.618 retracement) is possible before resumption.
The invalidation zone for this wave count lies below $0.5046, where wave (ii) began.
Given the rally’s strength and adherence to wave symmetry, momentum appears favorable for continuation—but only if support zones hold during minor pullbacks.
Sonic’s structure remains technically sound, with a clear, bullish progression supported by momentum and wave alignment.
A push toward the $0.71–$0.77 region remains likely if the support structure holds.
Disclaimer:
The information provided in this article is for informational purposes only. It is not intended to be, nor should it be construed as, financial advice. We do not make any warranties regarding the completeness, reliability, or accuracy of this information. All investments involve risk, and past performance does not guarantee future results. We recommend consulting a financial advisor before making any investment decisions.
Nikola Lazic is a cryptocurrency analyst and investor working in the industry since 2017. He holds a bachelor's degree in Sociology, which enables him to better understand the psychology behind the crowd´s positioning. Consequently his preferred analytical tool is Elliott Wave Theory in combination with price action analysis.
Combining his experience in trading and investing with knowledge in content writing he strives to bring the most accurate and actionable information.