Here is what the PUMP token burn could mean for the price | Credit: Hameem Sarwar
Share
Key Takeaways
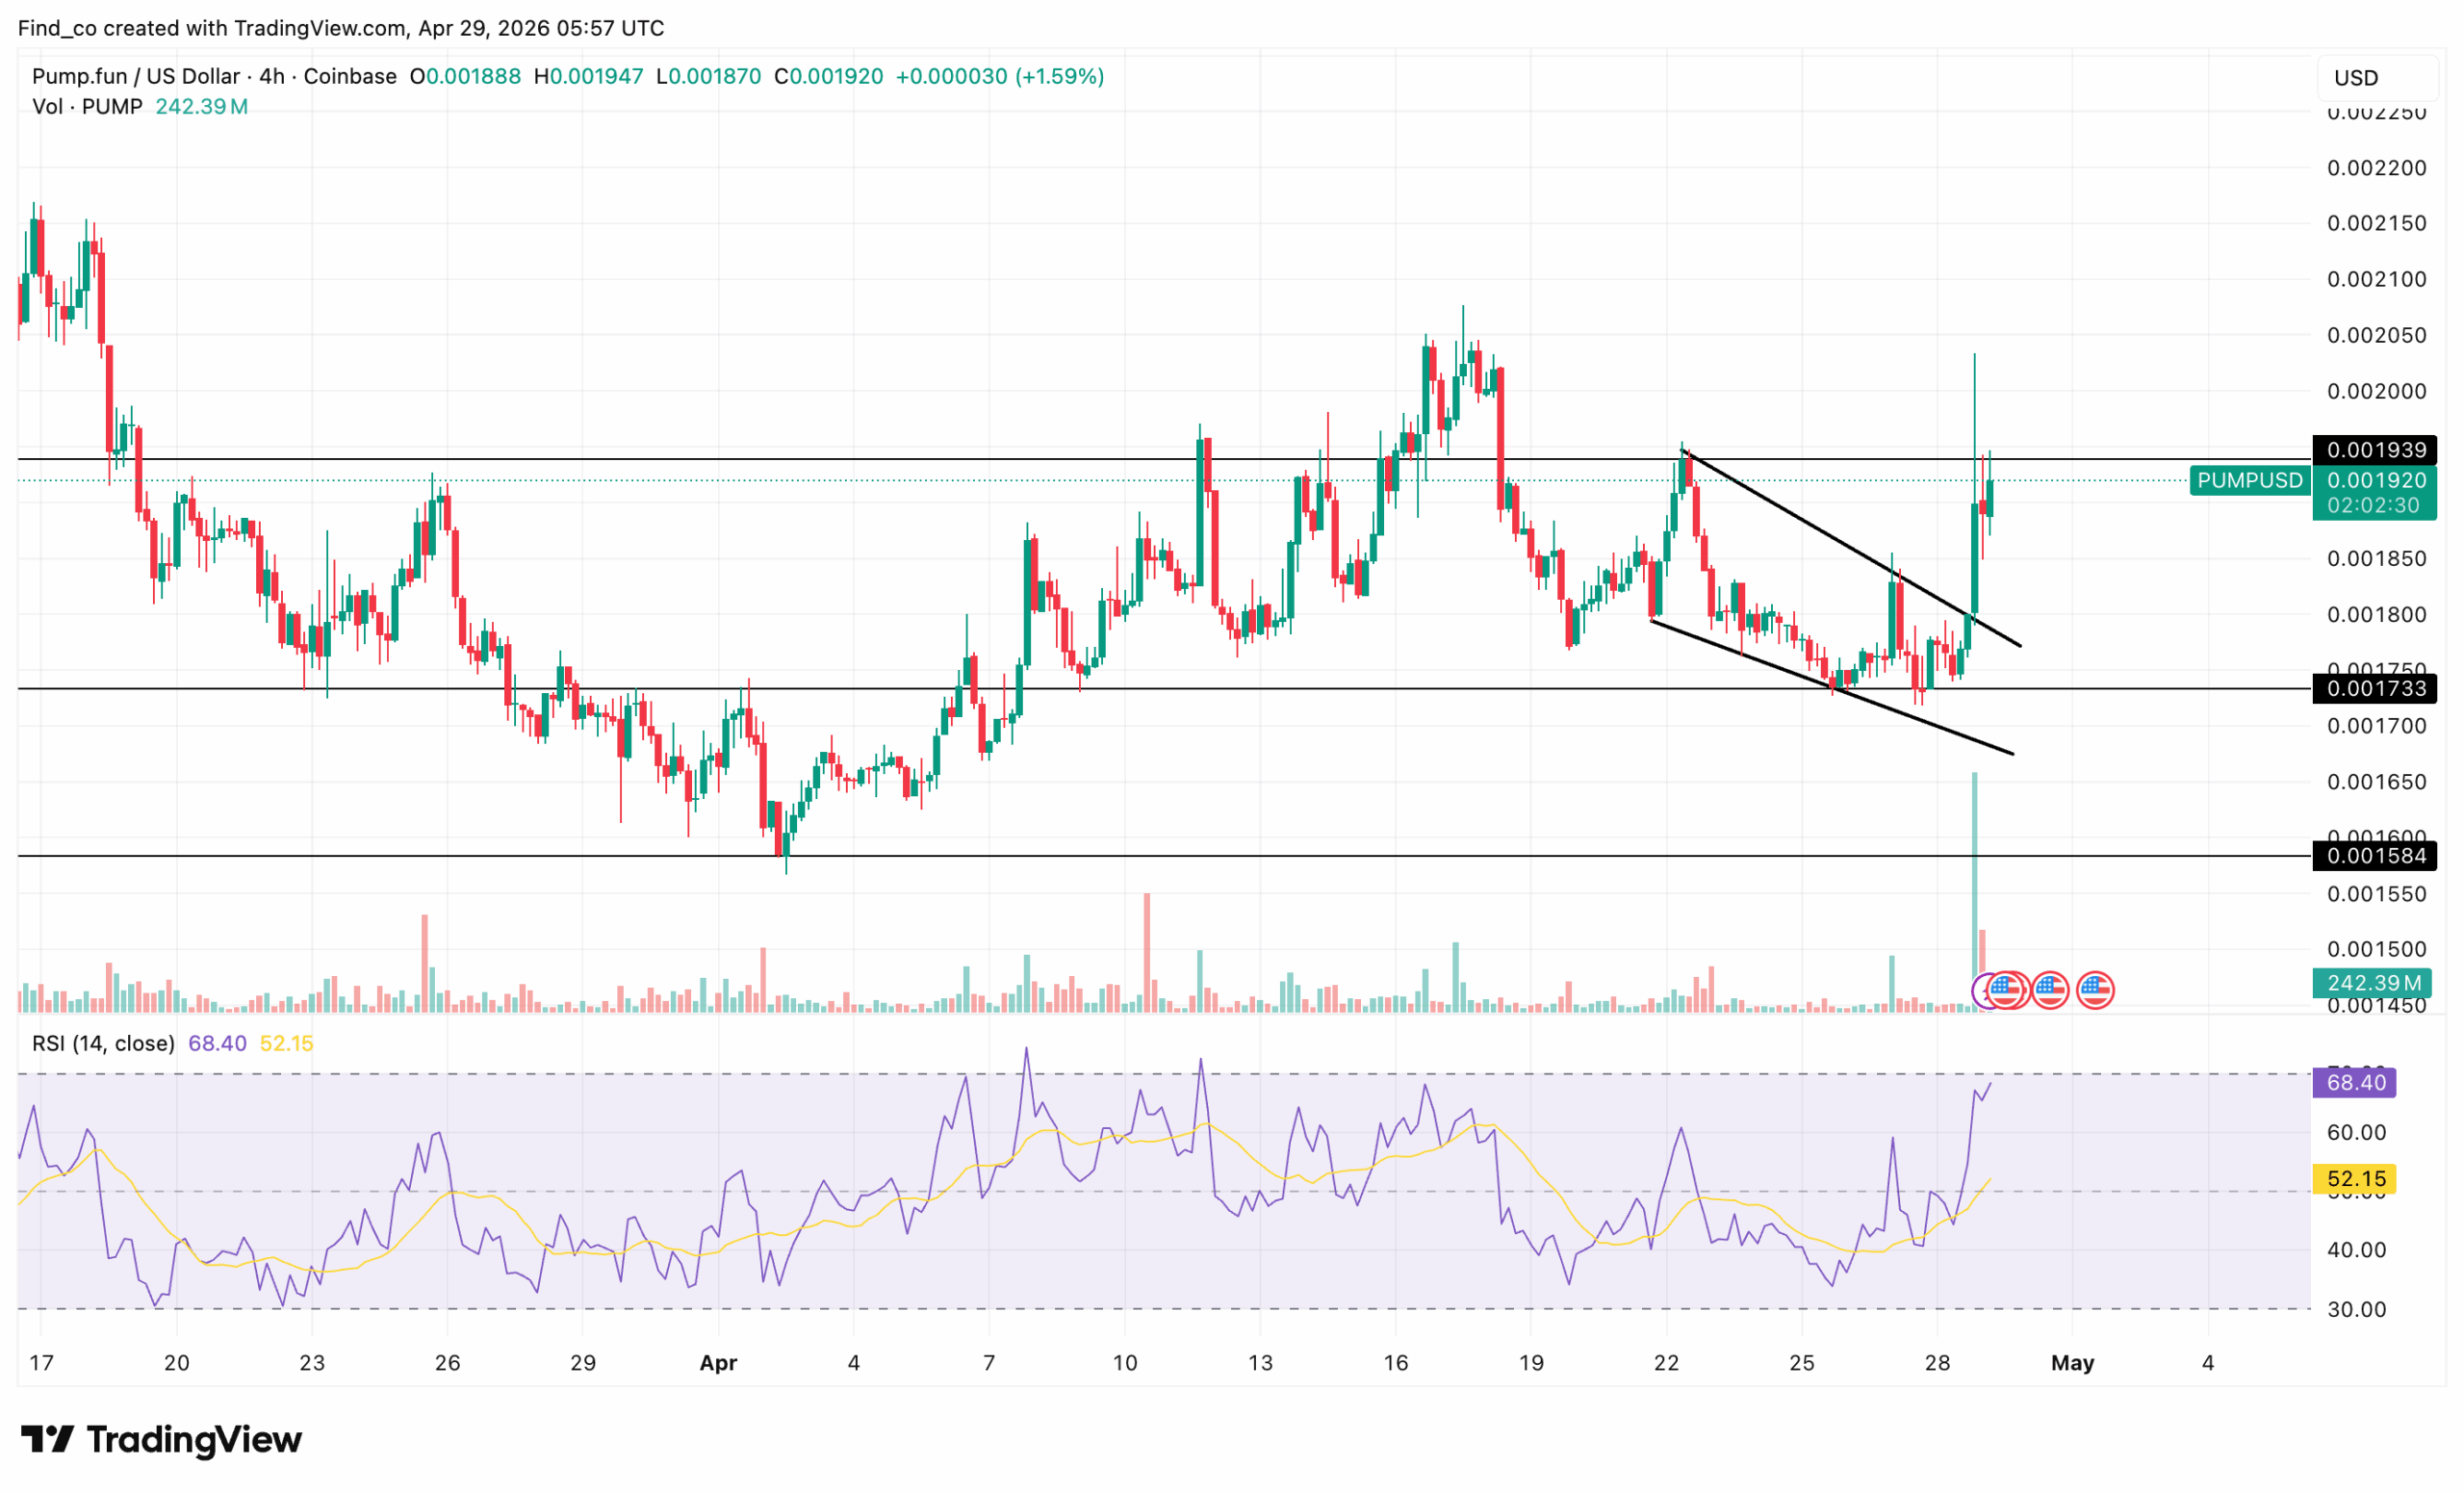
PUMP rebounded after a massive 36% supply burn, breaking its downtrend and testing resistance near $0.0019.
Short-term upside is possible, but it is overbought, and sentiment remains weak, making the rally unstable.
If PUMP holds above $0.0017, it could extend the bounce, but it also risks a decline — here’s how.
After eight straight days of losses, PUMP, the native token of the Pump.fun platform, has finally broken its downtrend.
The timing isn’t random. The move came shortly after the Solana-based launchpad announced it had permanently removed 36% of the token’s supply from circulation.
But will this massive burn be enough to push the price higher? Let’s take a closer look.
The $370 Million Changes the Structure
On April 29, Pump.fun confirmed a large-scale token burn.
These tokens were worth around $370 million, representing roughly 36% of the circulating supply.
The move, it said, was aimed at strengthening trust within its community.
Sponsored
Disclosure
We sometimes use affiliate links in our content, when clicking on those we might receive a commission at no extra cost to you. By using this website you agree to our terms and conditions and privacy policy.
If PUMP can hold above $0.0019 and build support rather than rejection, this breakout is likely to extend toward $0.0021.
If it fails here and drops back below $0.0017, then the breakout becomes more of a liquidity grab.
On-Chain Data Provides More Context
This isn’t the first time PUMP has reacted this way.
A few months ago, Pump.fun introduced a buyback-and-burn mechanism that helped lift the token’s price. But this latest move feels more significant, largely because of its scale.
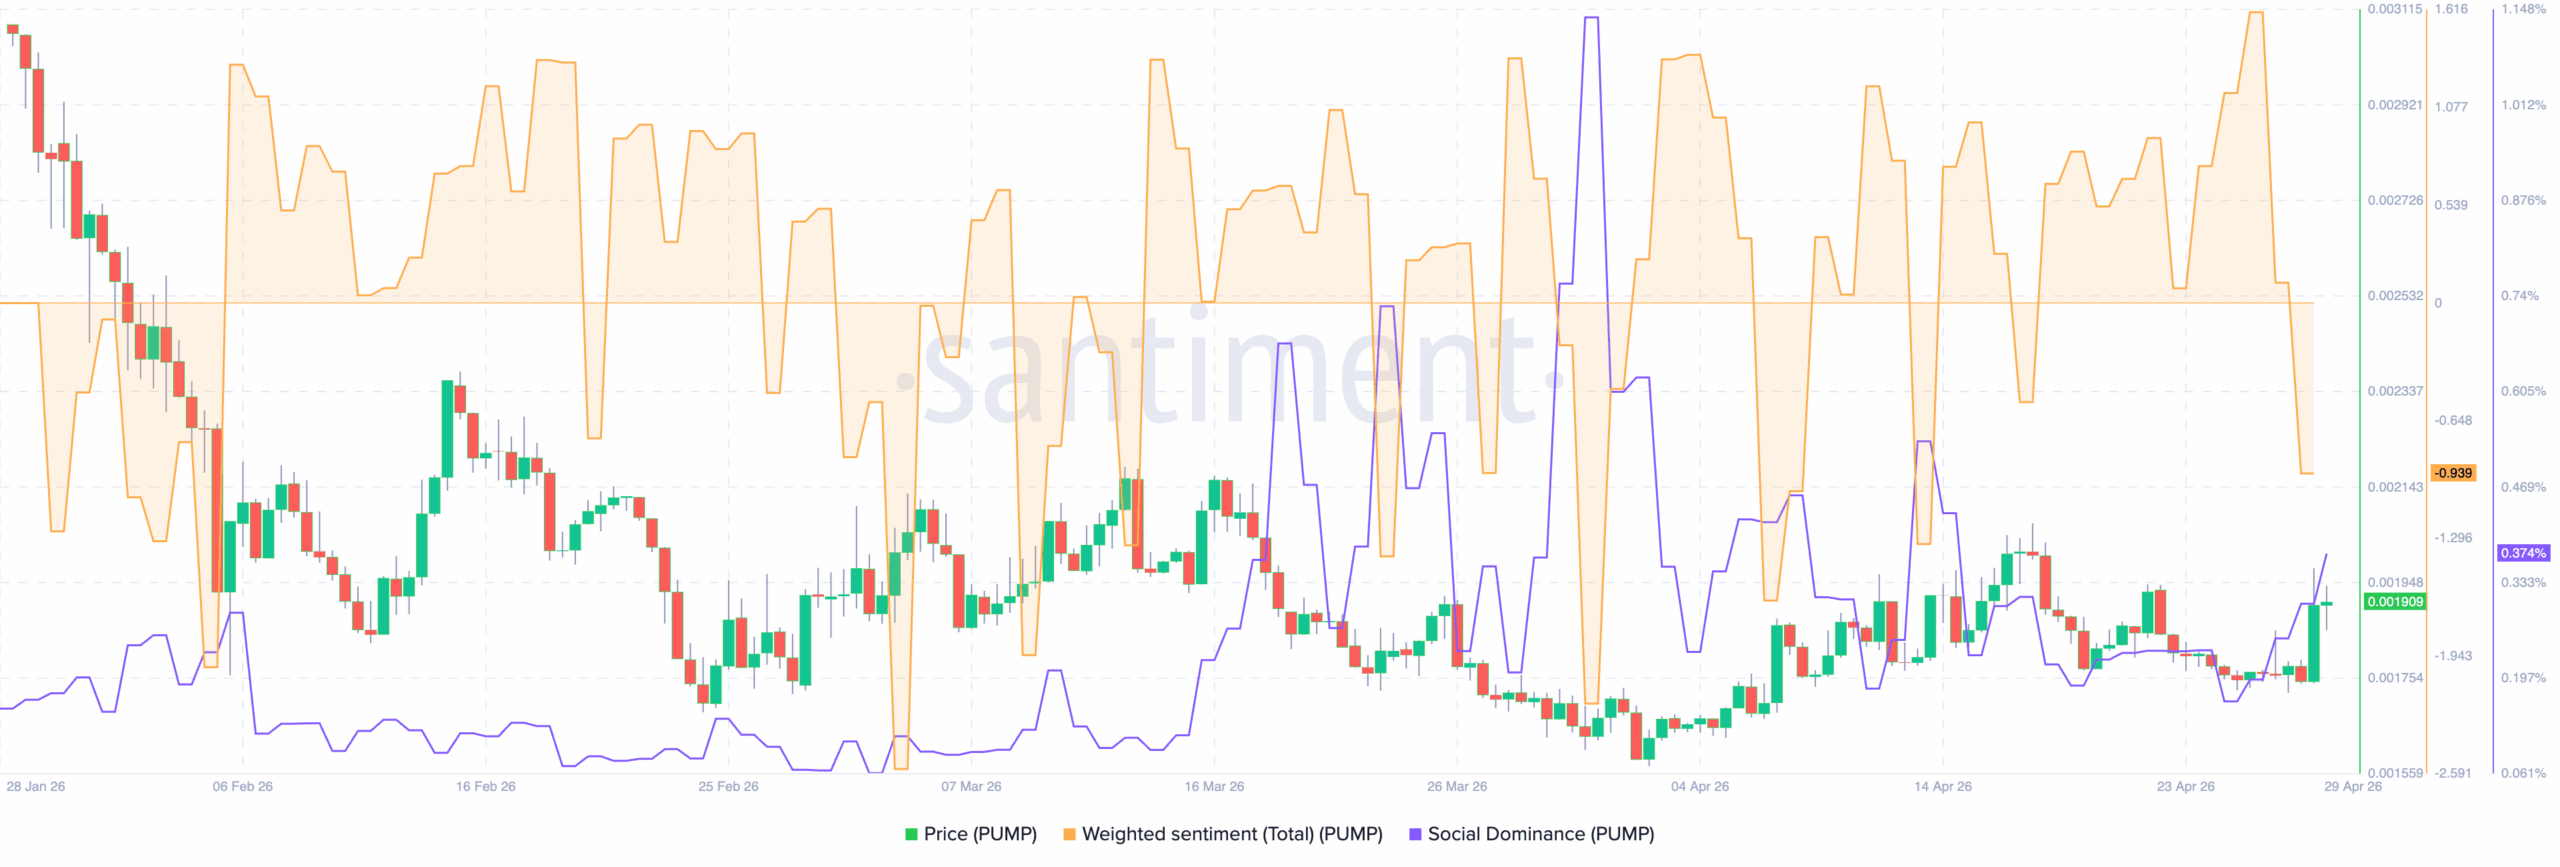
On-chain data adds another layer to the picture. Weighted sentiment has slipped back into negative territory, suggesting that confidence has cooled after the recent rally.
That kind of backdrop can limit follow-through, as rallies without strong sentiment often lack conviction.
However, social dominance is rising at the same time, which means attention is coming back to PUMP.
More eyes on the token increases participation and liquidity, even if that participation is skeptical.
Historically, this combination usually creates an unstable upside. For instance, it can push PUMP’s price higher in the short term through short squeezes and reactive buying.
But those moves tend to be choppy and prone to rejection because they aren’t backed by strong belief.
PUMP Weighted Sentiment and Social Dominance | Credit: Santiment
So the current setup supports bursts of upside, but not a smooth trend.
For a more sustained move, you’d want to see sentiment start turning positive while social dominance remains elevated.
But right now, it’s more of a squeeze-driven environment than a conviction-driven one.
PUMP Price Prediction
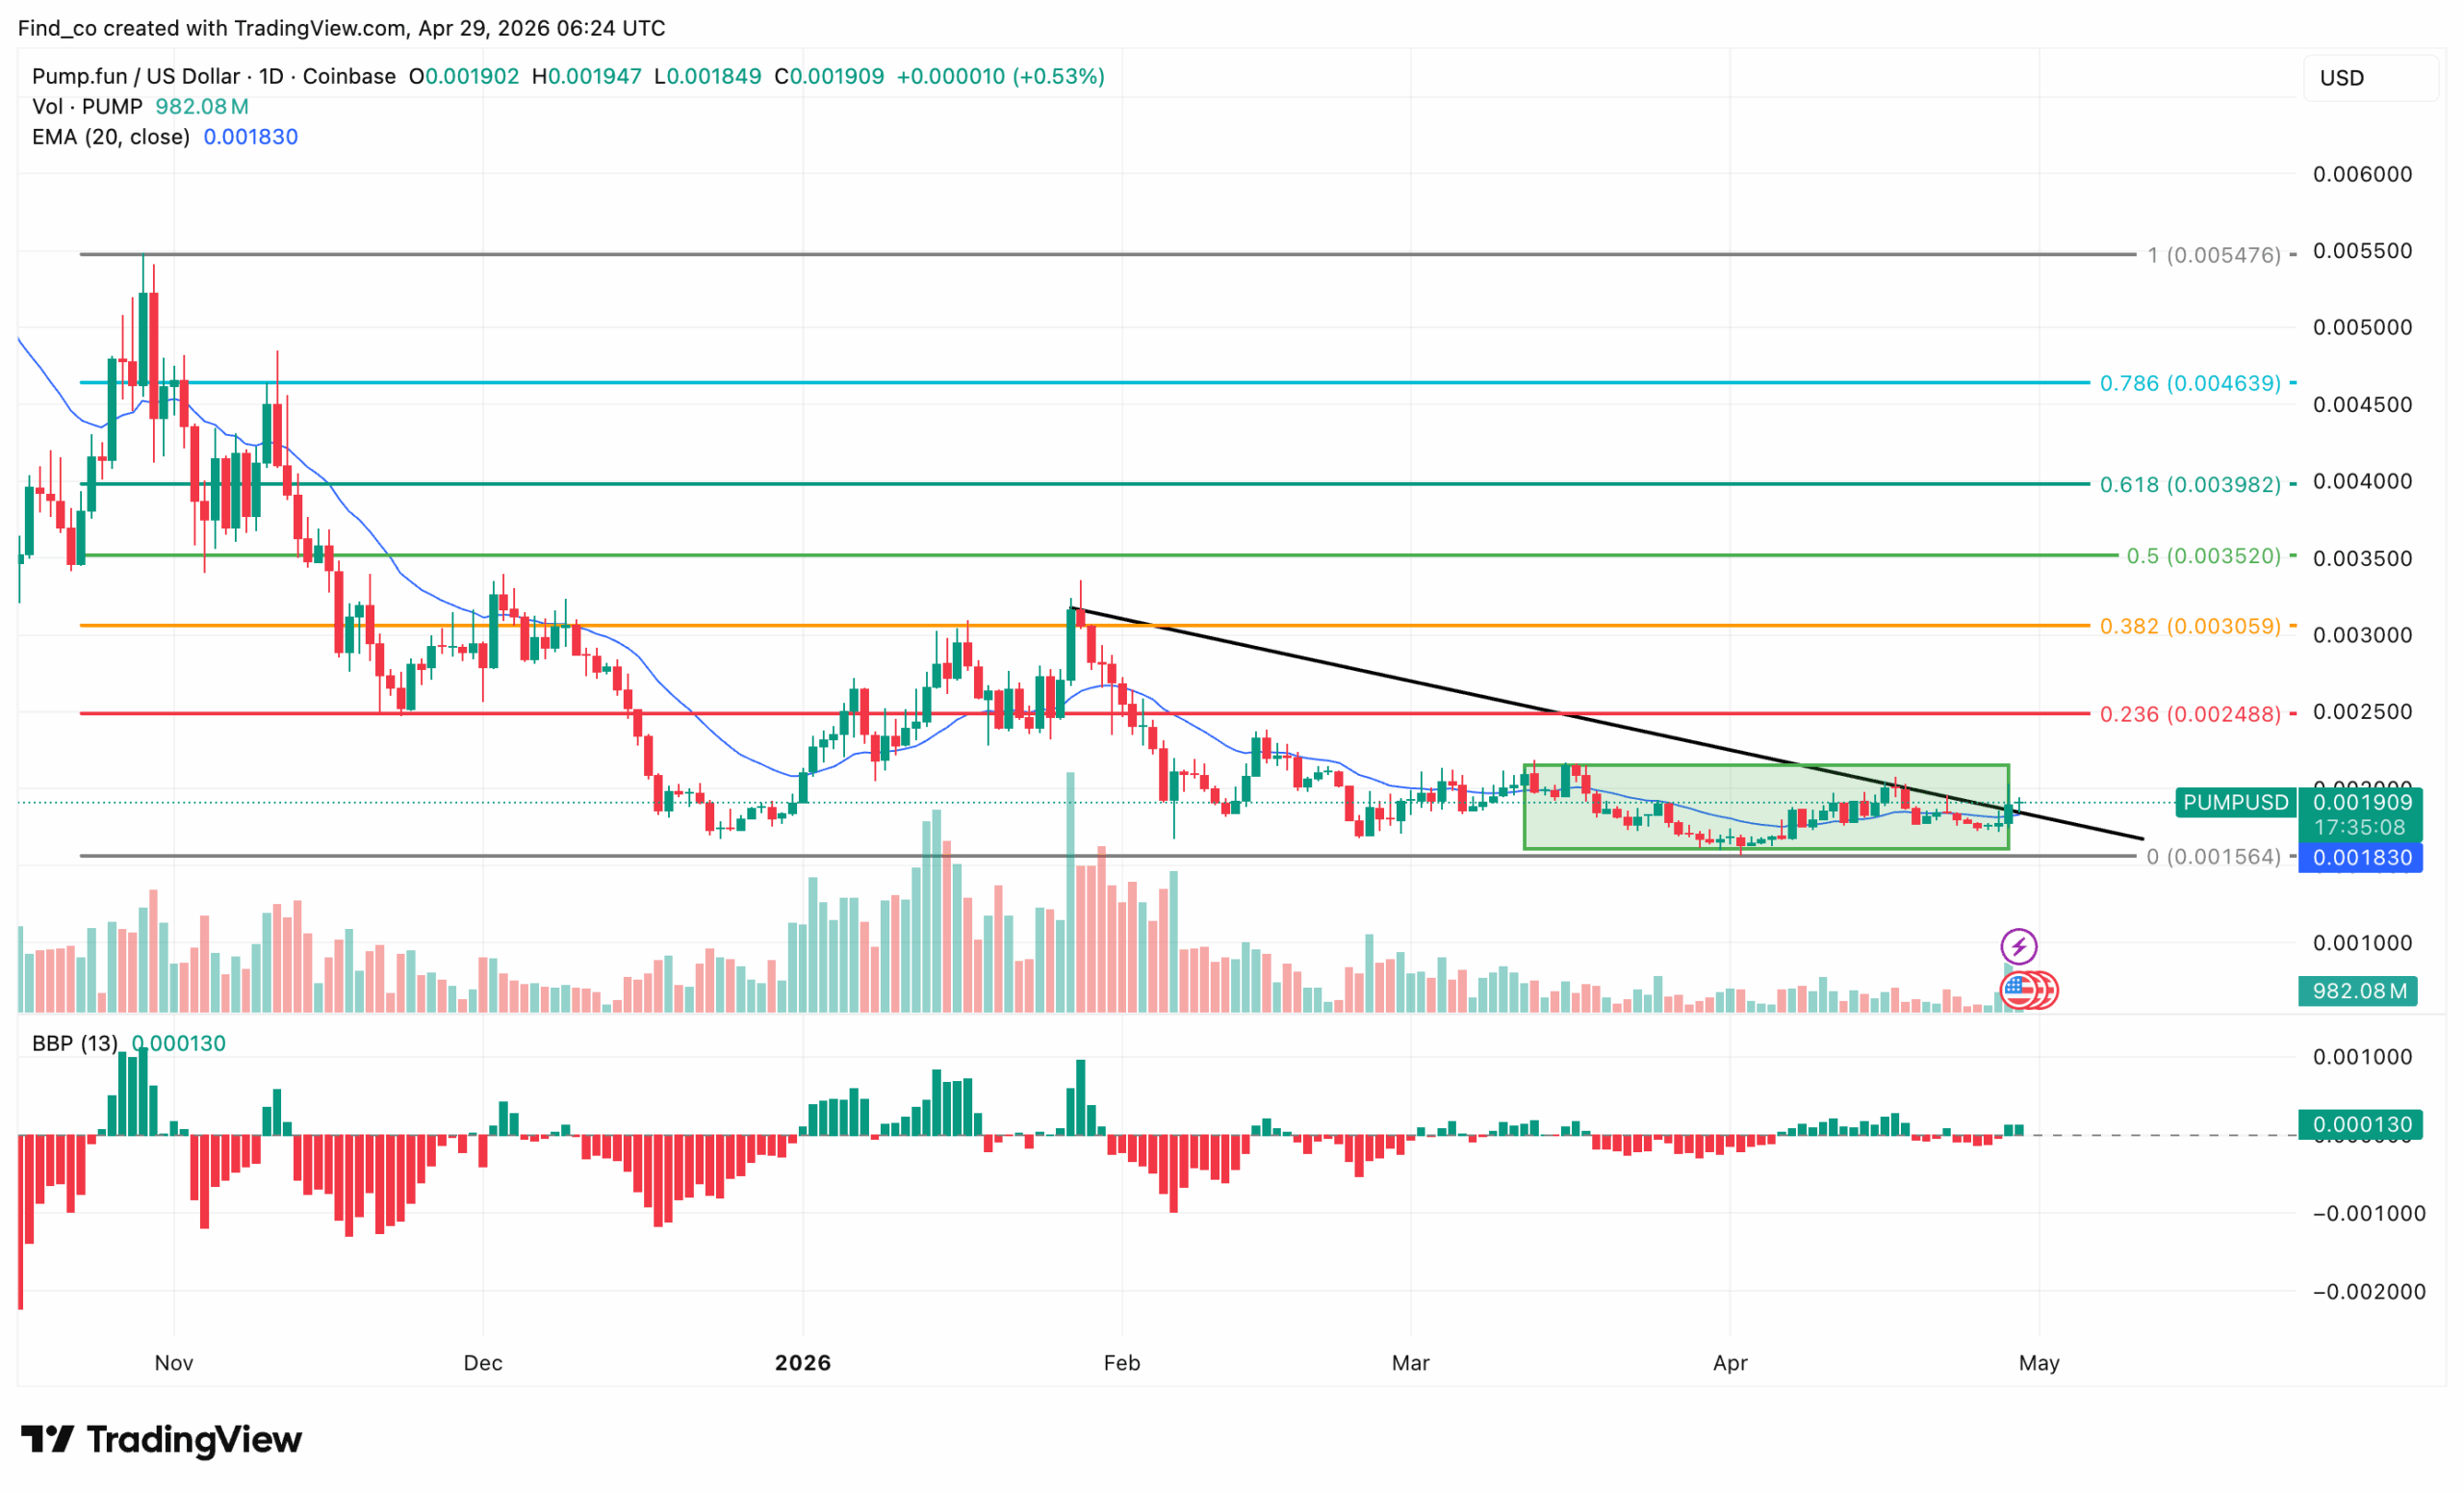
On the daily chart, PUMP was still structurally in a downtrend on the higher timeframe.
As shown below, the price has been compressing inside that green box while repeatedly holding the $0.0016 area.
The descending trendline is the key resistance, and PUMP is pressing right into it while also reclaiming the 20 EMA ($0.0018).
If PUMP can hold above that EMA and break the trendline, that would signal a potential trend transition rather than just another lower high.
Meanwhile, volume has been relatively muted during the range, which is typical for accumulation.
Additionally, the Bull Bear Power (BBP) is slightly positive, suggesting early buyer strength is creeping in.
However, the move is still weak, so this isn’t a confirmed breakout yet.
On the upside, the first real level to watch is around $0.0025 (0.236 fib), then $0.0031 (0.382 fib).
That entire zone is where previous breakdowns happened, so supply is likely sitting there.
A break above those would confirm that the accumulation range resolved bullishly.
On the downside, losing the range low around $0.0016 would invalidate the support and likely send the PUMP’s price back toward fresh lows, since there’s very little structure underneath.
So right now it’s a compression at resistance. Either it breaks the trendline and rotates toward $0.0030, or it rejects and stays stuck in the broader downtrend.
Disclaimer:
The information provided in this article is for informational purposes only. It is not intended to be, nor should it be construed as, financial advice. We do not make any warranties regarding the completeness, reliability, or accuracy of this information. All investments involve risk, and past performance does not guarantee future results. We recommend consulting a financial advisor before making any investment decisions.
Victor Olanrewaju is a crypto analyst and reporter at CCN with deep roots in on-chain research and technical analysis. His crypto journey began in 2017, but it was the 2020 Uniswap airdrop that sparked a full-time pivot into the space.
With a foundation in copywriting, Victor honed his craft creating high-converting content for leading crypto brokers — most notably an XRP price prediction that ranked #1 on Google during the 2021 bull run.
He later joined AMBCrypto in 2022, where he combined storytelling with technical and on-chain analysis to cover key market narratives.
In 2024, he expanded his expertise at BeInCrypto, collaborating with analysts and using tools like Glassnode, Santiment, and IntoTheBlock to break down Bitcoin and altcoin trends.
At CCN, Victor covers the top cryptocurrencies, memecoins, macro shifts, blending real-time insights with deep-dive metrics.
He holds a Bachelor’s degree in Physics from the University of Ibadan, equipping him to simplify complex data for a wide audience. Follow his work or connect on LinkedIn or X.