Solana price is unlikely to erase recent losses. | Credit: Hameem Sarwar
Share
Key Takeaways
Softer PPI data fails to trigger Solana’s upswing, as price remains capped below resistance.
Rejection persists at key levels as SOL stalls at $86, with lower highs reinforcing weakness.
Weak momentum and selling pressure have increased the likelihood of a drop toward $76.
Softer inflation data was supposed to lift risk assets. It didn’t—at least not for Solana (SOL).
While the latest U.S. Producer Price Index (PPI) showed a weaker-than-expected increase in wholesale prices, signaling easing inflation pressures, Solana’s price failed to capitalize on the shift.
Instead of breaking higher alongside improving macro sentiment, the altcoin remained stuck, unable to build momentum above key resistance levels.
That disconnect is starting to stand out. Here is what happened and what could be next for SOL.
Sponsored
Disclosure
We sometimes use affiliate links in our content, when clicking on those we might receive a commission at no extra cost to you. By using this website you agree to our terms and conditions and privacy policy.
While Solana’s price attempted a push higher, technical indicators now suggest weakening strength, raising the risk of another pullback.
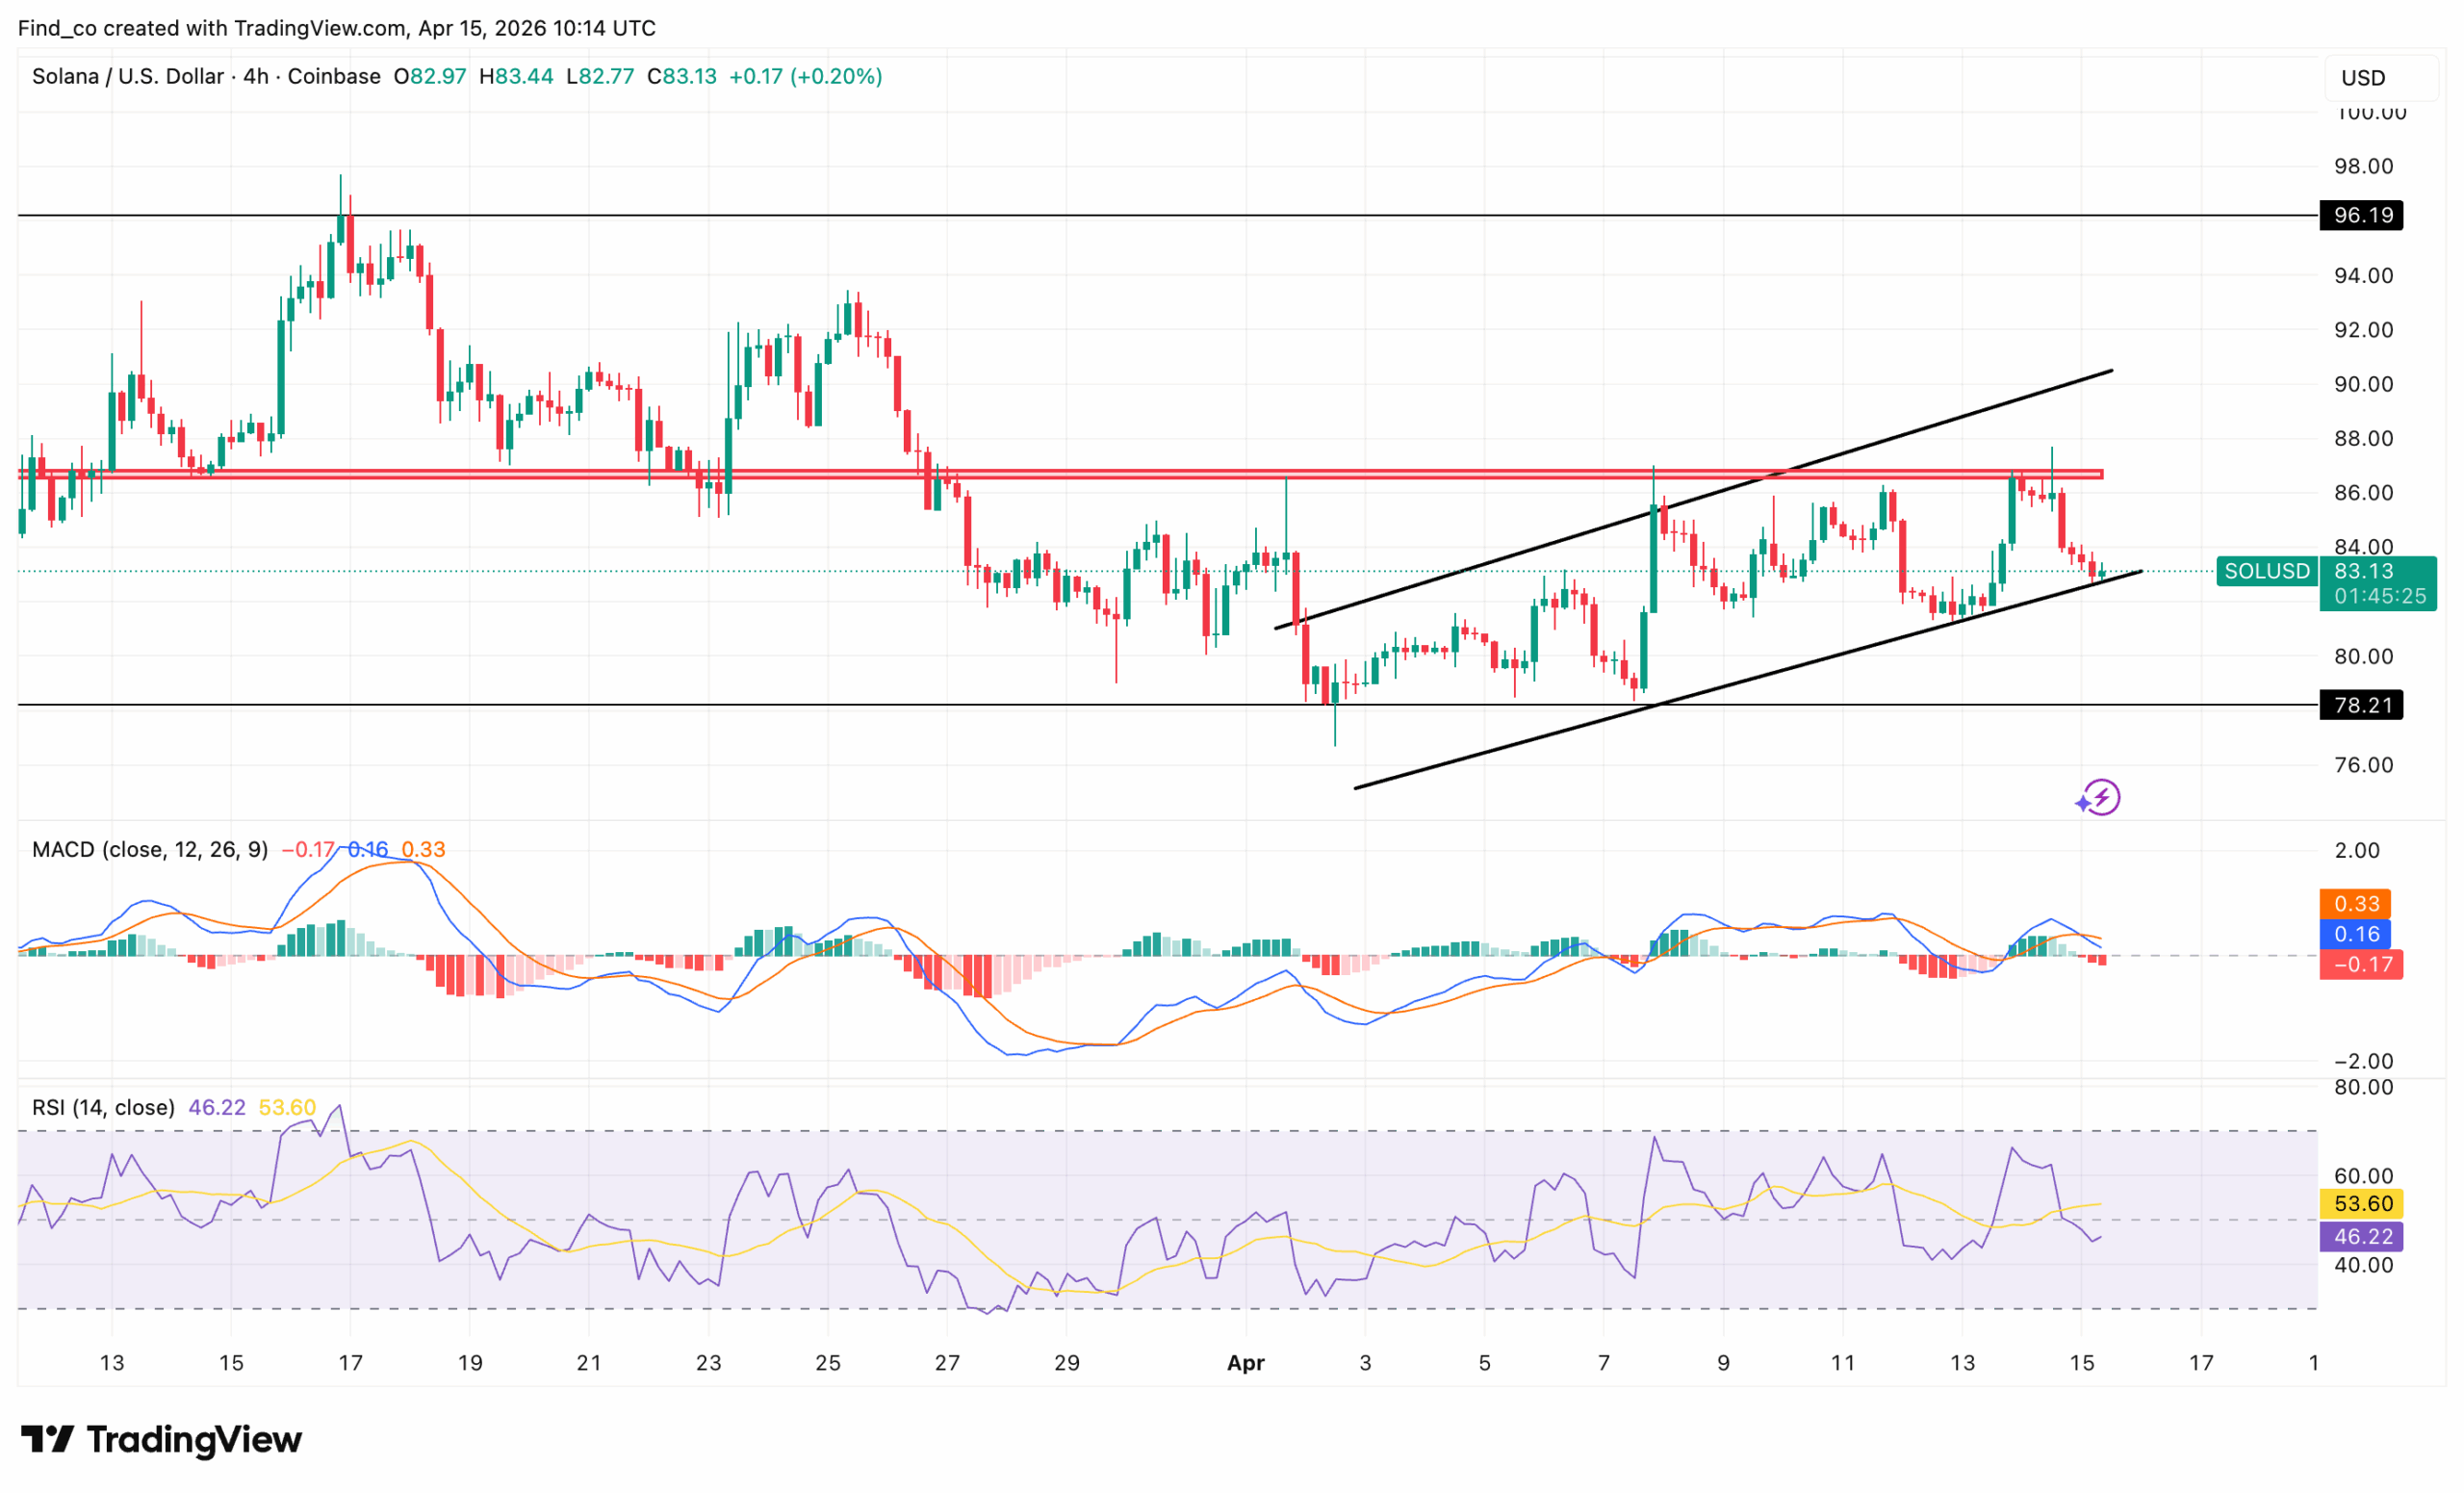
On the 4-hour chart, SOL remains capped below the $86-$88 resistance zone.
Each attempt to break higher has been rejected, forming a series of lower highs in the short term.
Meanwhile, the price is drifting back toward the mid-range near $83, signaling indecision.
However, the broader structure still holds within a horizontal channel.
Support sits firmly around the $76-$78 region, which has acted as a strong demand zone in recent sessions.
As long as this level holds, the range-bound structure remains intact.
Momentum indicators are now tilting bearish.
The Moving Average Convergence Divergence (MACD) has crossed downward, with histogram bars turning red, indicating fading bullish momentum.
At the same time, the Relative Strength Index (RSI) has dropped toward the mid-40s, suggesting weakening buying pressure without yet entering oversold territory.
SOL’s price now appears to be losing steam after its recent bounce.
If sellers maintain control, the price could revisit lower support levels before any meaningful recovery attempt.
PPI Data Comes in Softer Than Expected
As stated earlier, the PPI came in below expectations.
The latest PPI report showed that wholesale inflation rose 0.5% in March, significantly below expectations of around 1.1%.
On an annual basis, PPI climbed roughly 4%, marking the fastest pace since early 2023.
However, the more important detail was beneath the surface.
Core PPI, which strips out food and energy, increased only marginally, signaling that underlying inflation pressures may be easing.
In most cases, this kind of data supports risk assets.
Lower-than-expected inflation reduces pressure on central banks and can improve liquidity expectations across markets, including the crypto market.
But Solana’s price didn’t react.
SOL Price Forecast: No Clear Bullish Breakout
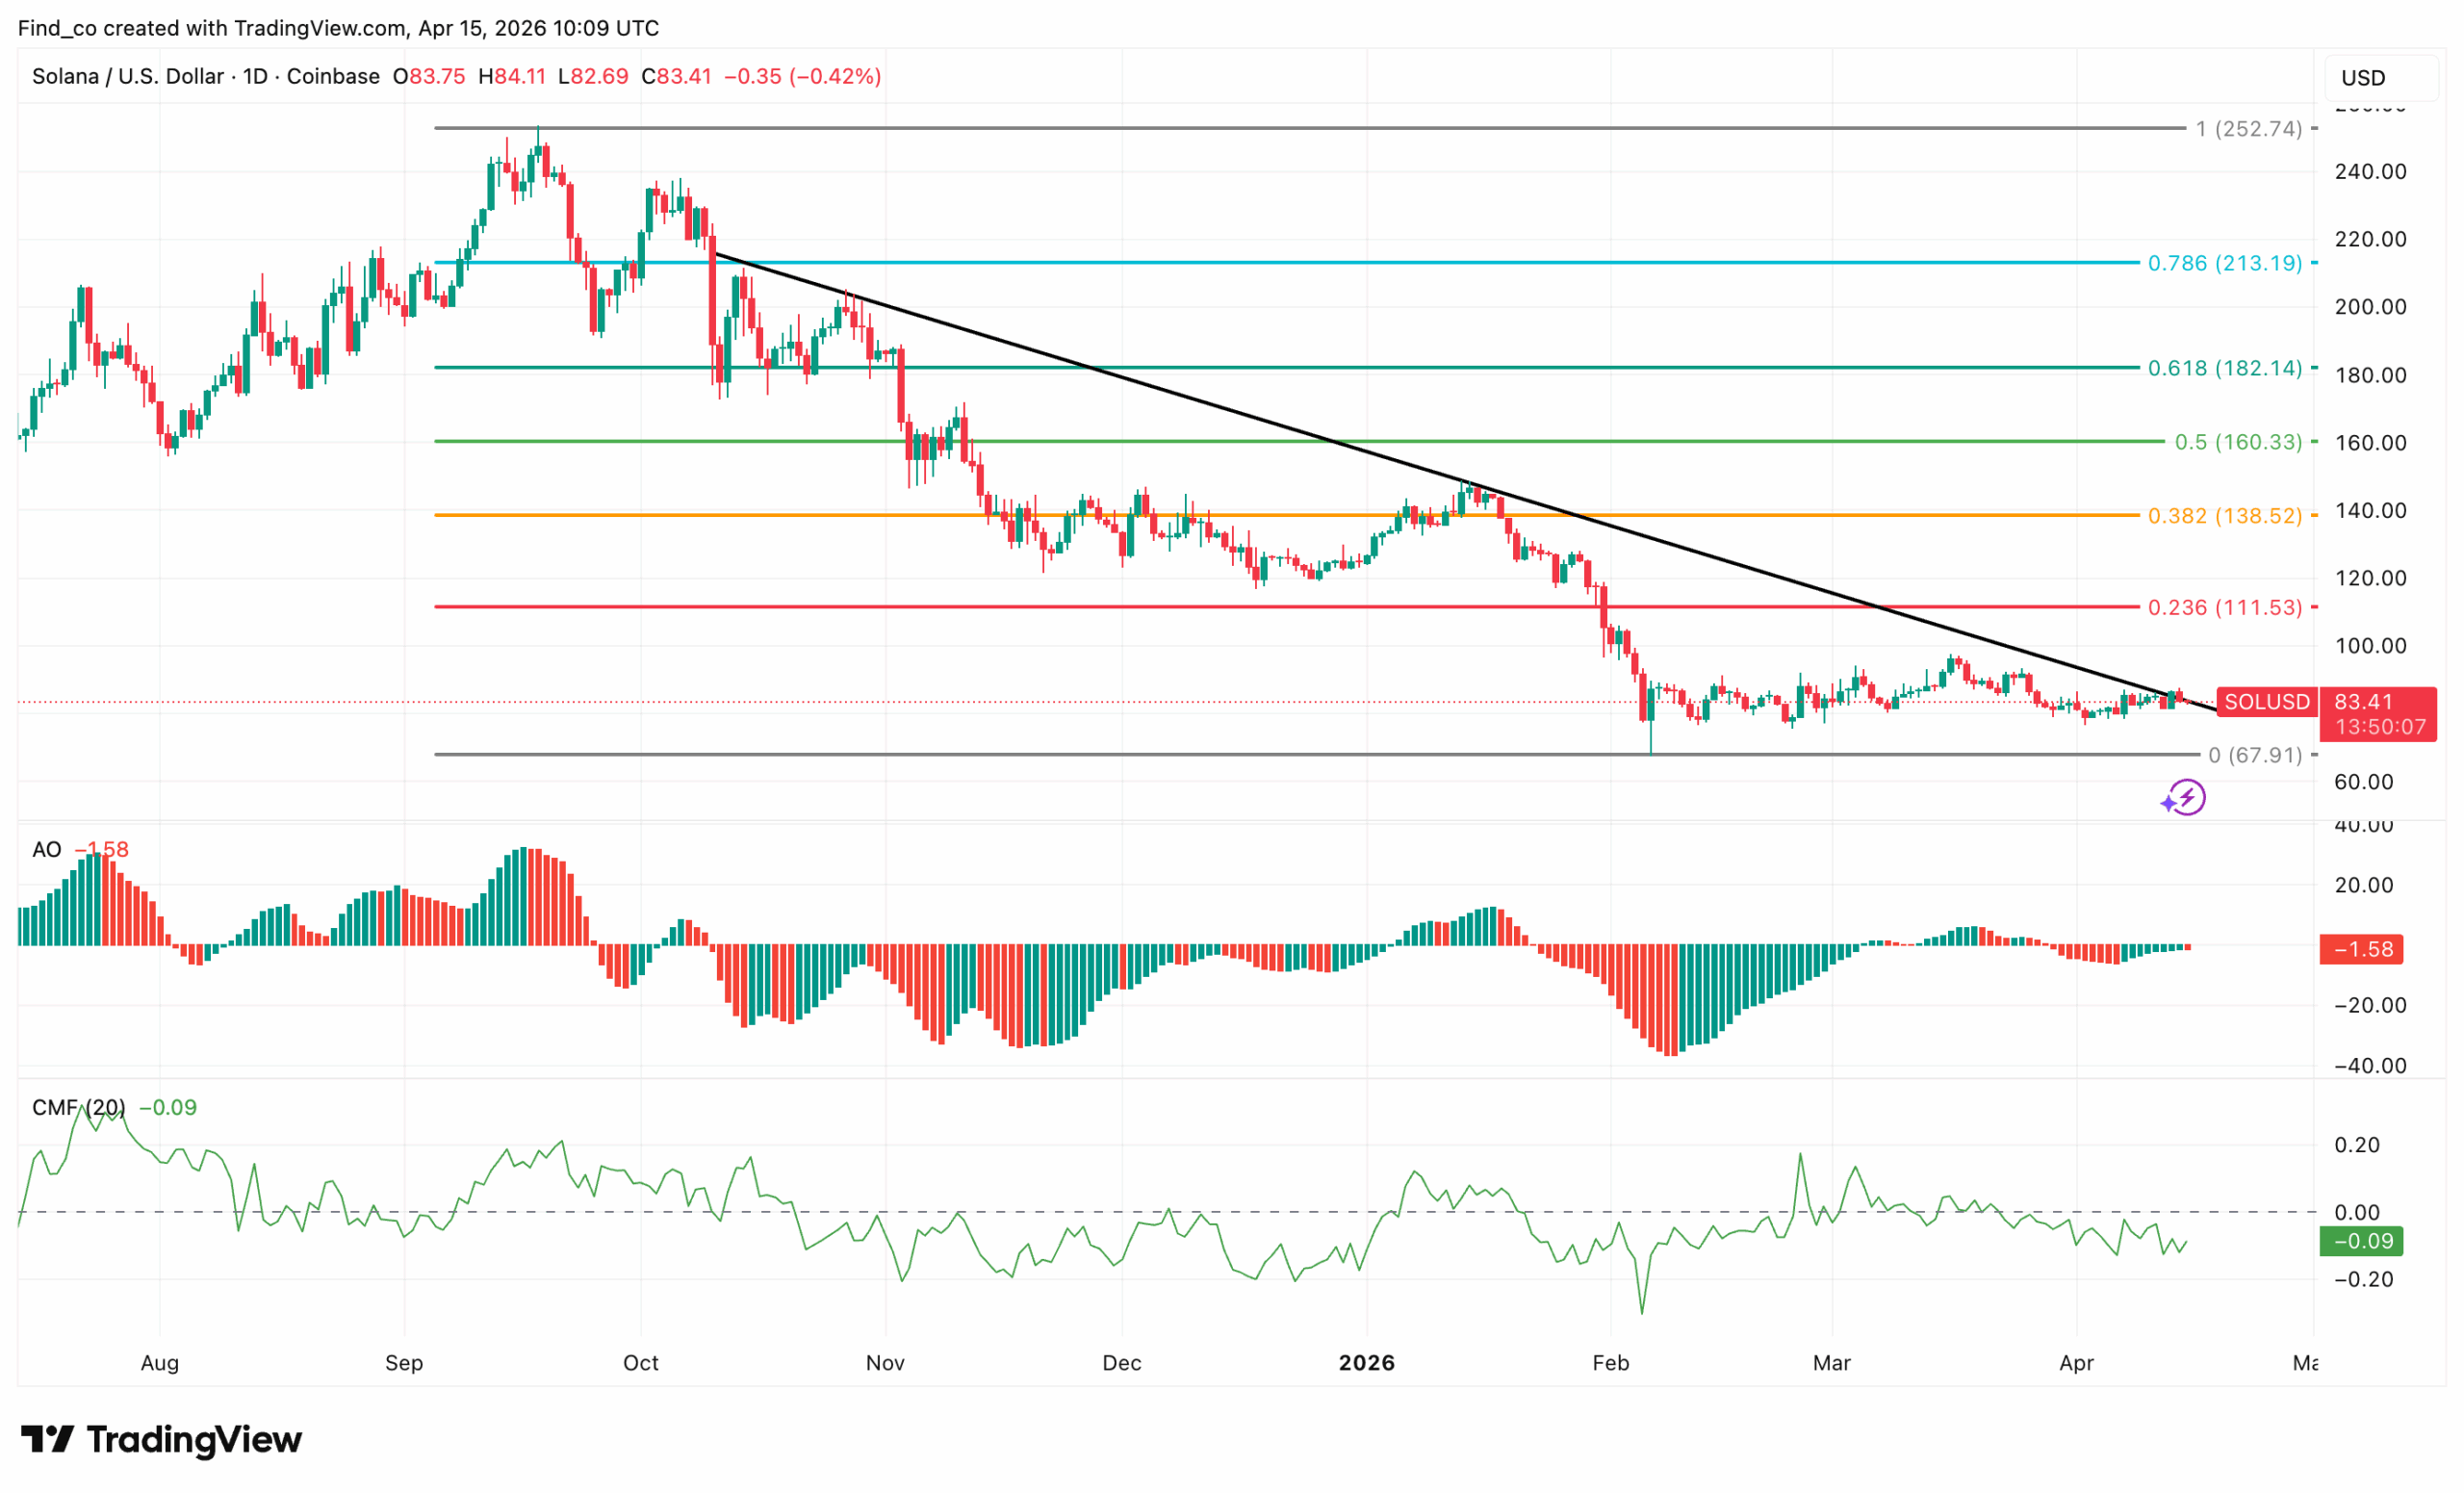
On the daily chart, SOL remains under sustained bearish pressure, trading near $83 after a sharp breakdown from the $110 region.
The broader structure continues to print lower highs, reinforcing seller dominance.
Although SOL’s price rebounded from the $67 support zone, the recovery quickly stalled, signaling weak bullish follow-through.
Momentum indicators confirm this cautious outlook.
The Awesome Oscillator (AO) remains below zero, although fading red bars suggest selling pressure is easing slightly. However, this shift lacks the strength to confirm a reversal.
At the same time, the Chaikin Money Flow (CMF) stays negative, indicating continued capital outflows and limited buyer commitment.
Meanwhile, Solana’s price is consolidating below key resistance at $111, which aligns with the 0.236 Fibonacci level.
A decisive breakout above this zone could trigger a short-term recovery toward $138. Until then, the trend favors the downside, with $67 acting as critical support.
Disclaimer:
The information provided in this article is for informational purposes only. It is not intended to be, nor should it be construed as, financial advice. We do not make any warranties regarding the completeness, reliability, or accuracy of this information. All investments involve risk, and past performance does not guarantee future results. We recommend consulting a financial advisor before making any investment decisions.
Victor Olanrewaju is a crypto analyst and reporter at CCN with deep roots in on-chain research and technical analysis. His crypto journey began in 2017, but it was the 2020 Uniswap airdrop that sparked a full-time pivot into the space.
With a foundation in copywriting, Victor honed his craft creating high-converting content for leading crypto brokers — most notably an XRP price prediction that ranked #1 on Google during the 2021 bull run.
He later joined AMBCrypto in 2022, where he combined storytelling with technical and on-chain analysis to cover key market narratives.
In 2024, he expanded his expertise at BeInCrypto, collaborating with analysts and using tools like Glassnode, Santiment, and IntoTheBlock to break down Bitcoin and altcoin trends.
At CCN, Victor covers the top cryptocurrencies, memecoins, macro shifts, blending real-time insights with deep-dive metrics.
He holds a Bachelor’s degree in Physics from the University of Ibadan, equipping him to simplify complex data for a wide audience. Follow his work or connect on LinkedIn or X.