Despite short-term stability, PEPE remains locked within a long-term descending channel | Credit: Hameem Sarwar
Share
Key Takeaways
Pepe remains trapped in a tight consolidation range between $0.0000031 and $0.0000038.
Momentum indicators hint at easing selling pressure as the CMF has moved back above zero.
PEPE still trades inside a long-term descending structure, with $0.00000280 acting as critical support.
PEPE’s price remains under pressure after its February decline.
However, the pace of selling is slowing. The memecoin is now consolidating near $0.0000033 after falling roughly 15% from its recent local high.
As volatility fades, traders are watching closely to see whether the market forms a recovery base or prepares for another leg lower.
So, what’s next for PEPE’s price?
Resistance Rejection Remains Strong
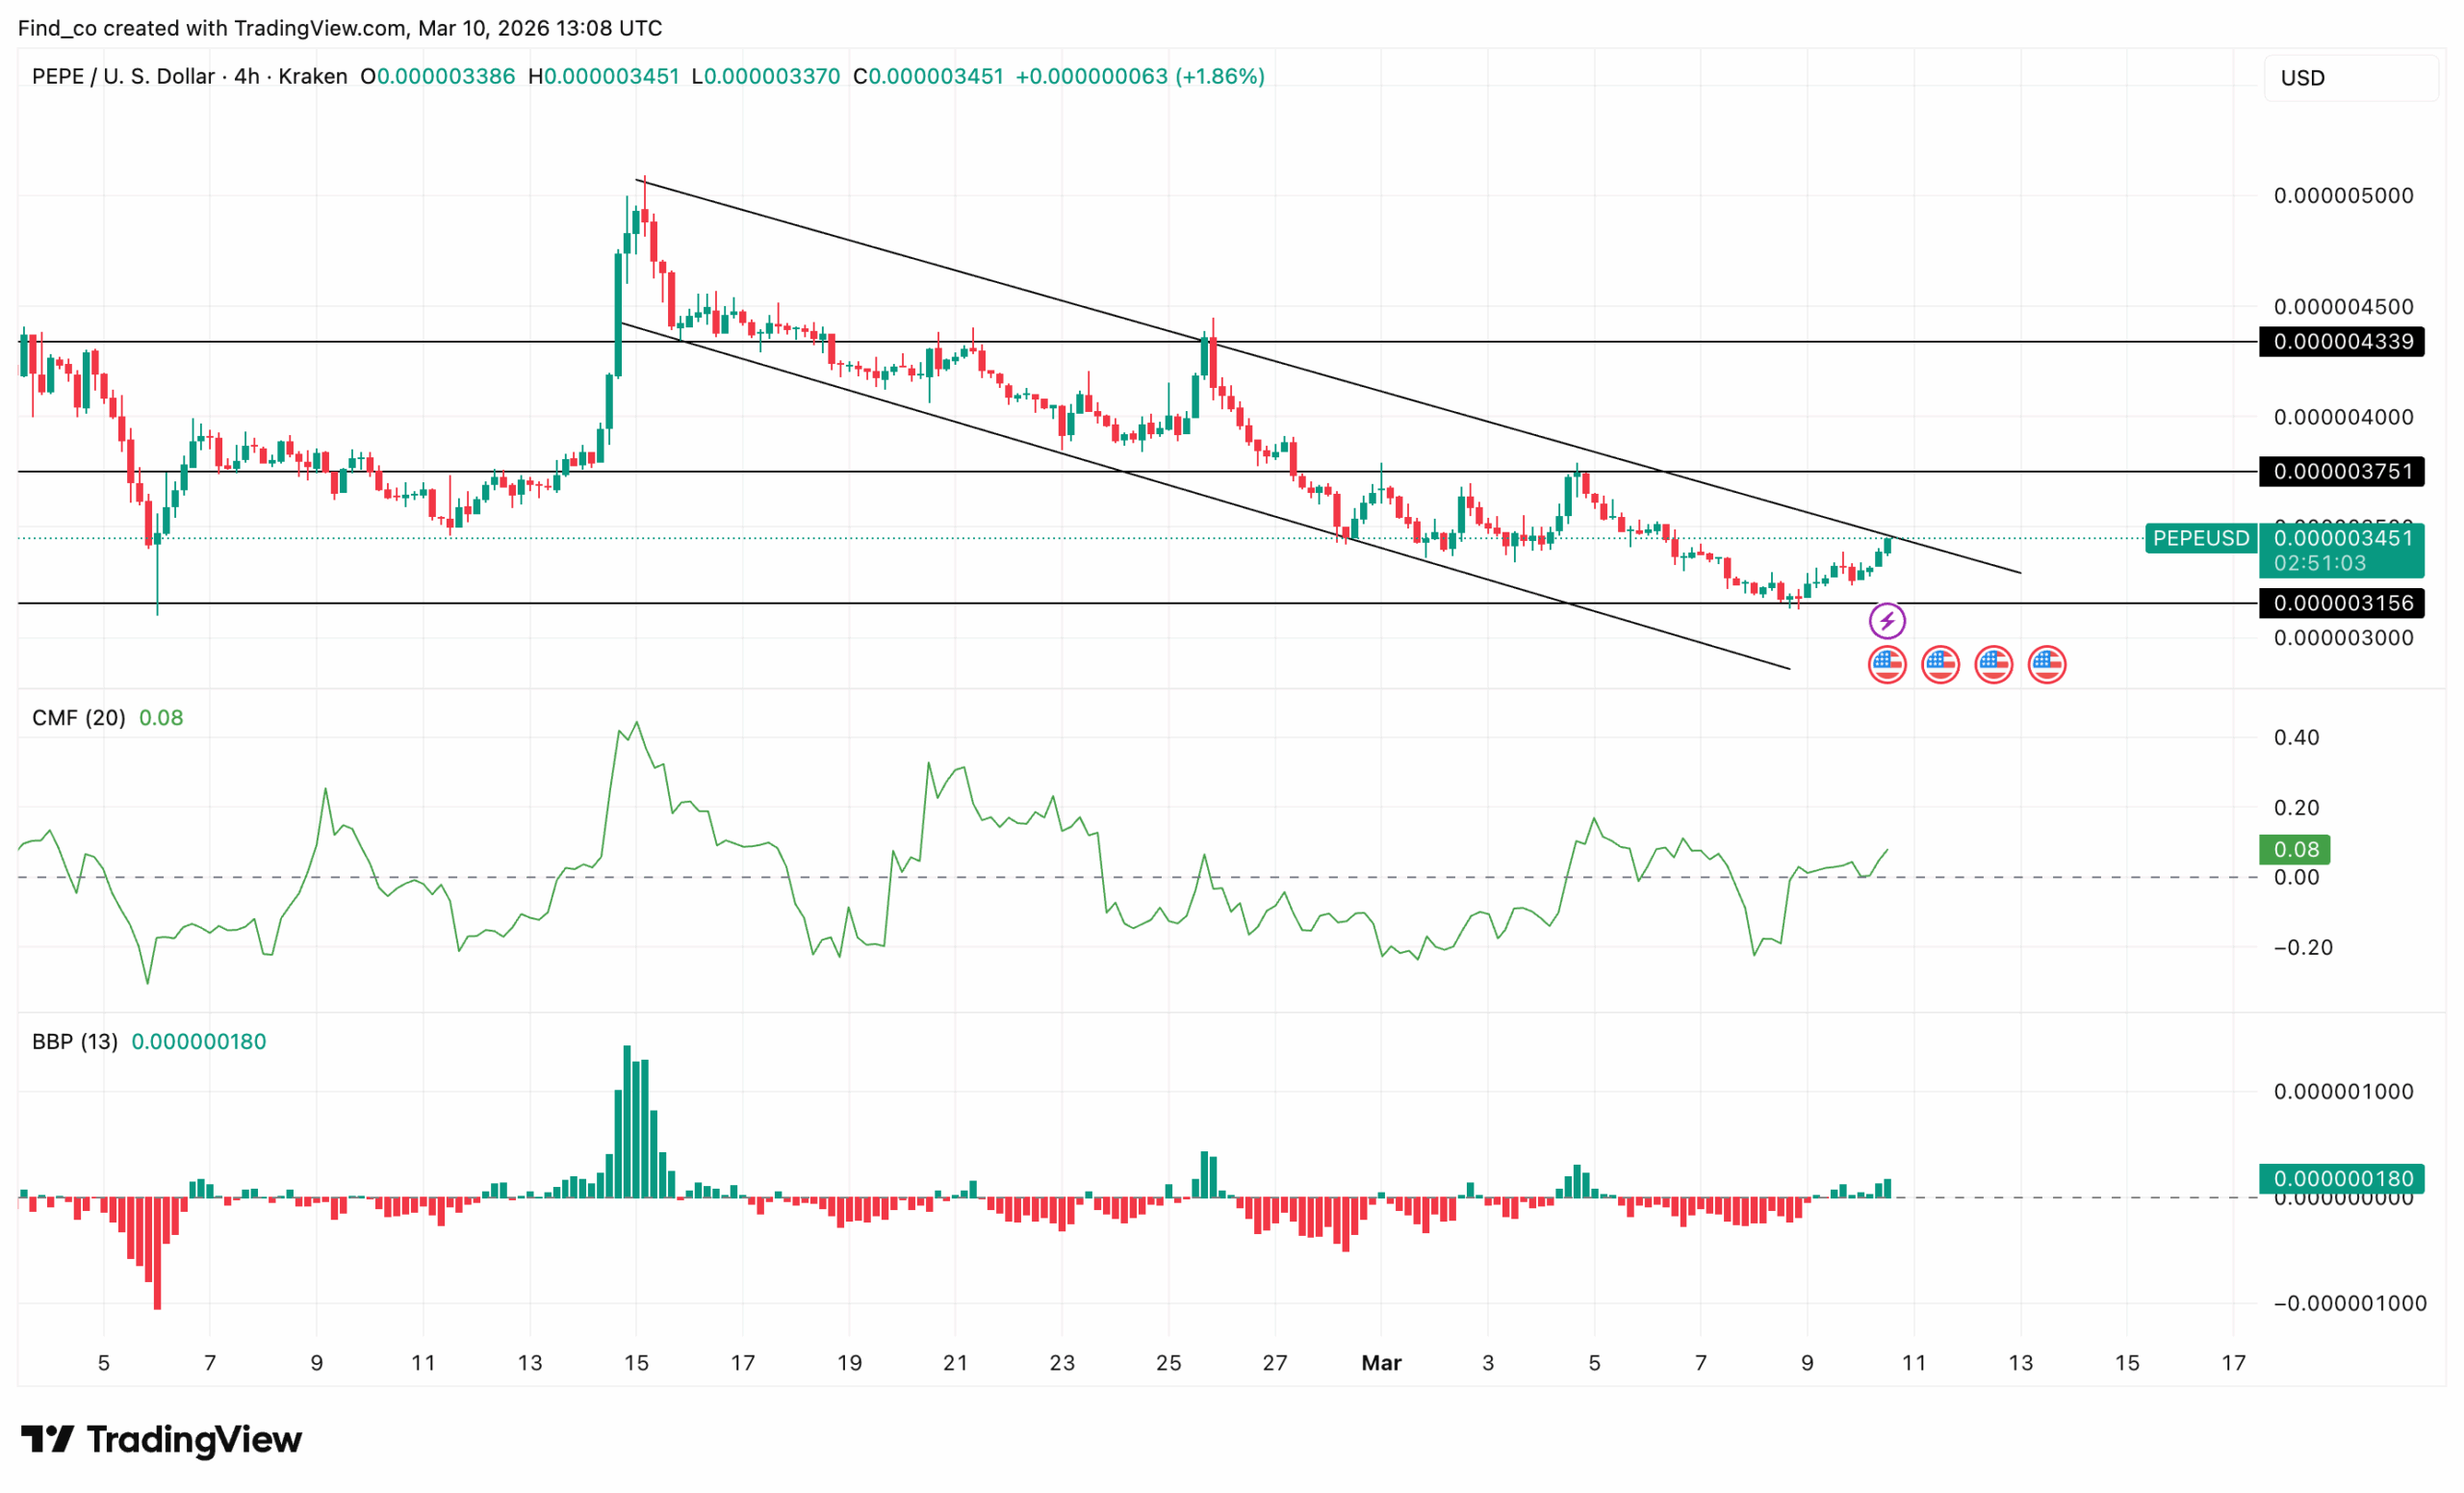
At the moment, PEPE is trading between key support near $0.0000031 and resistance around $0.0000038. This range has defined price action for several sessions.
The market structure now reflects sideways consolidation following a bearish trend.
On the 4-hour chart, the Chaikin Money Flow (CMF) has climbed back above the zero line, currently hovering around 0.03.
Get These Top Crypto Casino Offers Now!
Sponsored
Disclosure
We sometimes use affiliate links in our content, when clicking on those we might receive a commission at no extra cost to you. By using this website you agree to our terms and conditions and privacy policy.
Even so, buyers still face a major challenge. The $0.0000038 zone remains the most significant overhead resistance. Previous rallies at this level have consistently triggered rejection.
Unless bulls reclaim the $0.0000038 mark, the broader structure will likely remain range-bound rather than bullish.
PEPE Price Prediction: Downside Risk
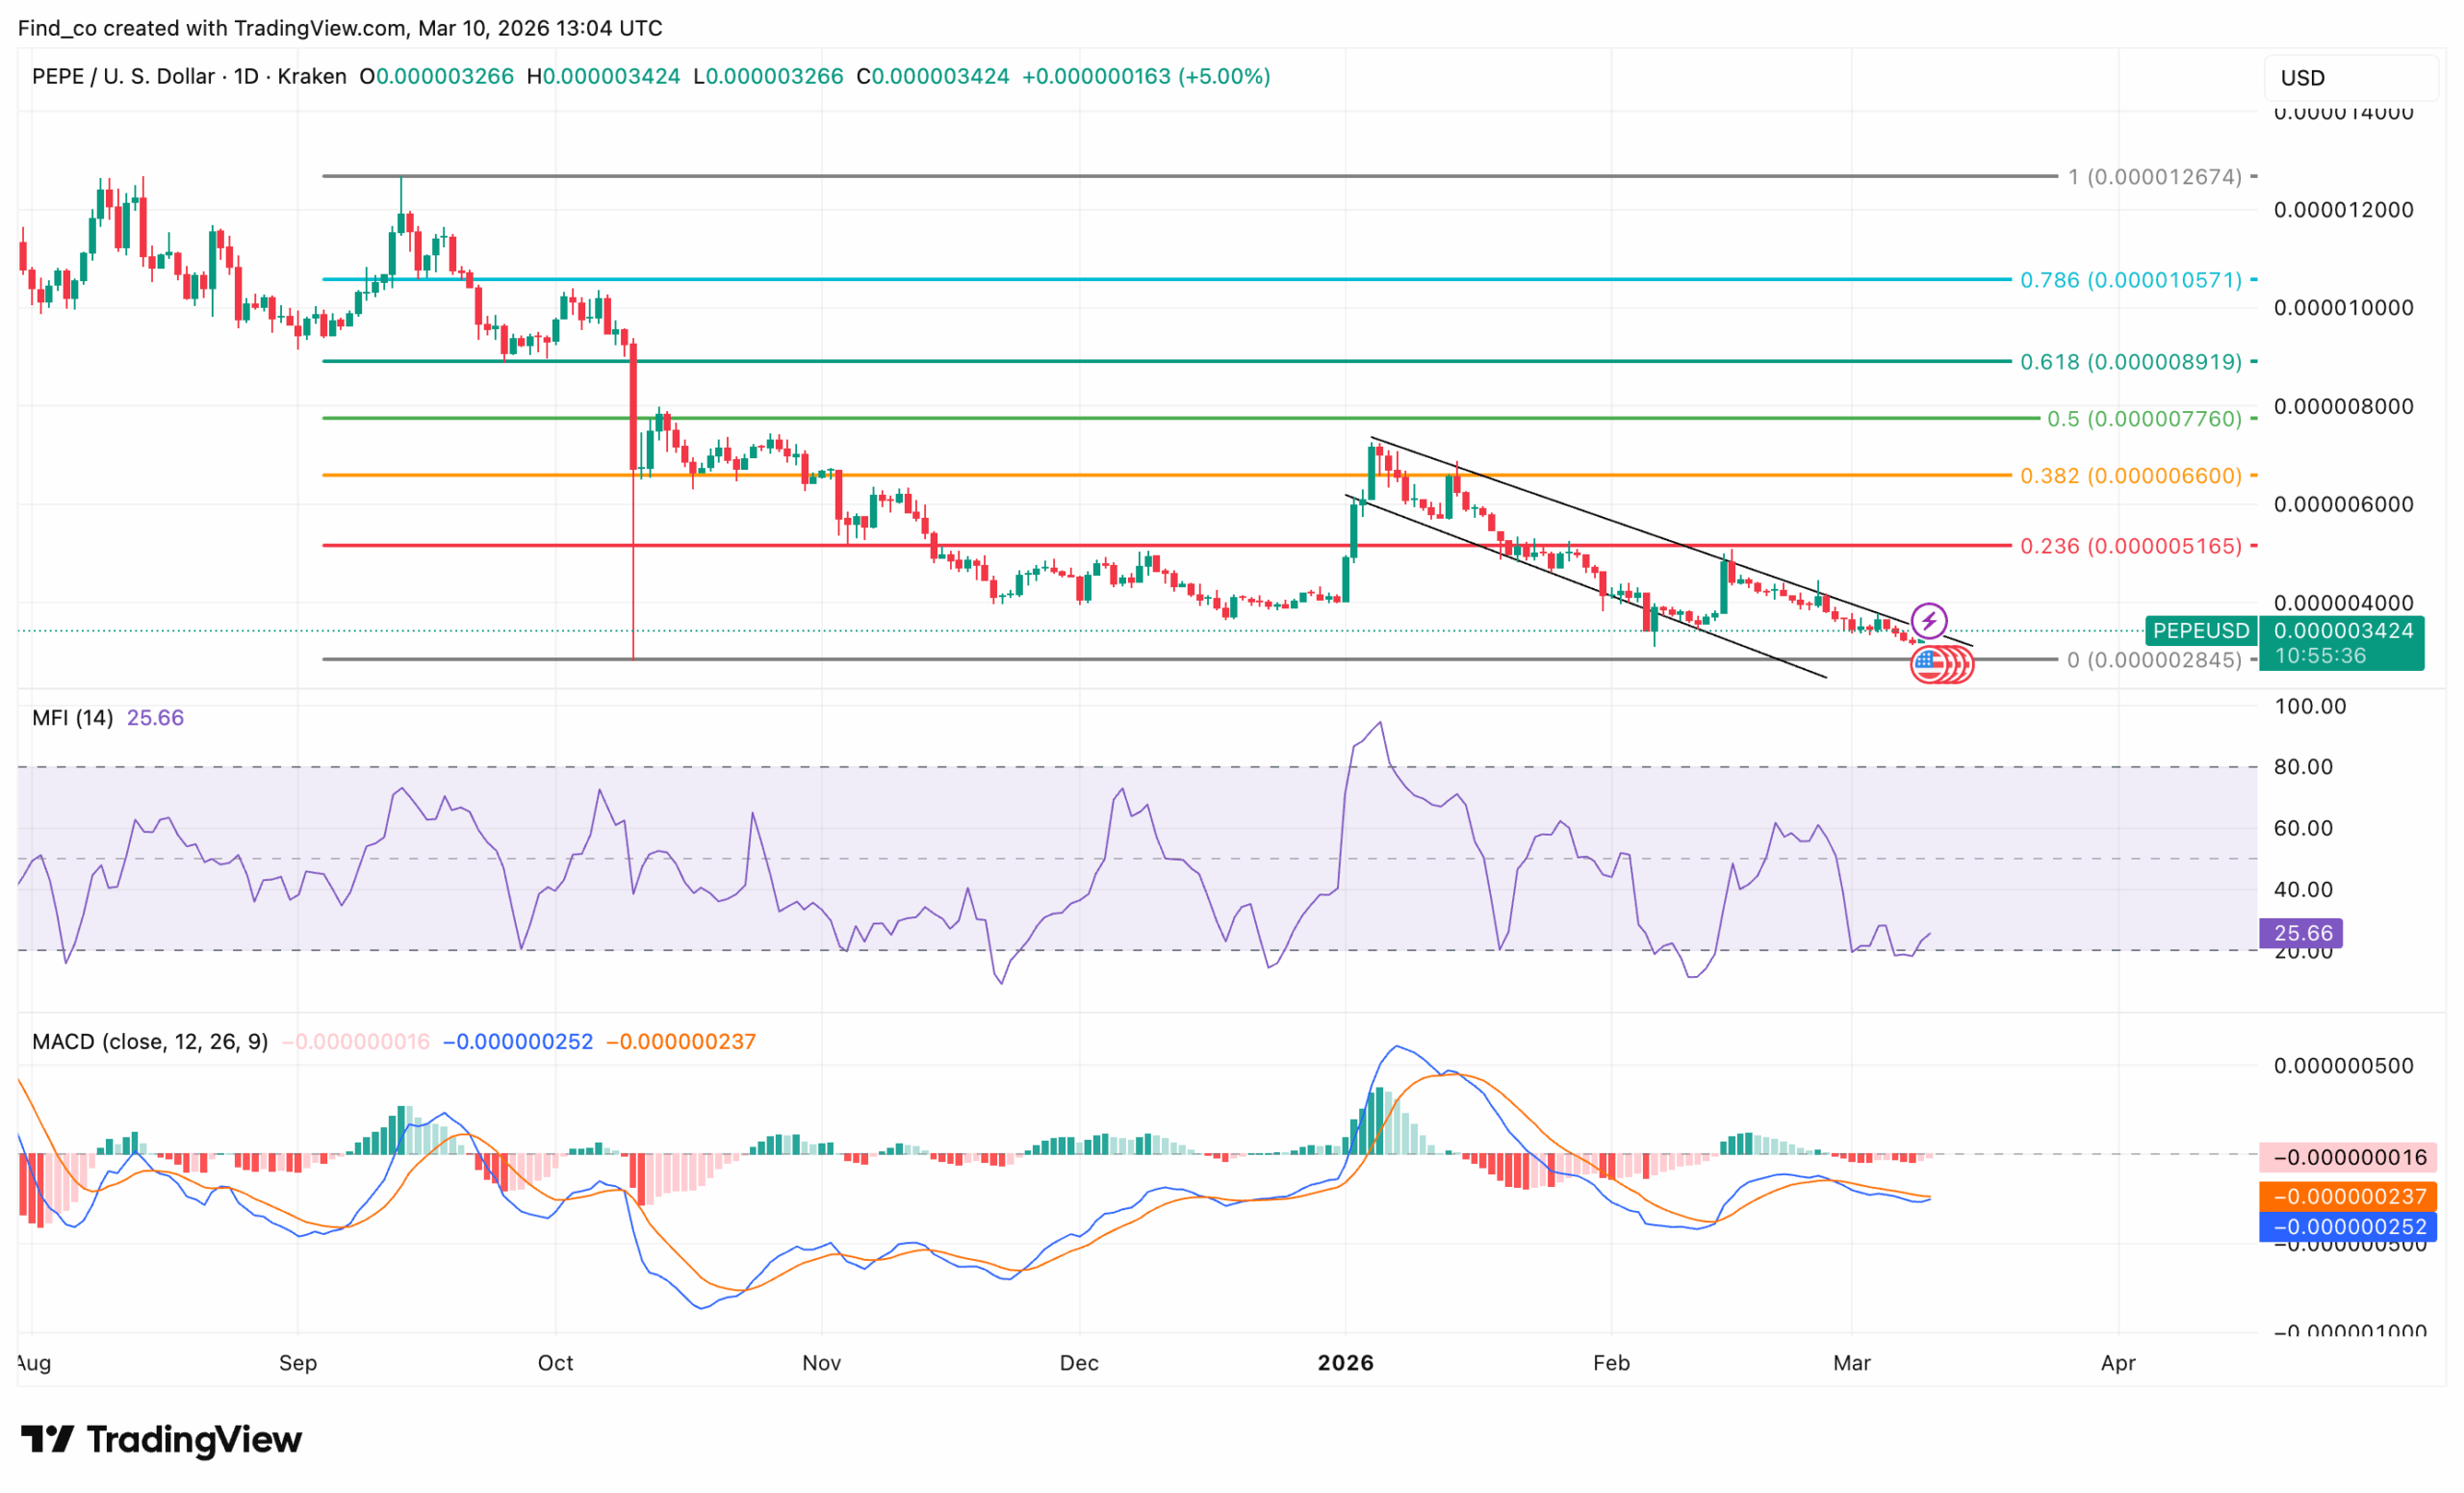
On the daily chart, Pepe’s price continues to trade under sustained bearish pressure, moving within a descending structure that has guided the trend lower for several months.
The asset recently slipped toward the $0.00000280 support zone, a level that now acts as a critical floor for the current market structure.
The 0.236 retracement around $0.00000512 has remained a firm barrier, preventing buyers from establishing a stronger recovery. As a result, the broader pattern still reflects a series of lower highs and lower lows.
Momentum indicators reinforce this cautious outlook. The Money Flow Index (MFI) currently sits near 25, approaching oversold territory.
This reading suggests that selling pressure has intensified, although oversold conditions can sometimes precede short-term relief bounces.
Meanwhile, the Moving Average Convergence Divergence (MACD) remains below the zero line, with both signal lines trending downward, confirming that bearish momentum still dominates.
If the $0.0000028 support fails to hold, PEPE’s price could face another wave of downside pressure.
However, if buyers can defend this level and reclaim the descending trendline, the memecoin may attempt a recovery toward the $0.0000051 resistance zone in the weeks ahead.
Last Flush Expected?
In the meantime, analyst Davie Satoshi confirms that PEPE’s price has been trapped in a bearish descending channel since April 2025, with the market now approaching the final stretch of that structure.
While Wave C is largely complete, there may still be one last flush lower.
“The bearish count argues for a bit more patience, but if you’re long-term bullish, any weakness in this area is still discounted inventory,” adding that reclaiming the upper resistance lines and holding them would signal that momentum is returning and a durable bottom may finally be in place.
Disclaimer:
The information provided in this article is for informational purposes only. It is not intended to be, nor should it be construed as, financial advice. We do not make any warranties regarding the completeness, reliability, or accuracy of this information. All investments involve risk, and past performance does not guarantee future results. We recommend consulting a financial advisor before making any investment decisions.
Victor Olanrewaju is a crypto analyst and reporter at CCN with deep roots in on-chain research and technical analysis. His crypto journey began in 2017, but it was the 2020 Uniswap airdrop that sparked a full-time pivot into the space.
With a foundation in copywriting, Victor honed his craft creating high-converting content for leading crypto brokers — most notably an XRP price prediction that ranked #1 on Google during the 2021 bull run.
He later joined AMBCrypto in 2022, where he combined storytelling with technical and on-chain analysis to cover key market narratives.
In 2024, he expanded his expertise at BeInCrypto, collaborating with analysts and using tools like Glassnode, Santiment, and IntoTheBlock to break down Bitcoin and altcoin trends.
At CCN, Victor covers the top cryptocurrencies, memecoins, macro shifts, blending real-time insights with deep-dive metrics.
He holds a Bachelor’s degree in Physics from the University of Ibadan, equipping him to simplify complex data for a wide audience. Follow his work or connect on LinkedIn or X.