Money is flowing back into PEPE | Credit: Hameem Sarwar
Share
Key Takeaways
PEPE’s price rebounded over 12% as buyers reclaimed short-term control.
Bullish momentum is building as price challenges resistance near $0.0000073.
If demand holds, a breakout could push PEPE toward new 2026 highs.
PEPE has rebounded more than 12%, reclaiming short-term support and moving back toward prior range highs.
This bounce follows days of consolidation and signals fresh speculative interest as buyers step back in ahead of a possible continuation move.
Now, PEPE’s price sits at a crucial point, where the next breakout attempt could define its broader performance in 2026.
PEPE Buyers Regain Short-Term Control
On the 4-hour chart, Bull Bear Power (BBP) has flipped positive and is printing expanding green bars. This happened as the frog-themed memecoin broke out of the upper trendline of a bullish pennant.
That shift shows rising upside pressure and confirms that bulls have regained control after the pullback.
RSI supports the same view. It has climbed to 62.85 and is pushing toward overbought territory, reflecting aggressive dip-buying and rapidly building momentum.
The steep slope matters here because it suggests buyers are not hesitating as PEPE presses into overhead supply.
Structurally, PEPE’s price has reclaimed the mid-range zone and is now challenging the $0.0000073 resistance band.
This level capped the last rally, so it remains the key barrier before a full range breakout.
If PEPE breaks and closes above it, the move would confirm continuation and open the path toward the $0.0000085 supply zone.
Dormant Tokens Re-enter the Market
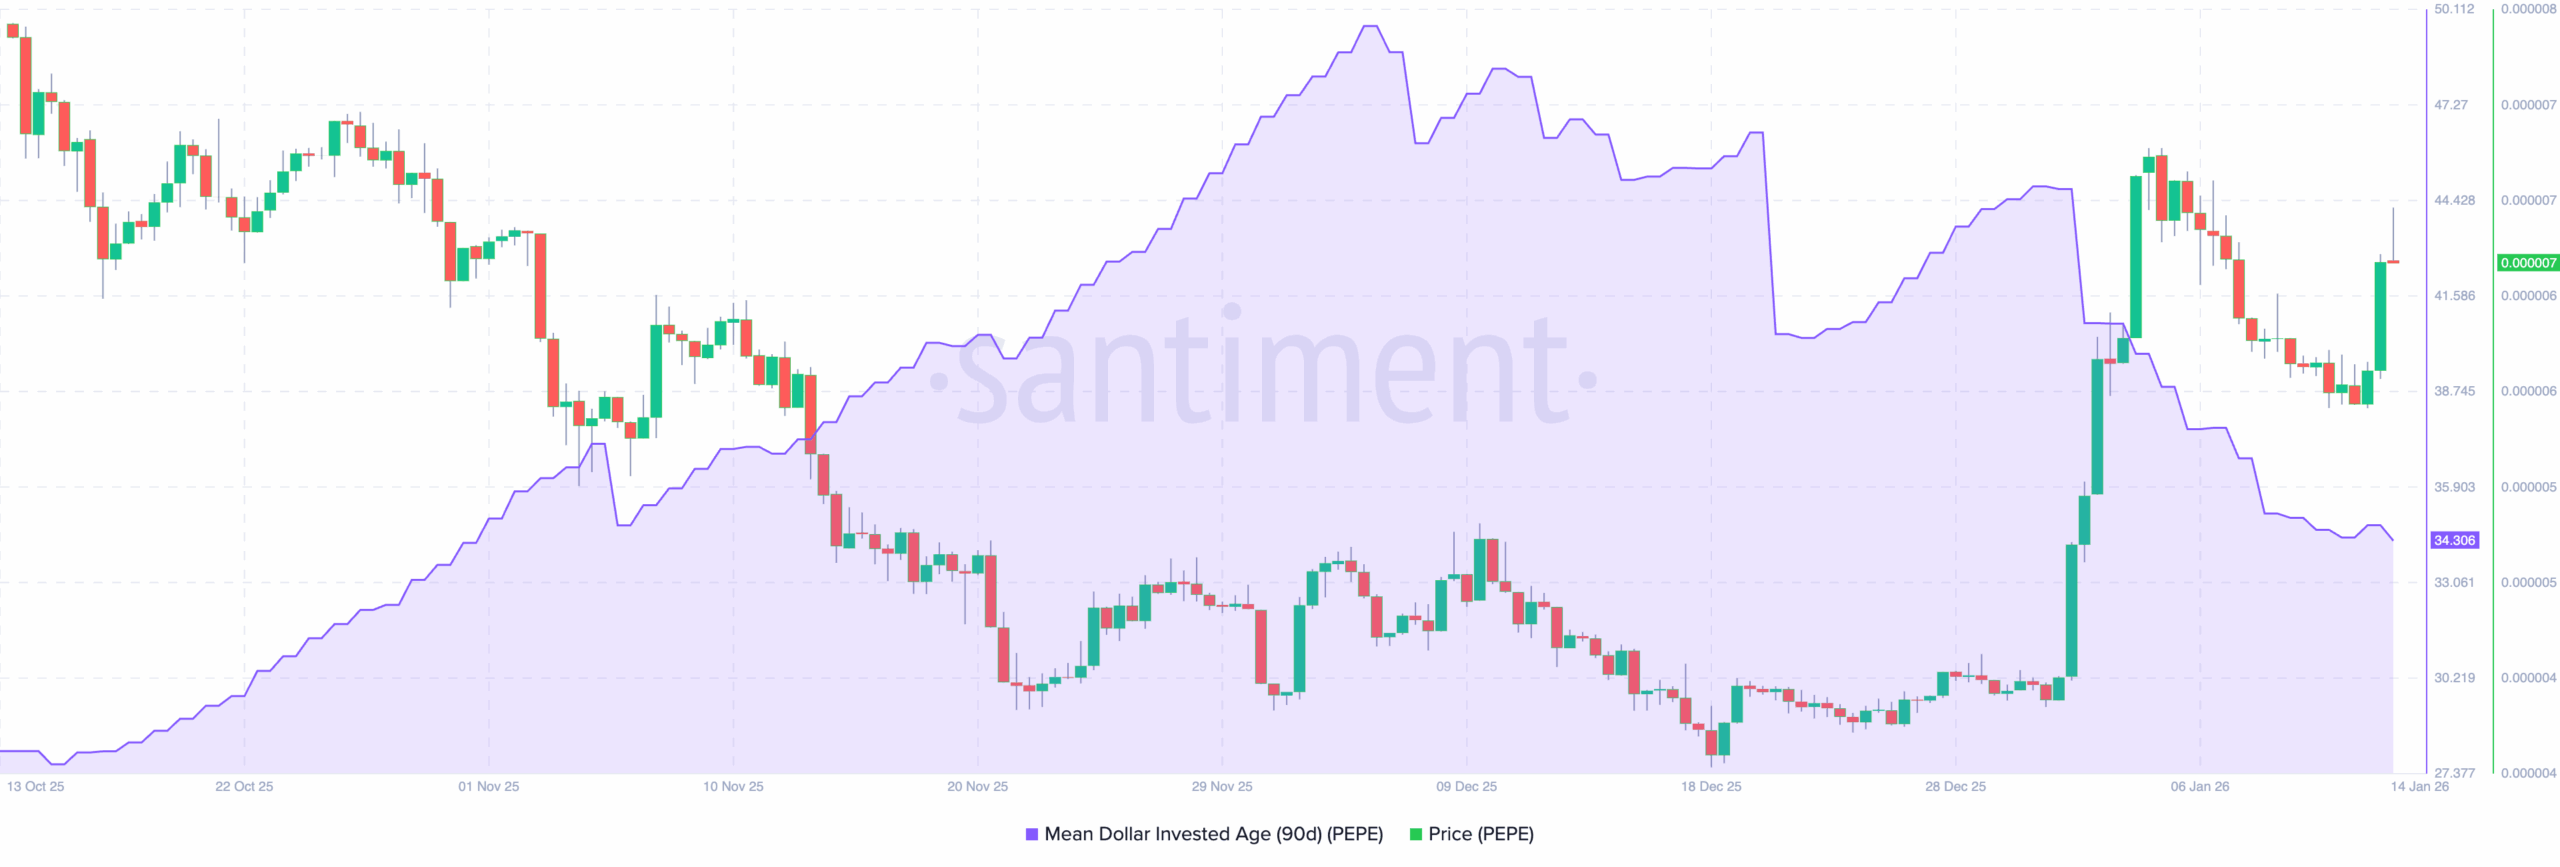
Meanwhile, on-chain data from Santiment shows the Mean Dollar Invested Age (MDIA) has fallen to its lowest level since October 2025.
That drop matters because MDIA measures the duration of coins that have remained dormant. When it declines, it typically means that older tokens are being traded again.
In practice, this indicates an increase in network activity. Long-held PEPE is re-entering circulation, either through transfers, trading, or repositioning.
When this happens during a price rebound, it often supports continuation. Therefore, if this trend continues, PEPE’s price may maintain its bullish trend from 2026.
Still, the signal cuts both ways. Increased movement can reflect accumulation and rotation, but it can also precede distribution if holders start taking profits.
For now, paired with PEPE’s rebound and bullish structure, the falling MDIA leans constructive and supports the case for further upswing, as long as buying demand absorbs the renewed supply.
That breakout maintains the uptrend thesis as the price climbs back toward the resistance level.
Momentum indicators also lean constructive. The Money Flow Index (MFI) continues to rise toward the overbought zone, signaling growing buying pressure.
Meanwhile, the Awesome Oscillator (AO) has turned green again after earlier red bars, indicating renewed bullish momentum and improving trend strength.
A closer examination of the Fibonacci levels provides a clearer view of this setup.
After a brief pullback from $0.0000073, PEPE’s price has regained traction and is now aiming for a break above that ceiling as it approaches the 0.382 Fib level near $0.0000082.
Disclaimer:
The information provided in this article is for informational purposes only. It is not intended to be, nor should it be construed as, financial advice. We do not make any warranties regarding the completeness, reliability, or accuracy of this information. All investments involve risk, and past performance does not guarantee future results. We recommend consulting a financial advisor before making any investment decisions.
Victor Olanrewaju is a crypto analyst and reporter at CCN with deep roots in on-chain research and technical analysis. His crypto journey began in 2017, but it was the 2020 Uniswap airdrop that sparked a full-time pivot into the space.
With a foundation in copywriting, Victor honed his craft creating high-converting content for leading crypto brokers — most notably an XRP price prediction that ranked #1 on Google during the 2021 bull run.
He later joined AMBCrypto in 2022, where he combined storytelling with technical and on-chain analysis to cover key market narratives.
In 2024, he expanded his expertise at BeInCrypto, collaborating with analysts and using tools like Glassnode, Santiment, and IntoTheBlock to break down Bitcoin and altcoin trends.
At CCN, Victor covers the top cryptocurrencies, memecoins, macro shifts, blending real-time insights with deep-dive metrics.
He holds a Bachelor’s degree in Physics from the University of Ibadan, equipping him to simplify complex data for a wide audience. Follow his work or connect on LinkedIn or X.