PEPE surges 65% in early 2026! Can the rally reach $0.000018 this year? | Credit: Hameem Sarwar
Share
Key Takeaways
CCN predicts that PEPE’s price could average about $0.000013 in 2026.
PEPE’s weekly breakout and bullish crossover suggest the trend is improving.
Support near $0.0000061 is critical, and losing it could trigger a deeper drop.
PEPE had a brutal 2025, tumbling roughly 70% and shaking out even long-term holders.
However, that sell-off also reset expectations and compressed valuations. Now, in 2026, it appears that market sentiment may be shifting back towards high-risk memecoins like PEPE.
As such, the token is starting to look less like a laggard and more like a comeback candidate.
More importantly, if momentum and volume continue to build, the token could erase a meaningful portion of last year’s losses in 2026.
So, the key question is: What could be PEPE’s price prediction for 2026 to 2030? Let’s find out.
Pepe Price Prediction
Let’s analyze some of PEPE’s price predictions CCN made on Jan. 7, 2026. It is crucial to remember that price forecasts, particularly for a potentially volatile asset like cryptocurrency, often turn out to be inaccurate.
The predictions will be made using the wave count method, with adjustments of 20% added and removed to create the minimum and maximum targets.
Minimum PEPE Price Prediction
Average PEPE Price Prediction
Maximum PEPE Price Prediction
2026
$0.0000047
$0.000013
$0.000018
2027
$0.0000026
$0.0000056
$0.0000089
2030
$0.000023
$0.000044
$0.00010
PEPE Price Prediction 2026
Unlike 2025, which was a challenging year for the memecoin, 2026 might prove to be a good one for the PEPE.
Interestingly, the token also jumped by approximately 65% within the first few days. From the looks of things, it appears to be ready to maintain this momentum for the next few months.
Should that be the case, the PEPE price prediction for 2026 could see it hit a maximum value of $0.000018. On average, it could trade around $0.000013 while the minimum forecast could be $0.0000047.
PEPE Price Prediction 2027
In 2027, PEPE might struggle. This is because the broader cryptocurrency market may enter a bear phase.
Therefore, the price could trade between $0.0000026 and a maximum of $0.0000089.
Get These Top Crypto Casino Offers Now!
Sponsored
Disclosure
We sometimes use affiliate links in our content, when clicking on those we might receive a commission at no extra cost to you. By using this website you agree to our terms and conditions and privacy policy.
However, on the other hand, if demand for memecoins declines, this prediction may not materialize. In such a scenario, PEPE might slide to $0.000041.
Short-Term PEPE Price Prediction
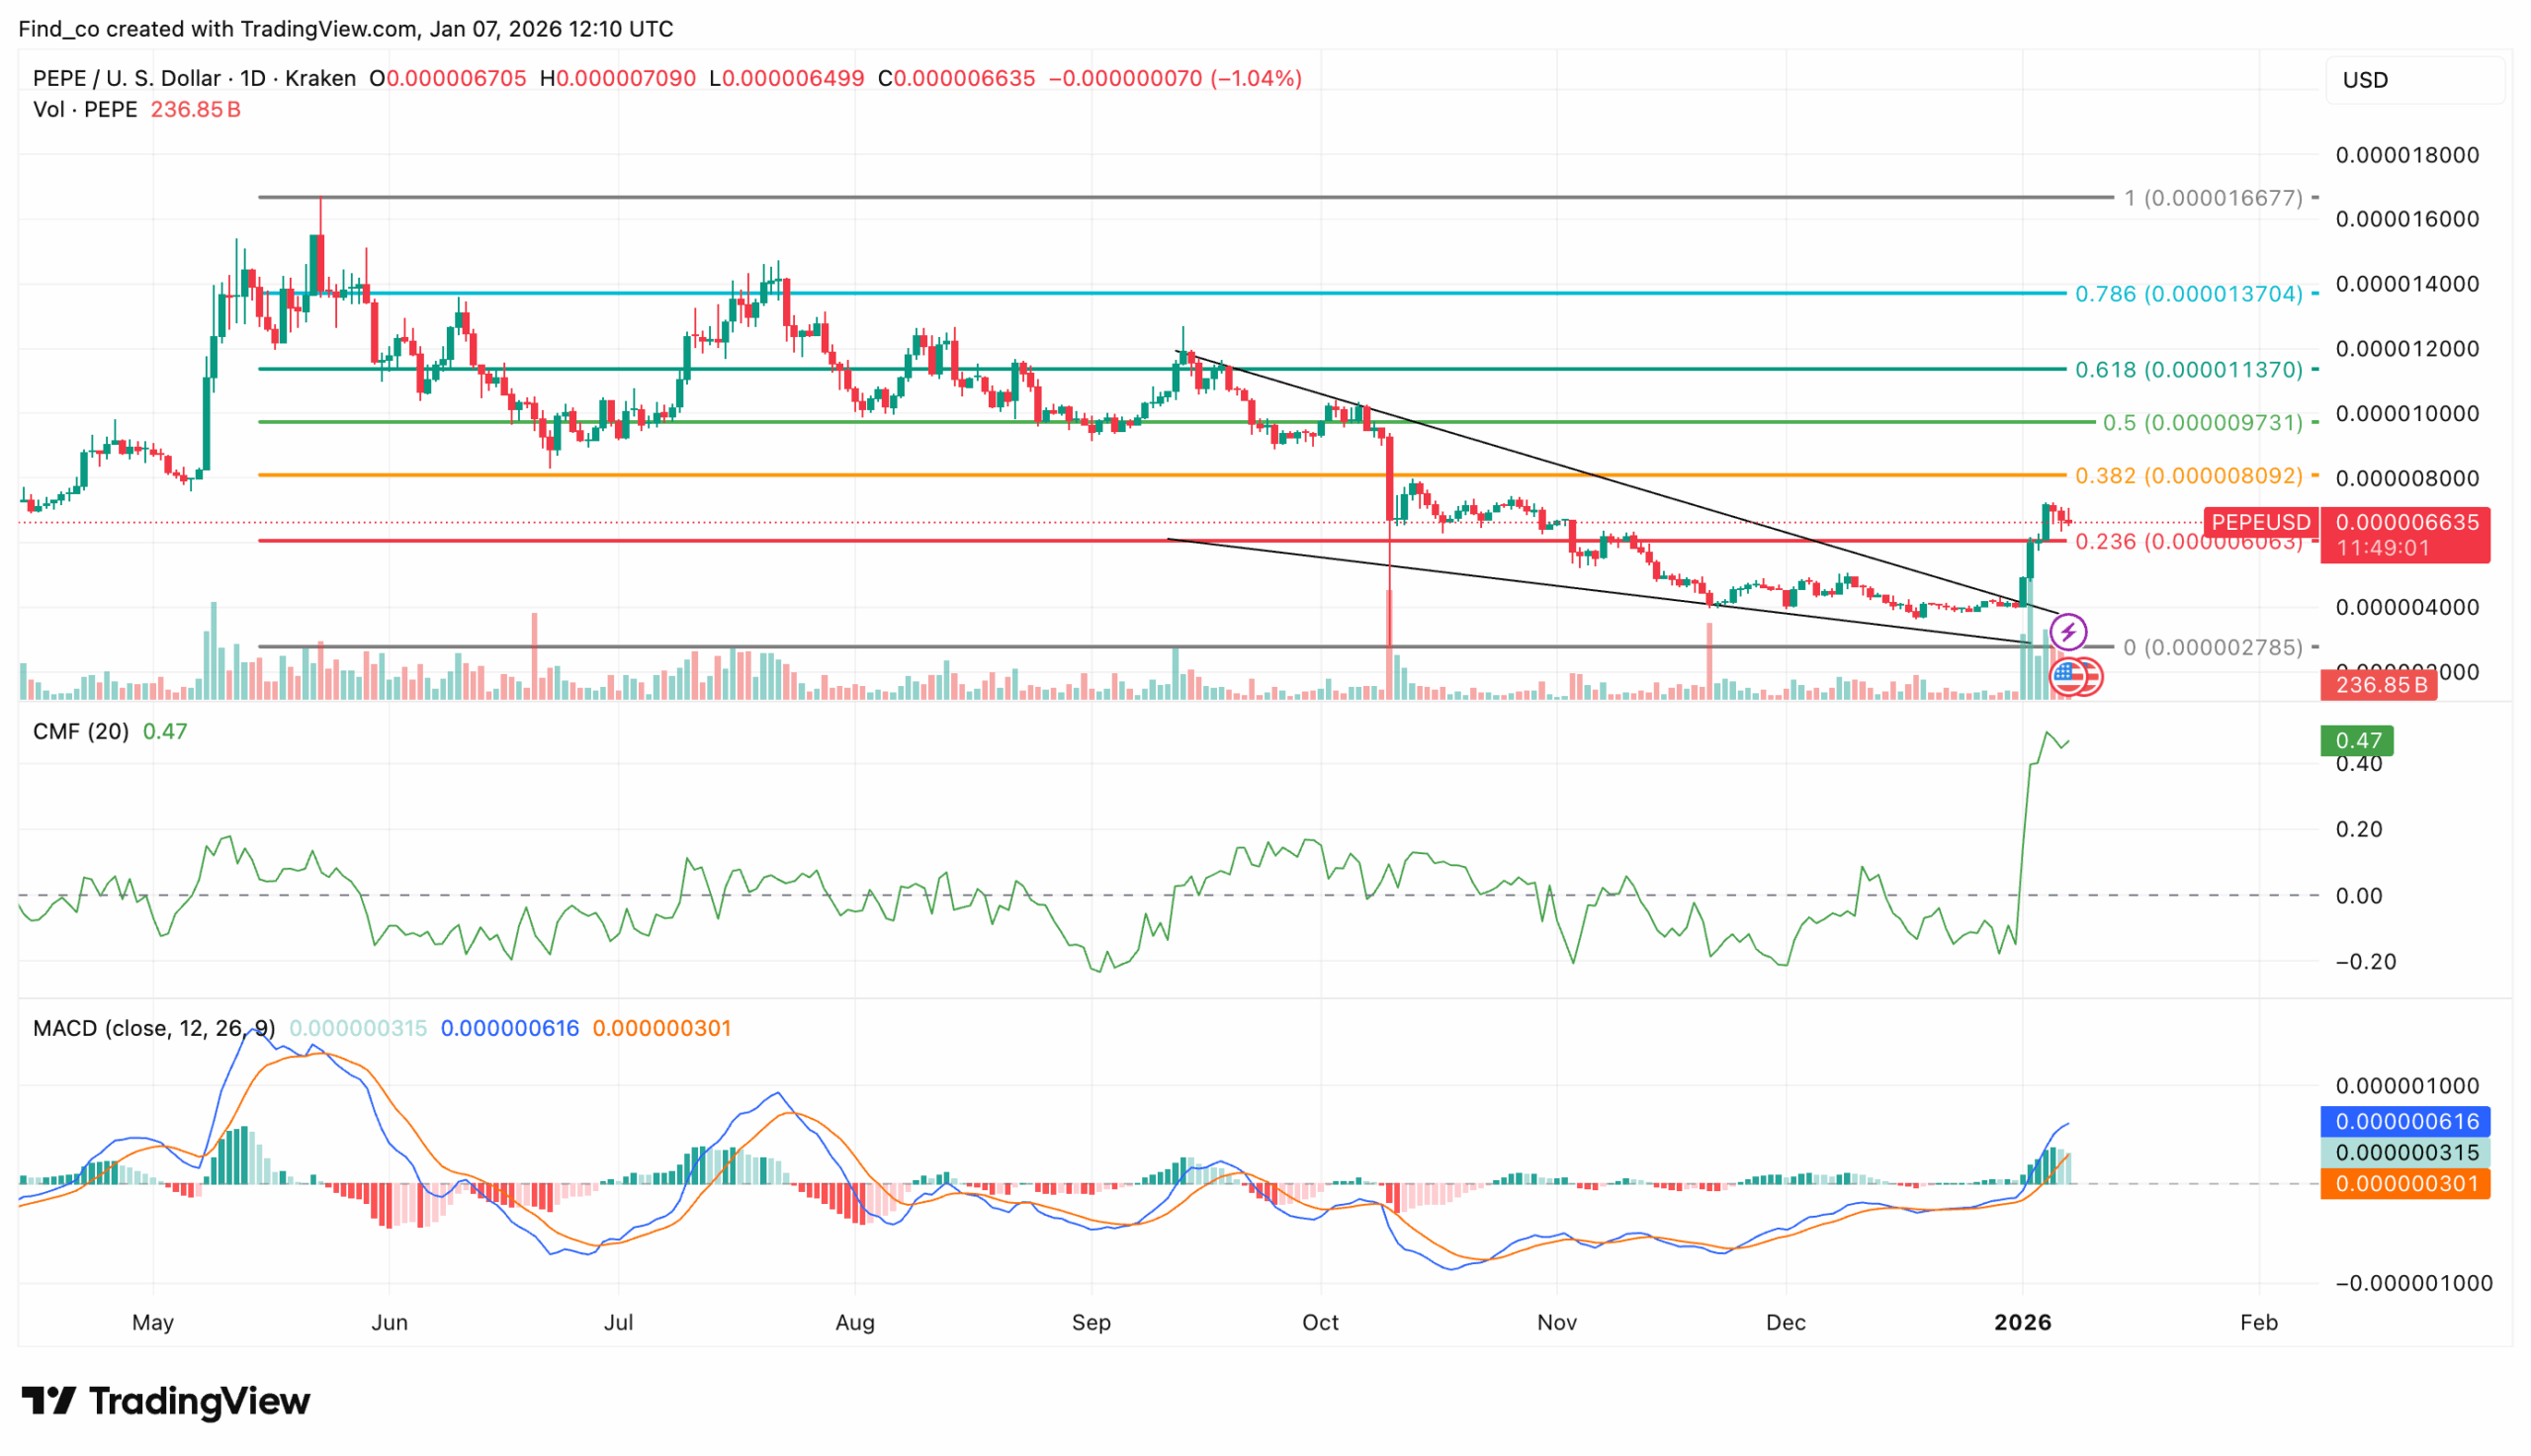
As the weekly chart displayed, the short-term outlook for PEPE is also bullish.
After PEPE’s price broke out of a bearish wedge on the daily chart, the Chaikin Money Flow (CMF) flipped into positive territory. That shift matters because it signals capital is flowing back into the asset.
At the same time, PEPE is now testing its immediate resistance zone, and buyers are starting to show more control.
The MACD backs that up. The 12-day EMA has crossed above the 26-day EMA, which reinforces the bullish bias.
Although the histogram bars are shrinking and momentum is cooling slightly, the broader trend remains upward.
If PEPE can sustain pressure above the current resistance, the next move could target the prior swing highs. M
eanwhile, the wedge breakout and moving averages continue to act as support, which can help cushion any pullback.
For now, the price has pulled back from a key resistance area, but it still holds within the range between the 0.236 and 0.382 Fibonacci levels.
That positioning suggests short-term profit-taking is happening, yet the wider bullish structure remains intact.
A break above $0.0000082 could signal continuation toward higher Fibonacci targets. On the downside, support near $0.0000061 remains the key target.
If buyers defend that level, PEPE can stabilize and reset before another push higher. However, if PEPE’s price falls below $0.0000061, the market could shift into a deeper retracement and drag the price toward the next significant support level near $0.0000037.
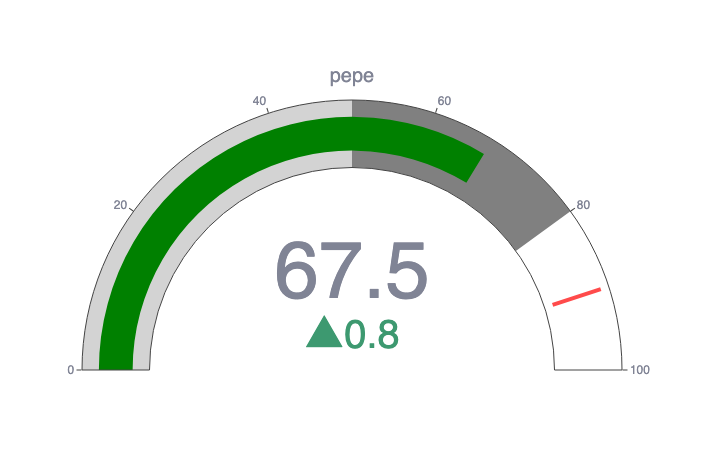
CCN Strength Index
The CCN Strength Index combines a range of advanced market signals to measure the strength of individual cryptocurrencies over the past 30 days.
Every day, it assigns a strength score, ranging from 0 to 100, to the top 500 assets by market capitalization on CoinMarketCap, focusing on both trend direction and the intensity of price movements.
0 to 24: Assets exhibit significant weakness, showing signs of sustained downtrend behavior.
25 to 35: The price tends to move within stable bounds with minimal volatility.
36 to 49: Assets begin a stable uptrend but without strong surges.
50 to 59: Consistent growth with moderate price advances, building momentum.
60+: Sharp price movements and high demand indicate stronger volatility and trend shifts.
The index dynamically adapts to rapid changes. For example, an asset experiencing a 100% increase within a short timeframe would see a sharp jump in its score to reflect the intensity of the rise.
However, should that asset stabilize at this new price level, the score will gradually taper down and align with the dampened momentum as the movement normalizes.
The same principle applies to rapid declines: a sudden drop will spike the score downward, but the score will slowly adjust back up as volatility decreases.
We examined the Pepe price history and identified the lowest prices on specific days, months, quarters, and even weeks of the year, indicating the optimal times to purchase PEPE.
Day of the Week
Friday
Week
9
Month
February
Quarter
First
Pepe Price History
Time period
Pepe price
Last week (Dec. 31, 2025)
$0.0000040
Previous month (Dec. 7, 2025)
$0.0000047
Three months ago (Oct. 7, 2025)
$0.000010
One year ago (Jan. 7, 2024)
$0.000021
Launch price (April 17, 2023)
$0.00000002764
All-time high (Dec. 9, 2024)
$0.00002825
All-time low (April 18, 2023)
$0.00000002764
Who Owns the Most Pepe (PEPE) Tokens?
As of this writing, a wallet held nearly 15% of the PEPE supply.
0xf977814e90da44bfa03b6295a0616a897441acec. This wallet, listed as Binance, held 57,828,090,983,163 PEPE or 13.75% of the supply.
0x5a52e96bacdabb82fd05763e25335261b270efcb. This wallet, also listed as Binance, held 17,199,771,513,124 PEPE or 4.09% of the supply.
0x6cc5f688a315f3dc28a7781717a9a798a59fda7b. This wallet, listed as OKX, held 15,728,288,831,157 PEPE or 3.74% of the supply.
0x88a1493366d48225fc3cefbdae9ebb23e323ade3. This wallet held 14,800,000,000,050 PEPE or 3.52% of the supply.
0x73af3bcf944a6559933396c1577b257e2054d935. This wallet held 13,596,577,689,458 PEPE or 3.23% of the supply.
Pepe Supply and Distribution
Supply and distribution
Figures
Maximum Supply
420,690,000,000,000
Circulating (as of Jan. 7, 2026)
420,690,000,000,000(100% of maximum supply)
Holder distribution
The top 10 holders owned 39.39% of the supply at the time of writing
From the Pepe Whitepaper
In its technical documentation, or whitepaper, Pepe says that the team behind Pepe is focused on building various utilities on the Solana network, such as Pepescan, Solana Token-2022 Standard decentralized exchange (DEX), as well as games like “Flip a Pepe”. The native token of the project is called PEPE, a Solana SPL token that serves as the base currency.
How Pepe Works
Pepe is a memecoin, so it does not have any real-world utility. However, it can be used to purchase goods and services on several online marketplaces.
Is Pepe a Good Investment?
It is hard to say. PEPE, along with much of the memecoin sector, has been impacted by a recent market downturn, and the forecasts regarding its value are relatively bearish. That said, it hasn’t been too long since PEPE reached an all-time high, and it could well be that there could be another surge at some point.
As always with crypto, you should do your own research before deciding whether or not to invest in PEPE.
Will Pepe go up or down?
No one can tell for certain right now. While the Pepe crypto price predictions are largely positive, price predictions have a well-earned reputation for being wrong. Keep in mind that prices can and do go down and up.
Should I invest in Pepe?
Before deciding whether to invest in Pepe, you will need to conduct thorough research, not only on PEPE but also on other coins and tokens, such as Shiba Inu (SHIB) or Dogecoin (DOGE). Either way, you must also ensure you never invest more money than you can afford to lose.
As of Jan. 7, 2026, 420.69 trillion PEPE were in circulation, representing the total supply.
Will Pepe reach $0.01?
It looks highly unlikely to happen at any time soon not least because if PEPE was worth one cent, its market cap would be larger than the GDP of all but five countries worldwide.
What is Pepe?
PEPE is a memecoin and carries no intrinsic value or expectation of financial return. It can be bought, sold, and traded on exchanges.
Disclaimer
Please note that the contents of this article are not financial or investing advice. The information provided in this article is the author’s opinion only and should not be considered as offering trading or investing recommendations. We do not make any warranties about the completeness, reliability, and accuracy of this information. The cryptocurrency market suffers from high volatility and occasional arbitrary movements. Any investor, trader, or regular crypto user should research multiple viewpoints and be familiar with all local regulations before committing to an investment.
Victor Olanrewaju is a crypto analyst and reporter at CCN with deep roots in on-chain research and technical analysis. His crypto journey began in 2017, but it was the 2020 Uniswap airdrop that sparked a full-time pivot into the space.
With a foundation in copywriting, Victor honed his craft creating high-converting content for leading crypto brokers — most notably an XRP price prediction that ranked #1 on Google during the 2021 bull run.
He later joined AMBCrypto in 2022, where he combined storytelling with technical and on-chain analysis to cover key market narratives.
In 2024, he expanded his expertise at BeInCrypto, collaborating with analysts and using tools like Glassnode, Santiment, and IntoTheBlock to break down Bitcoin and altcoin trends.
At CCN, Victor covers the top cryptocurrencies, memecoins, macro shifts, blending real-time insights with deep-dive metrics.
He holds a Bachelor’s degree in Physics from the University of Ibadan, equipping him to simplify complex data for a wide audience. Follow his work or connect on LinkedIn or X.