Will MATIC's Support or Resistance Prevail? | Credit: Getty Images
Share
Key Takeaways
The MATIC’s price correction led to a yearly low of $0.58 on April 13.
MATIC has performed poorly in 2024, falling by 27%.
Will MATIC fall below support, or will it reclaim resistance instead?
MATIC is an Ethereum Layer 2 scaling solution, a category benefitting immensely from the Dencun upgrade in the form of reduced transaction fees. Despite this improvement, its price has been sluggish for most of 2024.
The ongoing crypto market correction hit the MATIC price hard, leading to a new yearly low on April 13. Polygon now trades between two critical levels, and the direction it takes from here can determine if the long-term trend is bullish or bearish.
Why Did MATIC Fall to New Yearly Low?
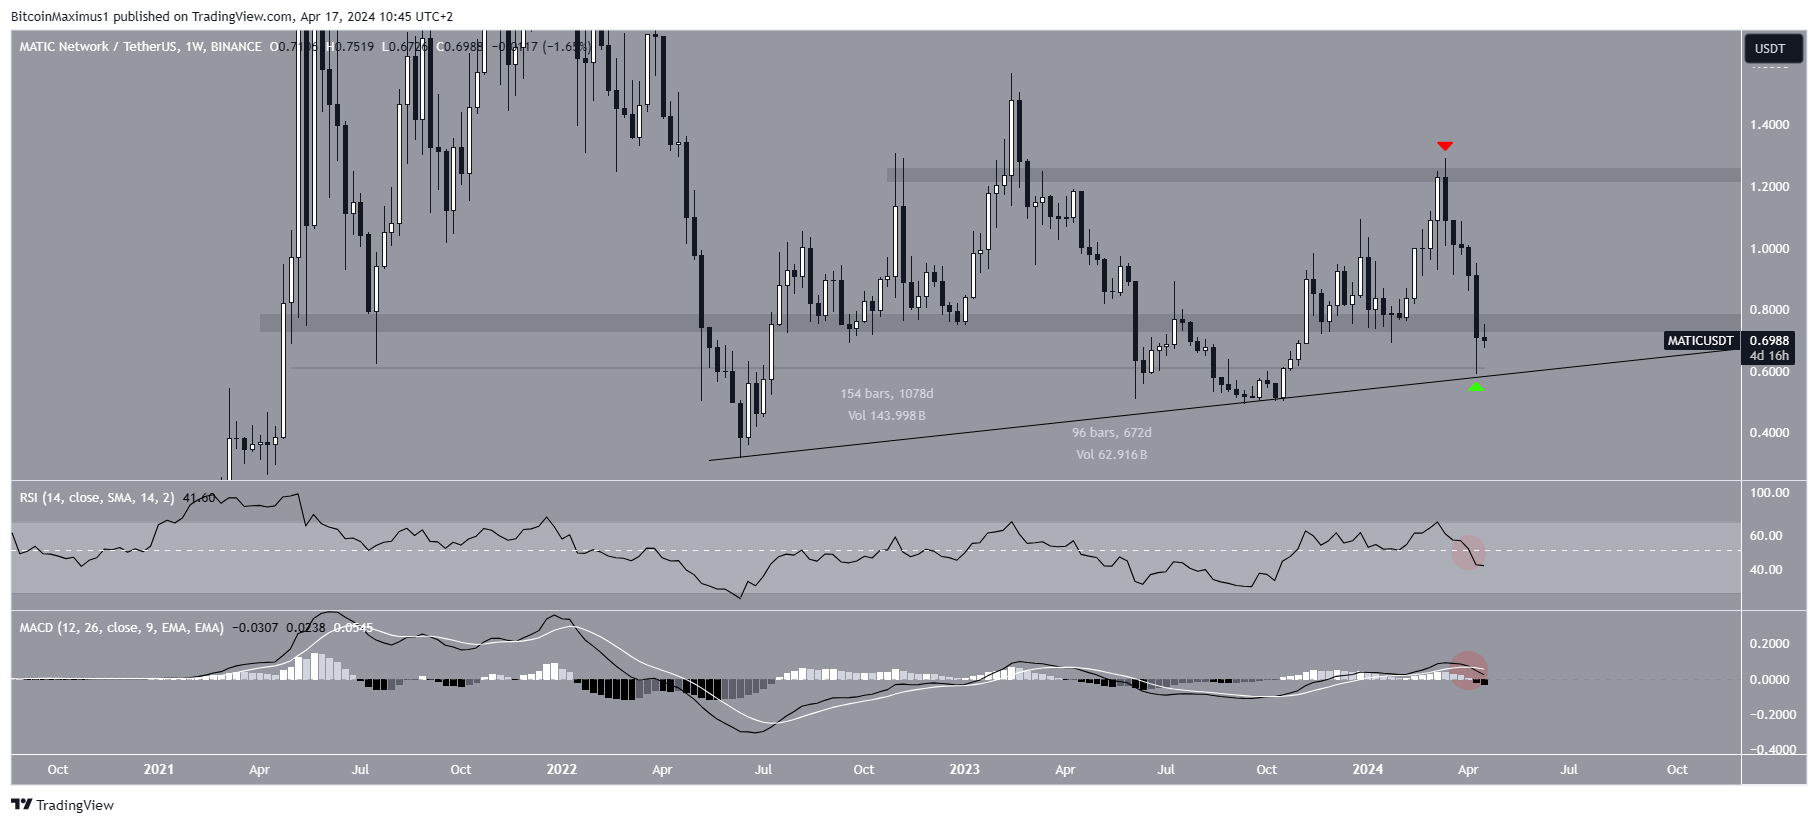
The MATIC price has increased alongside an ascending support trend line since June 2022. The increase was swift at the start, leading to a high of $1.57 in February 2023. However, the price has fallen since, returning to the trend line in October 2023.
After another bounce, MATIC created a lower high of $1.25 in March 2024. What followed next was a five-week downward movement, leading to a yearly low of $0.58 on April 13. The decrease validated the $1.25 horizontal area as resistance.
MATIC/USDT Weekly Chart | Credit: TradingView
Exacerbating the drop, the MATIC price also fell below the $0.75 horizontal level. This level is critical since it has intermittently acted as both resistance and support for nearly 1,100 days.
The weekly MACD and RSI both give bearish readings. The RSI has fallen below 50 while the MACD has made a bearish cross (red circle).
Since MATIC trades between long-term support and resistance, looking at a lower time frame is needed to determine if the price will fall below support or reclaim resistance instead.
MATIC Price Prediction: Breakdown or Relief?
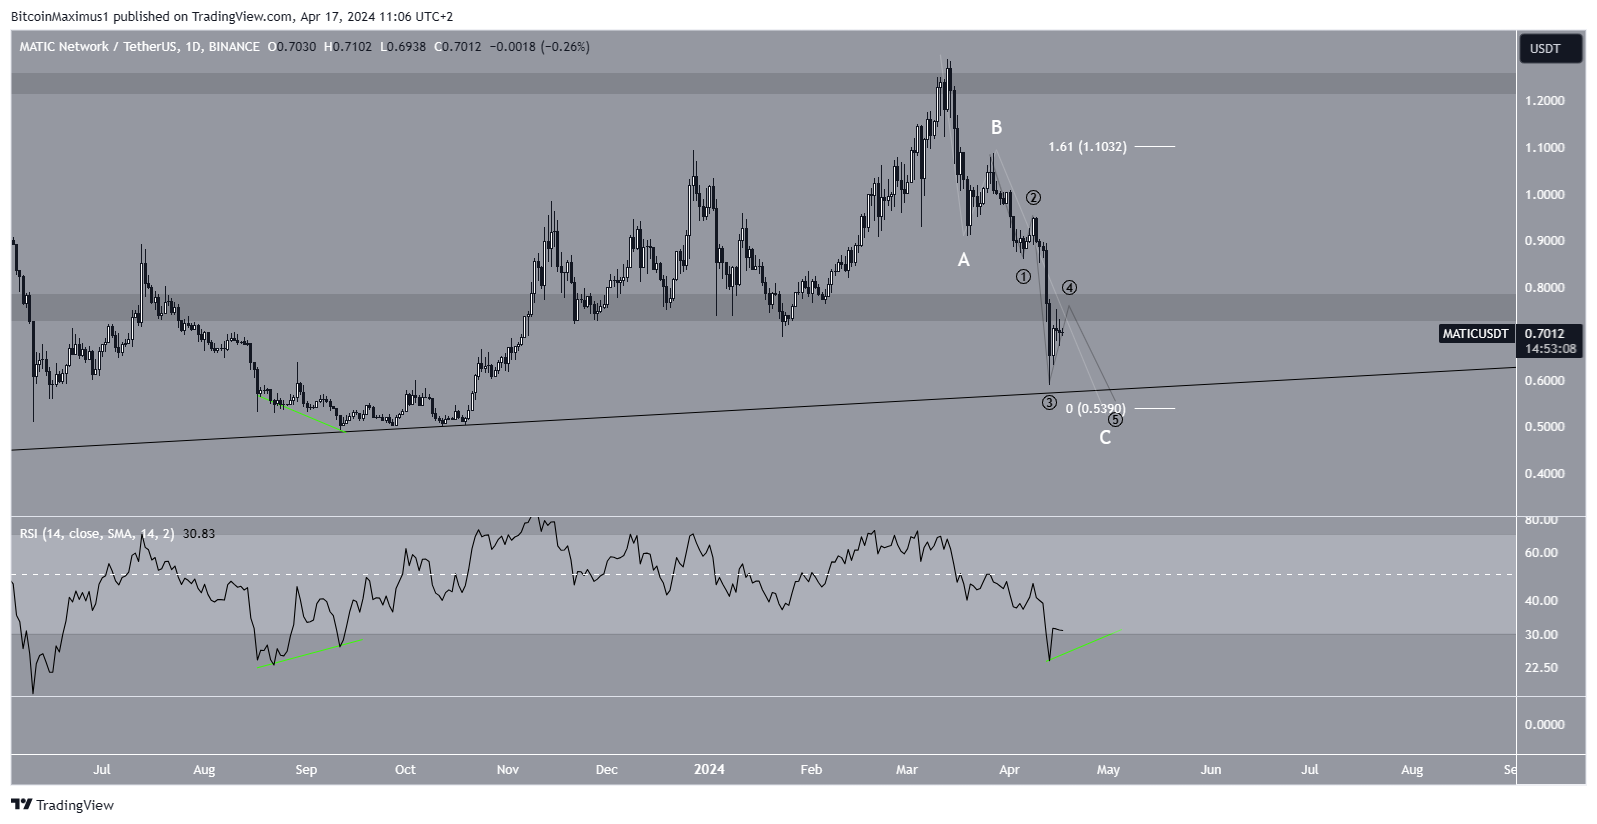
The daily time frame wave count suggests MATIC is in the C wave of an A-B-C corrective structure (white). The sub-wave count (black) indicates it is in the fifth and final wave of this decrease.
Giving waves A:C a 1:1.61 ratio leads to a low of $0.54, slightly below the long-term ascending support trend line.
The daily RSI gives an interesting reading, since it fell deep into oversold territory at 23. The previous time this happened was in September 2023. At the time, MATIC made a slightly lower low next month, validating the support trend line and creating a bullish divergence (green).
MATIC/USDT Daily Chart | Credit: TradingView
If the correction transpires as predicted, MATIC will do the same in April/May 2024.
So, the most likely outlook suggests the support trend line will prevail. After another retest, the MATIC price can resume its previous bullish trend and break out above $0.75.
MATIC Nearing the End of Its Decrease
Despite a lackluster performance in 2024 and a downright poor one in March and April, the MATIC correction could be coming to an end. If the long-term ascending support trend line holds and the RSI makes a bullish divergence, it will confirm the end of the decrease and catalyze a long-term upward movement.
Valdrin Tahiri is a cryptocurrency analyst and reporter at CCN, specializing in technical analysis with a focus on Elliott Wave theory, on-chain metrics, and fundamental research. He brings over seven years of experience in the crypto space as both a trader and writer.
He discovered cryptocurrencies in 2017 while earning his MSc in Financial Markets at the Barcelona School of Economics, which sparked a deep interest in blockchain and market dynamics. Since then, he’s contributed to top crypto outlets like BeInCrypto and CoinGape.
Valdrin also served as Community Manager of BeInCrypto’s Telegram group for three years, helping grow it into one of the largest crypto communities worldwide. His expertise in market structure and price patterns allows him to break down complex trends into clear, actionable insights.
He’s published thousands of articles covering altcoins, Bitcoin cycles, and macro trends.