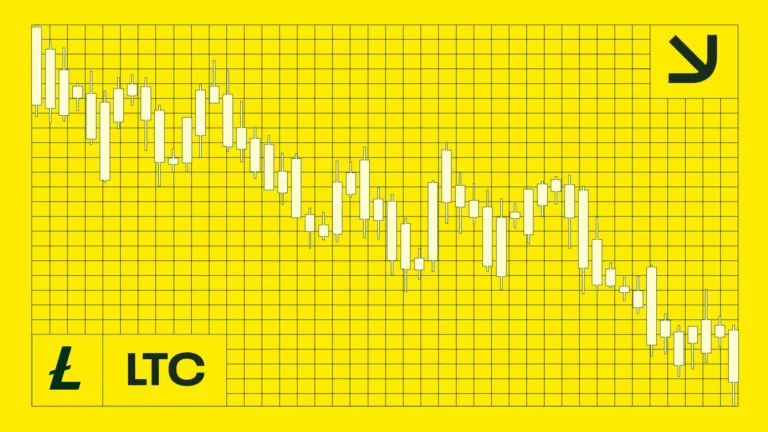
LTC forms a descending triangle, signaling weakening momentum.
Pi Cycle Top suggests LTC’s price has recently hit a local peak.
A bullish reversal requires reclaiming $108 resistance level.
Litecoin’s (LTC) price has dropped below $100 since Nov. 11. This has sparked fresh concern among holders, who expected the altcoin to trade higher.
However, the bigger issue lies below Litecoin’s current price.
A breakdown there could open the door to an extended correction, putting bulls under intense pressure.
Here are the key levels to watch and what could lie ahead for LTC.
Litecoin Finally Cracks
As seen on the 4-hour chart, Litecoin’s price has formed a descending triangle, a pattern that signals weakening momentum and the potential for further downside.
On Monday, Nov. 17, LTC briefly broke below the horizontal support, hinting at increased selling pressure.
Get These Top Crypto Casino Offers Now!
Sponsored
Disclosure
We sometimes use affiliate links in our content, when clicking on those we might receive a commission at no extra cost to you. By using this website you agree to our terms and conditions and privacy policy.
Should this trend fail to change, Litecoin’s price risks dropping below the support at $91.14. This could also lead it to decline toward $86.03.
On-Chain Analysis
From an on-chain perspective, the Pi Cycle Top indicator suggests that Litecoin may have already reached a local top several weeks ago.
This signal is triggered when shorter-term moving averages rise into historically overheated zones.
Currently, the 111-day Moving Average (MA), a key component of the Pi Cycle model, sits at $109.37.
Since LTC’s price recently approached this level and subsequently pulled back, the indicator implies that bullish momentum may have peaked temporarily.
When the Pi Cycle Top flashes such conditions, it precedes pullbacks, reinforcing the view that Litecoin’s price could be entering a prolonged correction period.
LTC Price Analysis: Worst Not Over
Examining the daily chart, Litecoin’s price has fallen below the Ichimoku Cloud, signaling that bearish momentum currently dominates the market structure.
Additionally, the Relative Strength Index (RSI) is below the neutral midpoint, indicating weakening momentum.
Given these conditions, LTC will likely drop below $90.98, which aligns with the 0.382 Fibonacci retracement level.
If the overall cryptocurrency market slips into a full-blown bear phase, Litecoin could extend its decline even further, potentially falling toward $63.28.
Disclaimer:
The information provided in this article is for informational purposes only. It is not intended to be, nor should it be construed as, financial advice. We do not make any warranties regarding the completeness, reliability, or accuracy of this information. All investments involve risk, and past performance does not guarantee future results. We recommend consulting a financial advisor before making any investment decisions.
Victor Olanrewaju is a crypto analyst and reporter at CCN with deep roots in on-chain research and technical analysis. His crypto journey began in 2017, but it was the 2020 Uniswap airdrop that sparked a full-time pivot into the space.
With a foundation in copywriting, Victor honed his craft creating high-converting content for leading crypto brokers — most notably an XRP price prediction that ranked #1 on Google during the 2021 bull run.
He later joined AMBCrypto in 2022, where he combined storytelling with technical and on-chain analysis to cover key market narratives.
In 2024, he expanded his expertise at BeInCrypto, collaborating with analysts and using tools like Glassnode, Santiment, and IntoTheBlock to break down Bitcoin and altcoin trends.
At CCN, Victor covers the top cryptocurrencies, memecoins, macro shifts, blending real-time insights with deep-dive metrics.
He holds a Bachelor’s degree in Physics from the University of Ibadan, equipping him to simplify complex data for a wide audience. Follow his work or connect on LinkedIn or X.