Meet the Top 101 in Crypto

Hedera (HBAR) Price Analysis — Final Correction Before the Next Rally

Published 02 September 2025
Valdrin Tahiri
Authors
Edited by Ryan James

Key Takeaways

  • Hedera (HBAR) broke down from a bearish head-and-shoulders formation.
  • The HBAR price is in wave Y of a complex, W-X-Y corrective structure.
  • When and at what price will the Hedera correction finally end?

HBAR surged considerably in June, peaking at a high of $0.299 in the middle of July.

However, the price has lost its strength, falling by nearly 30% and breaking down from several key support levels.

Last week, Hedera confirmed its downward trend by breaking down from a head-and-shoulders pattern.

With that in mind, let’s examine the price action to determine when the downward movement will end.

Hedera’s Bearish Pattern

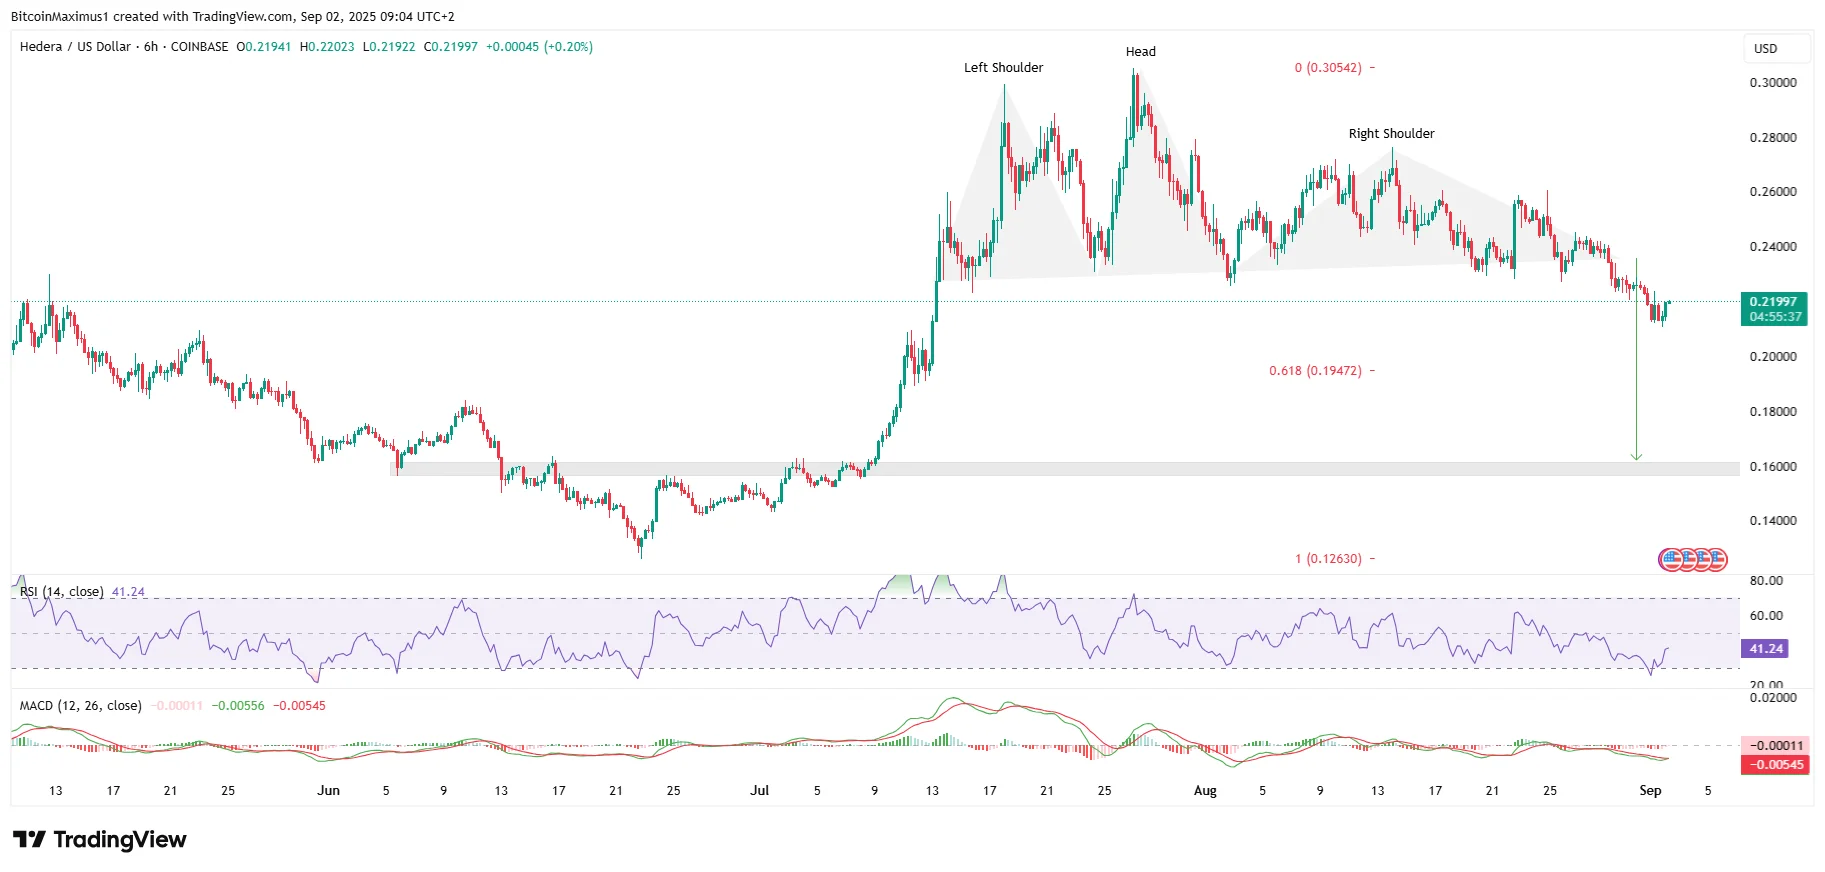
Hedera’s price has fallen since its high of $0.305 on July 27, which created the “head” portion of a head-and-shoulders pattern.

After its decline, HBAR created a lower high in August and resumed its downward trend, suggesting that bears had taken over.

Get These Top Crypto Casino Offers Now!
Sponsored
Disclosure
Opened in 2023
Promotions
200% deposit bonus up to 20,000 USDT + up to 100 FS (promo code: CG100)
Coins
Tether Bitcoin Ethereum USD Coin TRON +7
Opened in 2022
Promotions
100% of the first bet amount back + Rakeback up to 30% + 100 Freespins
Coins
Bitcoin Ethereum Tether Dogecoin Litecoin +12
Opened in 2018
Promotions
500% Welcome Bonus up to $90,000 + 100 Free Spins
Coins
Bitcoin Ethereum Litecoin Tether Dogecoin +3
Show More

Besides the lower high, the most concerning development is creating a head-and-shoulders pattern, a sign of a bearish trend reversal.

After several unsuccessful bounces, the HBAR price broke down from the neckline last week, confirming it is mired in a bearish trend.

HBAR Pattern
HBAR/USDT 6-Hour Chart | Credit: Valdrin Tahiri/TradingView

The main Fibonacci support level is at $0.195, but a decline that travels the entire pattern’s length will take HBAR down to $0.160.

Momentum readings are also bearish, since the Relative Strength Index (RSI) and Moving Average Convergence/Divergence (MACD) are falling.

While the indicators are oversold, no bearish divergences have been generated yet.

Combined with the price action, these signals suggest the Hedera prediction is bearish and the price will continue to fall.

When Will HBAR Bottom?

The wave count confirms the bearish analysis from the price action and gives more confluence to the bearish Hedera target.

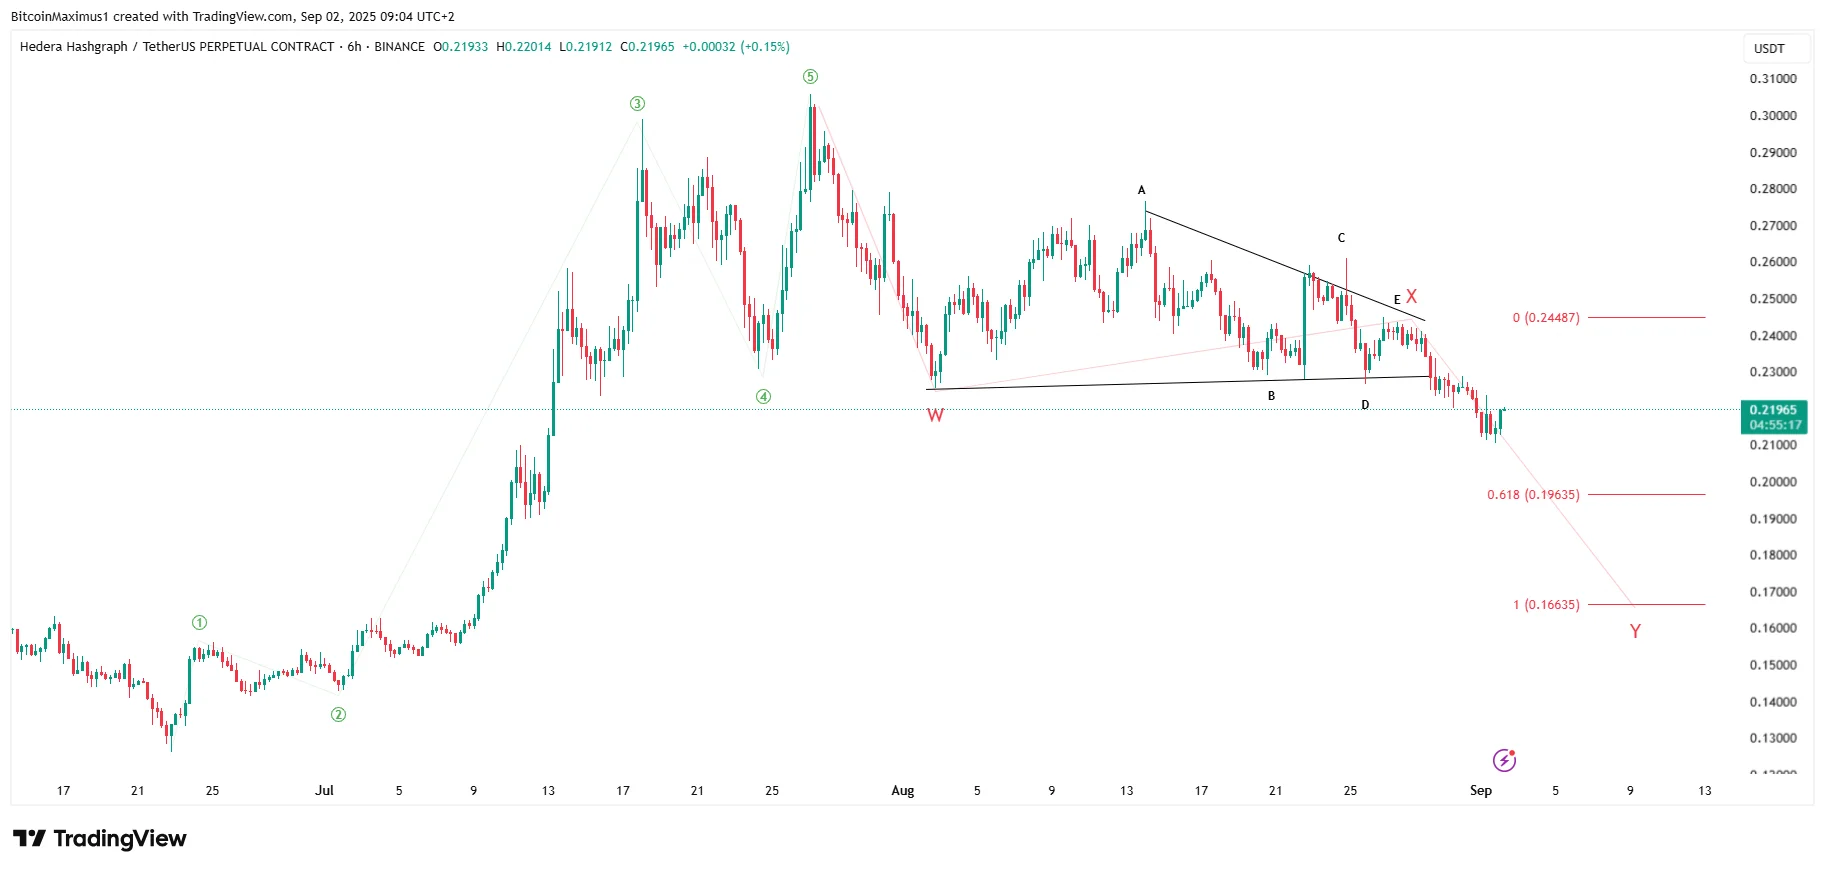
The wave count shows that HBAR is in the Y wave of a W-X-Y correction, where wave X created a symmetrical triangle.

If the count is accurate, more downsides remain until HBAR reaches its bottom.

HBAR Count
HBAR/USDT 6-Hour Chart | Credit: Valdrin Tahiri/TradingView

If wave Y has the same length as wave W, HBAR will bottom near $0.166, reaching the previously outlined horizontal support.

A shallower correction could lead to a bottom near $0.196, but the primary target remains at $0.160-$0.166 because of the multiple confluences.

Hedera Prediction for 2025

Hedera’s long-term prediction remains bullish despite the gloomy outlook from the short-term time frames.

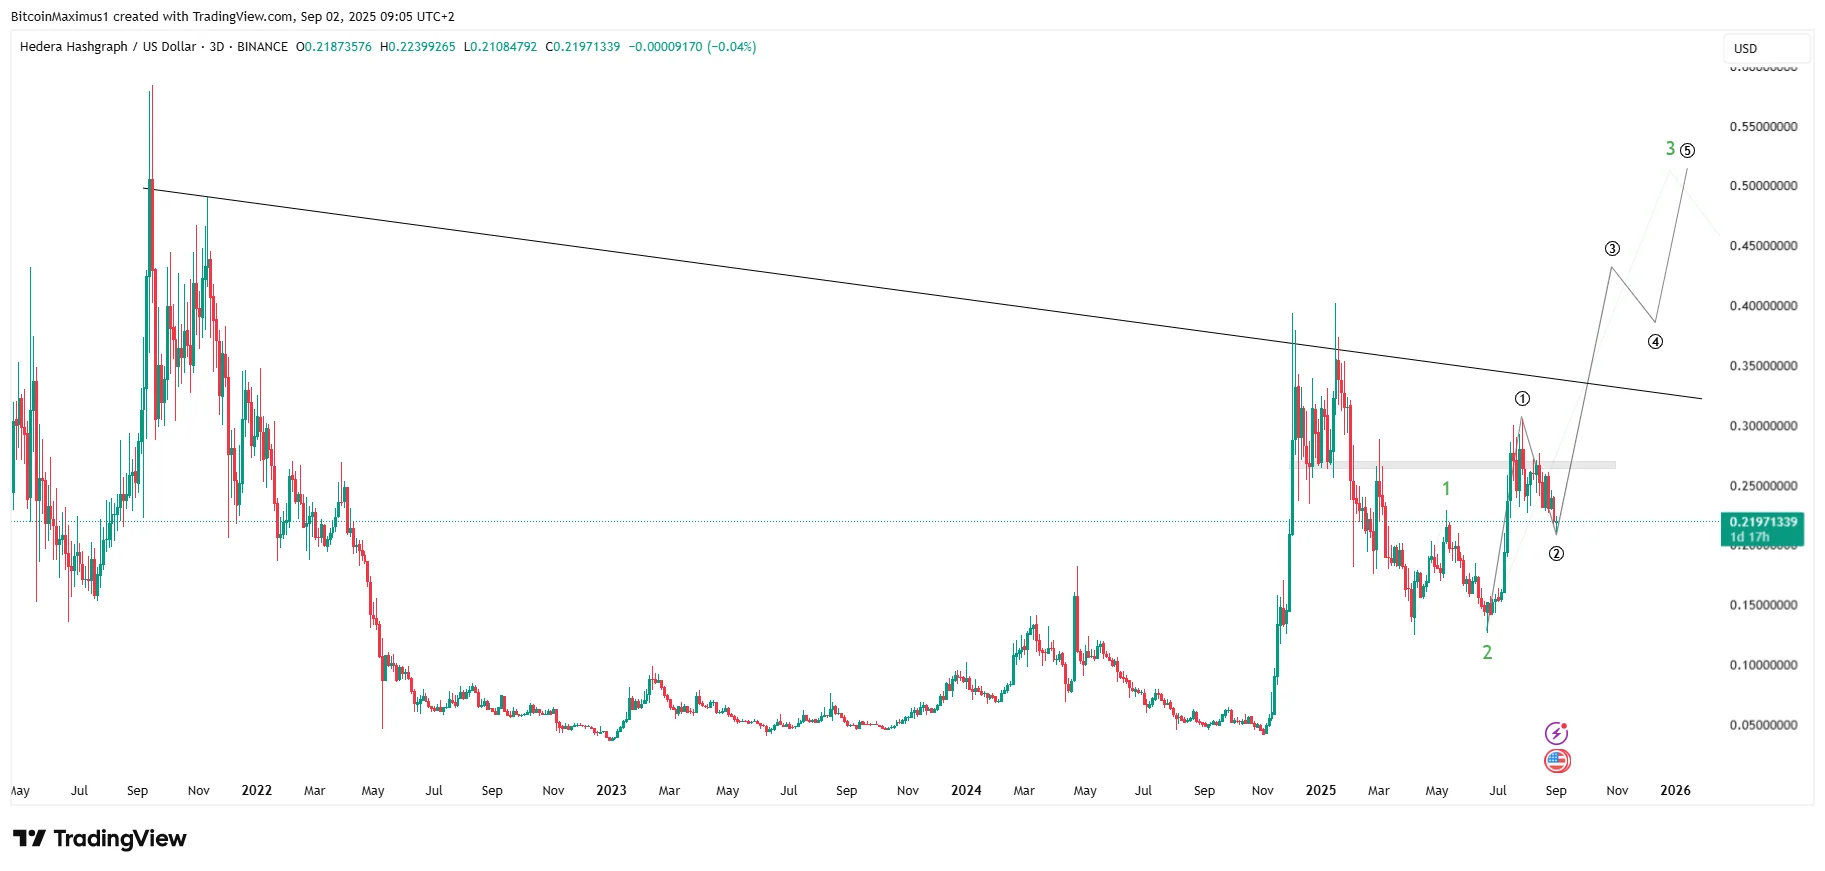
According to the count, HBAR completes the second portion of a 1-2/1-2 wave setup (green and black).

If it completes the pattern, it will soon begin a parabolic upward movement, taking it to a new cycle high.

HBAR Long-Term
HBAR/USDT 3-Day Chart | Credit:Valdrin Tahiri/TradingView

HBAR must break out above the $0.265 resistance area to confirm this pattern and then clear its long-term descending resistance trend line.

If that happens, the road to a new cycle high will be open, meaning that HBAR could cross $0.26 for the first time in years.

Final Dip Before Rally

HBAR confirmed its bearish trend in the short term with a breakdown from its head and shoulders pattern. 

The downward trend could continue until $0.196 and possibly $0.160-$0.166.

However, the long-term wave count is bullish, implying that Hedera will rally again once the correction ends.

Disclaimer: The information provided in this article is for informational purposes only. It is not intended to be, nor should it be construed as, financial advice. We do not make any warranties regarding the completeness, reliability, or accuracy of this information. All investments involve risk, and past performance does not guarantee future results. We recommend consulting a financial advisor before making any investment decisions.
Valdrin Tahiri

Valdrin Tahiri is a cryptocurrency analyst and reporter at CCN, specializing in technical analysis with a focus on Elliott Wave theory, on-chain metrics, and fundamental research. He brings over seven years of experience in the crypto space as both a trader and writer.

He discovered cryptocurrencies in 2017 while earning his MSc in Financial Markets at the Barcelona School of Economics, which sparked a deep interest in blockchain and market dynamics. Since then, he’s contributed to top crypto outlets like BeInCrypto and CoinGape.

Valdrin also served as Community Manager of BeInCrypto’s Telegram group for three years, helping grow it into one of the largest crypto communities worldwide. His expertise in market structure and price patterns allows him to break down complex trends into clear, actionable insights.

He’s published thousands of articles covering altcoins, Bitcoin cycles, and macro trends.

Related

Survey Icon
Help us improve
1 of 4
Is this your first time here?
What brought you here today?
What are you most interested in?
Would you be interested in:
Thank you icon
Thank you for your feedback!
DMCA.com Protection Status