When Will the Crypto Correction End? | Credit: Veronica Cestari
Share
Key Takeaways
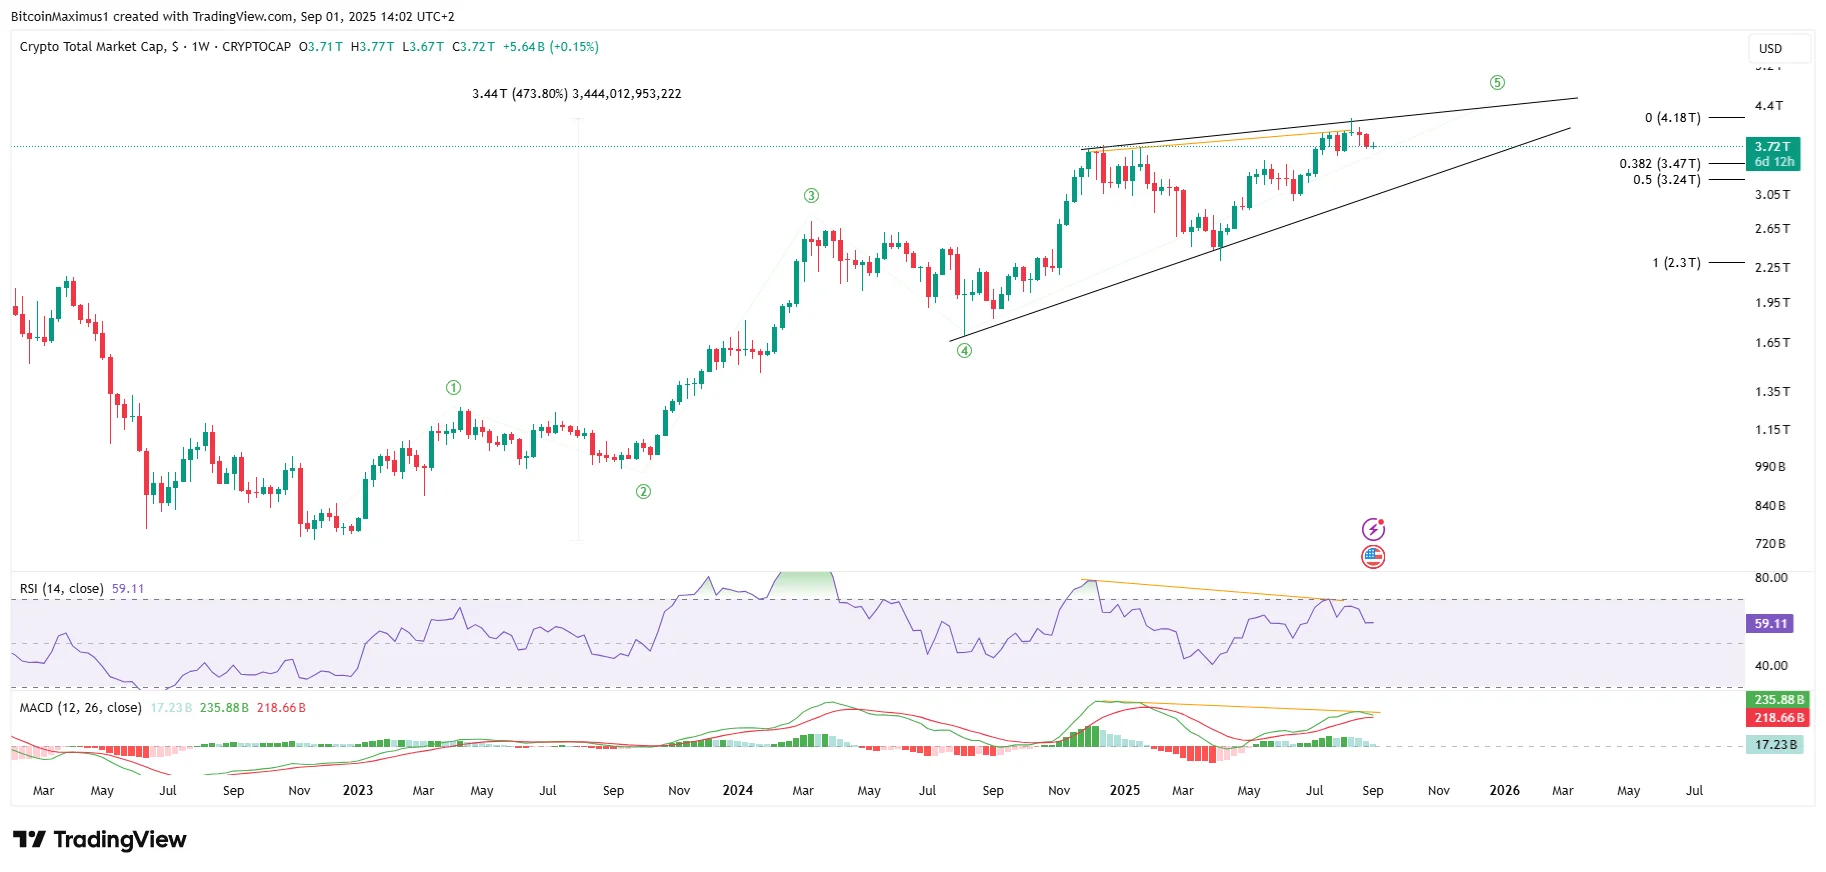
The Total Crypto Market Cap (TOTALCAP) has fallen by over 10%.
TOTALCAP could be in its upward movement’s fifth and final wave.
When will the crypto market regain its footing and reach new highs?
The crypto market has cooled off after a massive rally earlier this year.
After reaching an all-time high of $4.17 trillion in August, prices have pulled back by more than 10%.
The big question is whether this dip is just a healthy reset or a warning of bigger trouble ahead.
Crypto Market Update
The crypto market has increased by nearly 500% in this bull cycle, reaching a new all-time high of $4.17 trillion at the beginning of August.
However, momentum has waned since then, triggering a short-term decline of more than 10%.
Several concerning signs are gradually developing in the long-term chart.
Get These Top Crypto Casino Offers Now!
Sponsored
Disclosure
We sometimes use affiliate links in our content, when clicking on those we might receive a commission at no extra cost to you. By using this website you agree to our terms and conditions and privacy policy.
Giving waves A and C the same length leads to a bottom of $3.52 trillion, creating a throwover relative to the descending wedge.
The sub-wave count (black) supports this outlook, confirming another decline left until the correction is over.
Correction Ending
The crypto market is down, but that is about to change. The market looks close to finishing its correction, with several strong support levels lining up.
Momentum is still weak, but the charts hint at one last move higher before the cycle tops out.
While the short-term bottom may not be here yet, the crypto market could end its correction this week.
Disclaimer:
The information provided in this article is for informational purposes only. It is not intended to be, nor should it be construed as, financial advice. We do not make any warranties regarding the completeness, reliability, or accuracy of this information. All investments involve risk, and past performance does not guarantee future results. We recommend consulting a financial advisor before making any investment decisions.
Valdrin Tahiri is a cryptocurrency analyst and reporter at CCN, specializing in technical analysis with a focus on Elliott Wave theory, on-chain metrics, and fundamental research. He brings over seven years of experience in the crypto space as both a trader and writer.
He discovered cryptocurrencies in 2017 while earning his MSc in Financial Markets at the Barcelona School of Economics, which sparked a deep interest in blockchain and market dynamics. Since then, he’s contributed to top crypto outlets like BeInCrypto and CoinGape.
Valdrin also served as Community Manager of BeInCrypto’s Telegram group for three years, helping grow it into one of the largest crypto communities worldwide. His expertise in market structure and price patterns allows him to break down complex trends into clear, actionable insights.
He’s published thousands of articles covering altcoins, Bitcoin cycles, and macro trends.