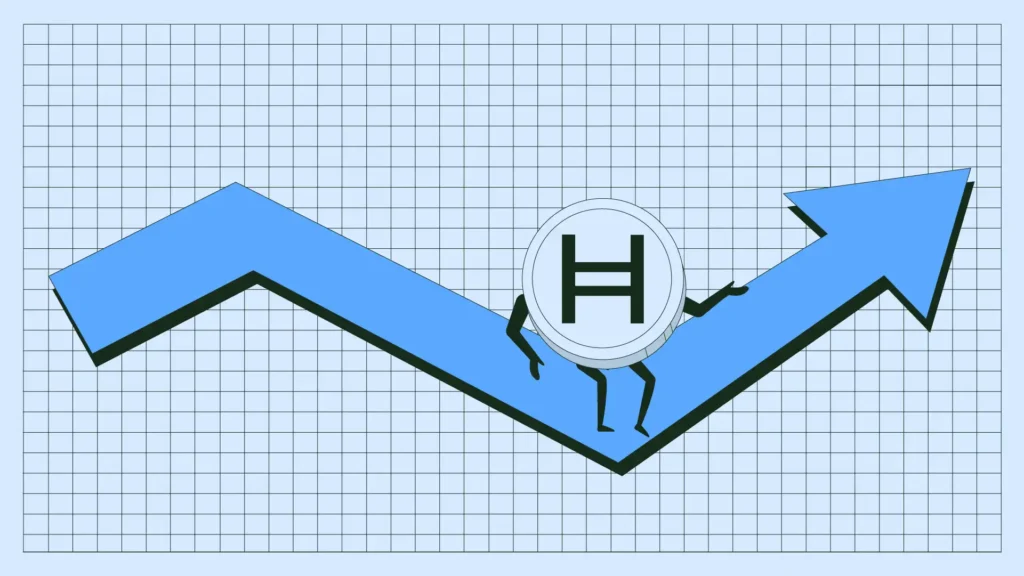
HBAR is weakening inside a descending structure, as bullish momentum fades.
Volatility is rising while prices drift lower, often signaling mounting uncertainty.
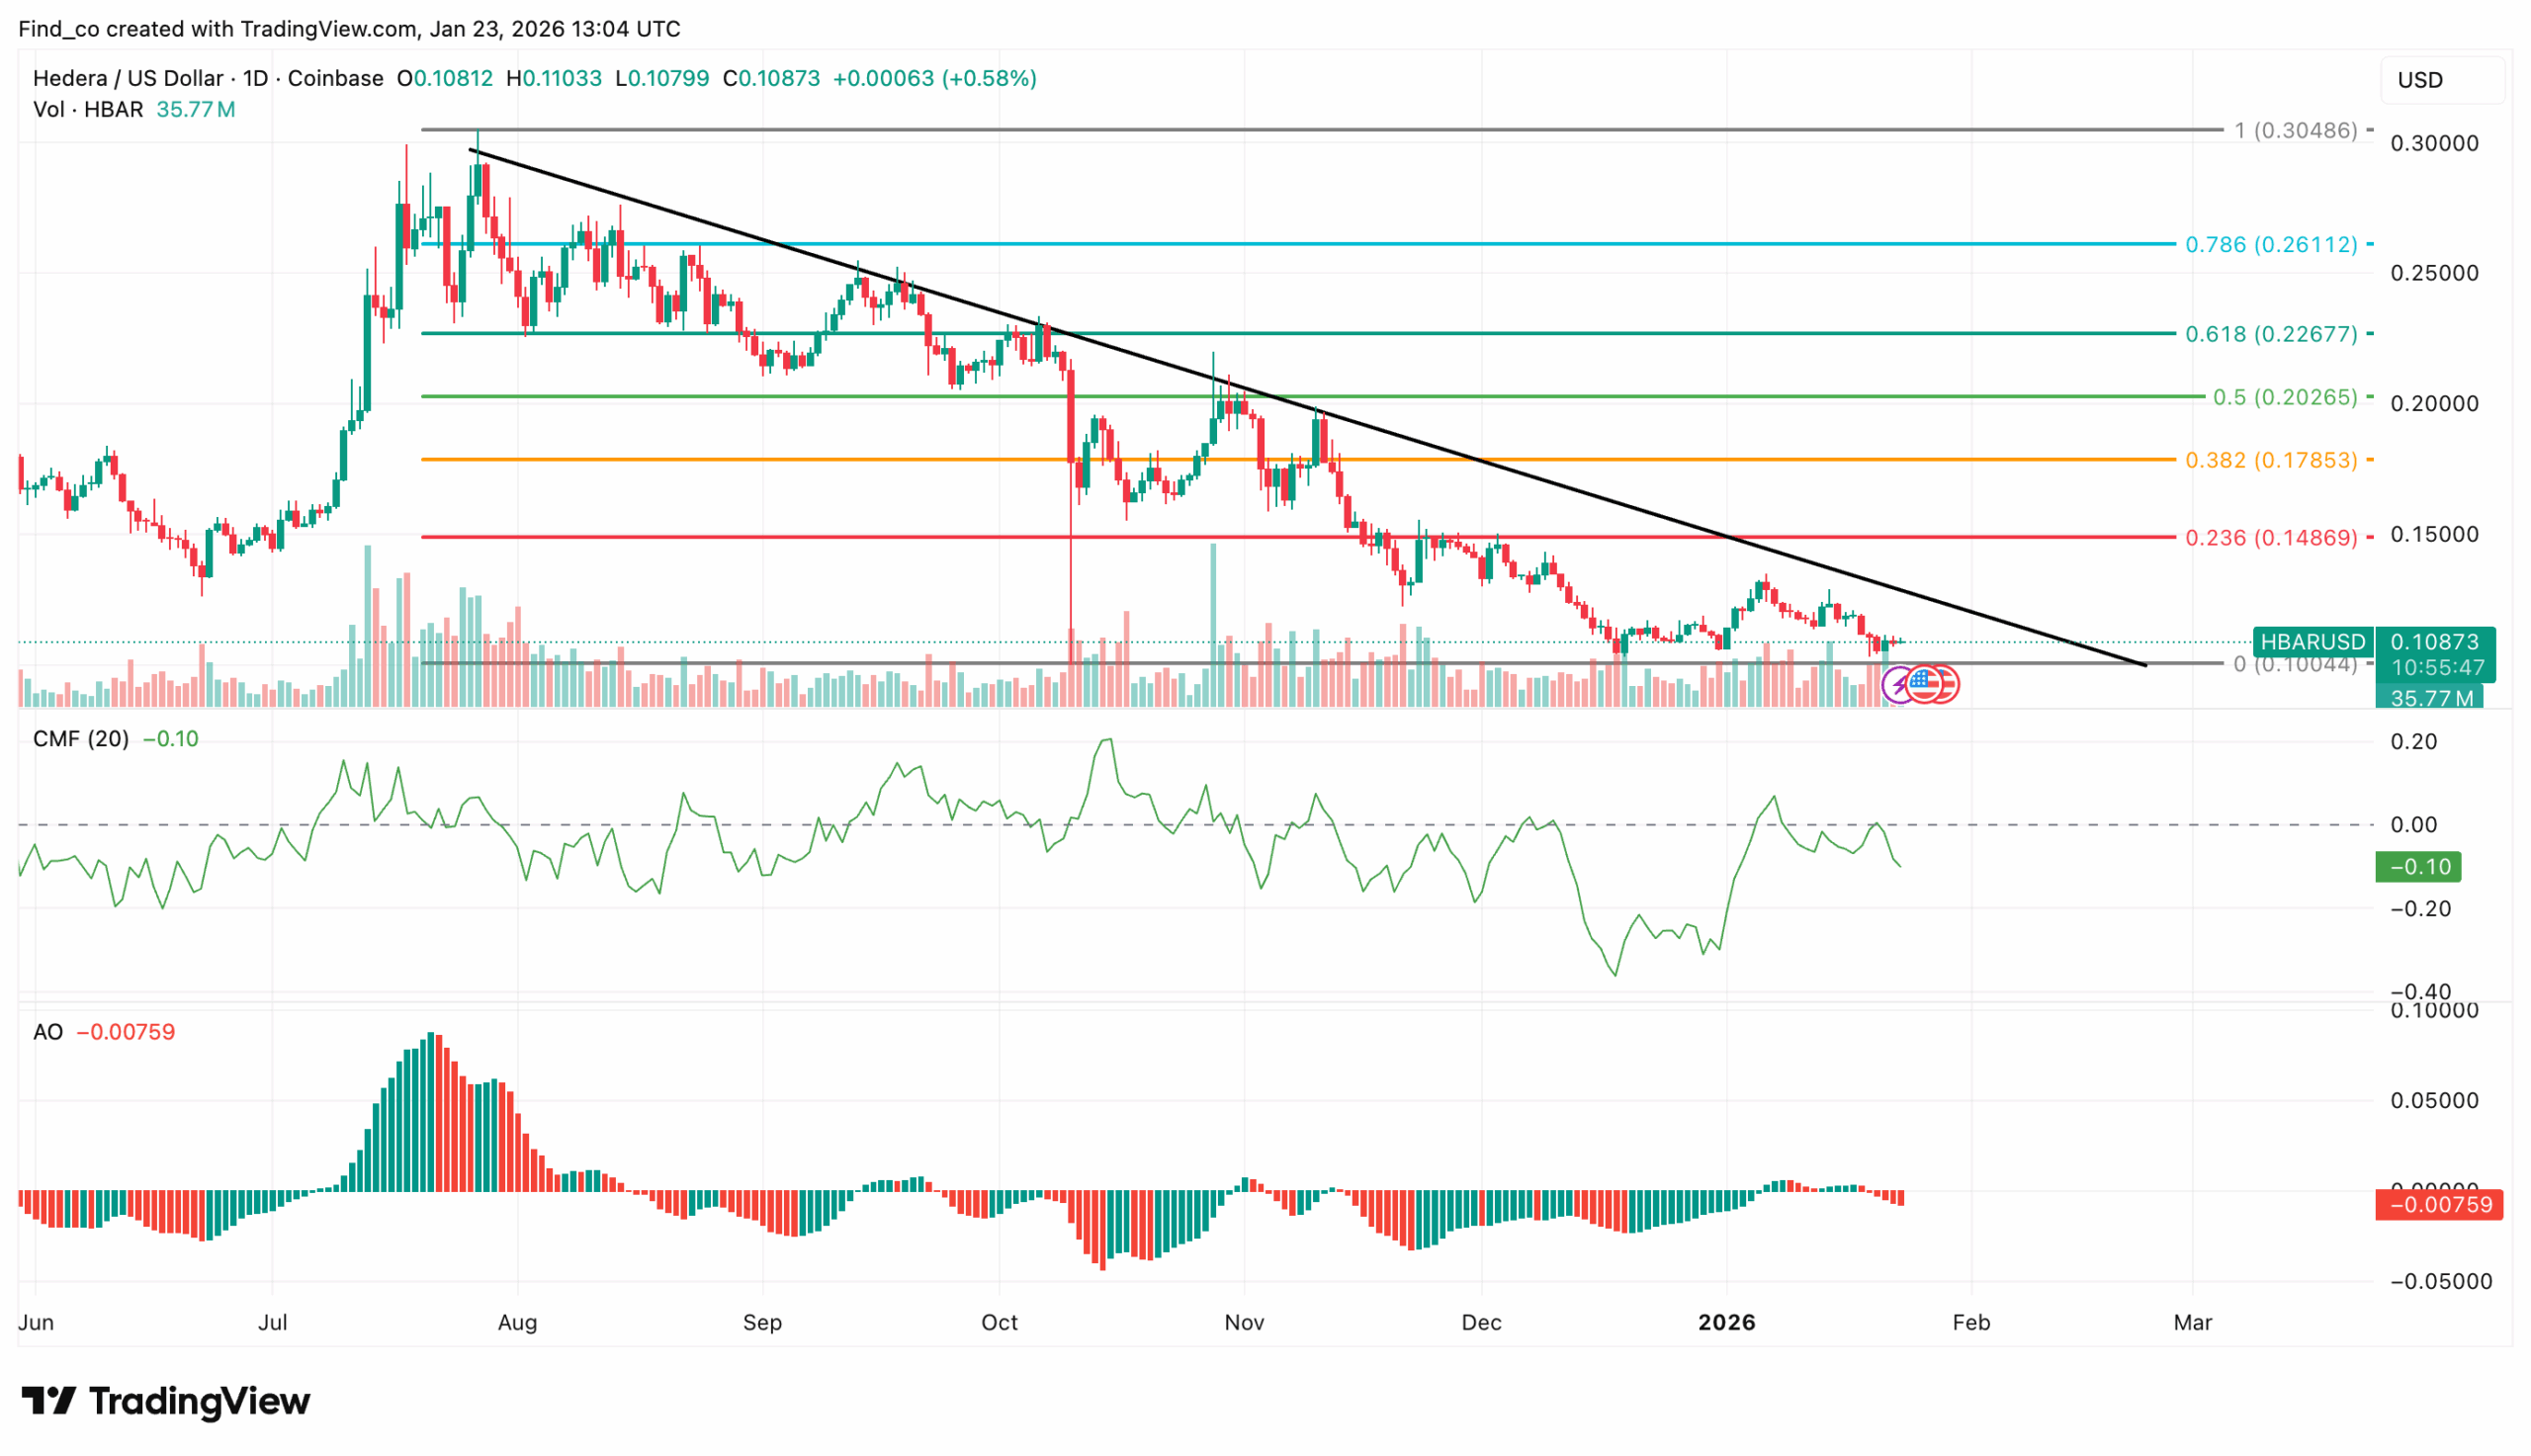
On the daily chart, negative CMF and AO back the HBAR bearish thesis.
Hedera (HBAR) is starting to look fragile. Price is compressing inside a clear descending structure, and that pressure is building right above the $0.10 psychological floor.
Bulls have tried to rebound.
However, each bounce has faded fast. As a result, sellers are slowly reclaiming control across both the 4-hour and daily timeframes.
So, what’s next for HBAR’s price?
HBAR Remains Trapped
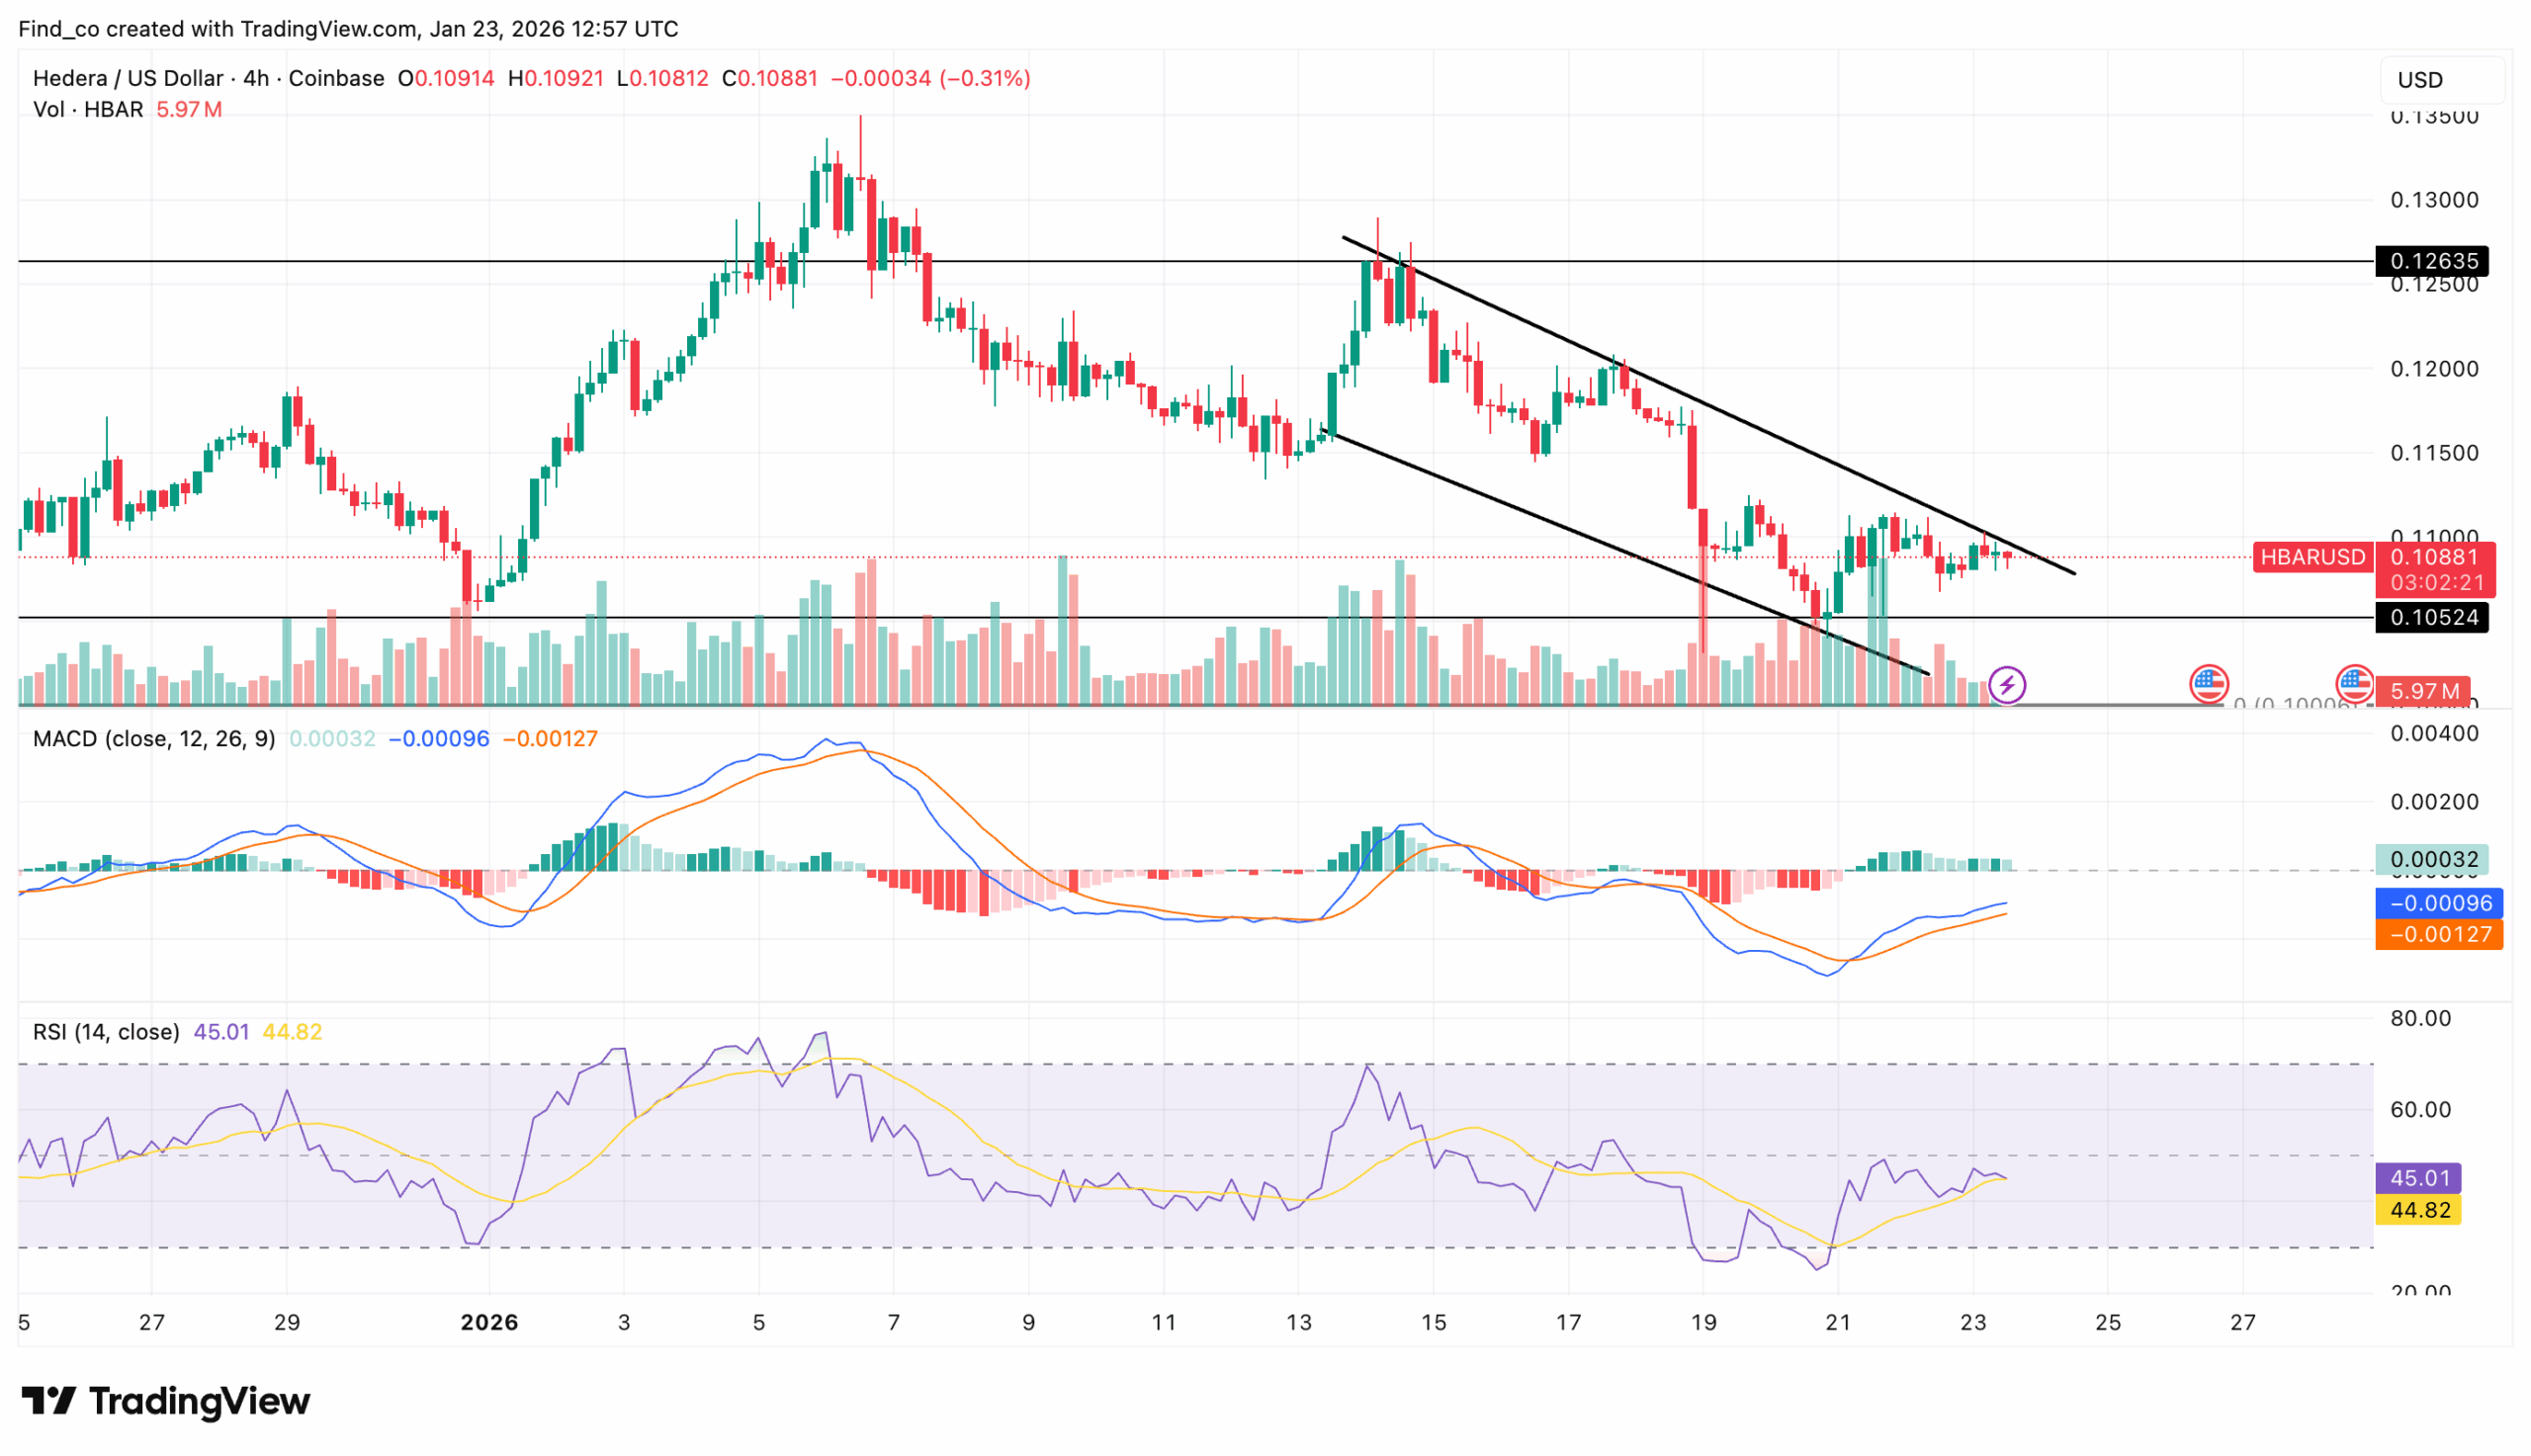
On the 4-hour chart, momentum is fading in real time. The Moving Average Convergence Divergence (MACD) still shows the 12 EMA slightly above the 26 EMA, but the histogram is shrinking quickly.
That tells you the uptrend will likely retrace. It also raises the odds of a bearish flip if sellers keep leaning on price.
Meanwhile, the Relative Strength Index (RSI) confirms the weakness.
It has slipped below the 50 midline and now sits near 43.99, signaling falling demand and a market leaning defensive.
The structure also looks heavy. HBAR’s price is still confined within a descending trendline and is drifting toward the channel’s lower boundary. The $0.10 zone is now the line that matters.
If HBAR breaks below that range with substantial volume, the next downside pocket opens toward $0.095, and then lower support levels come into focus quickly.
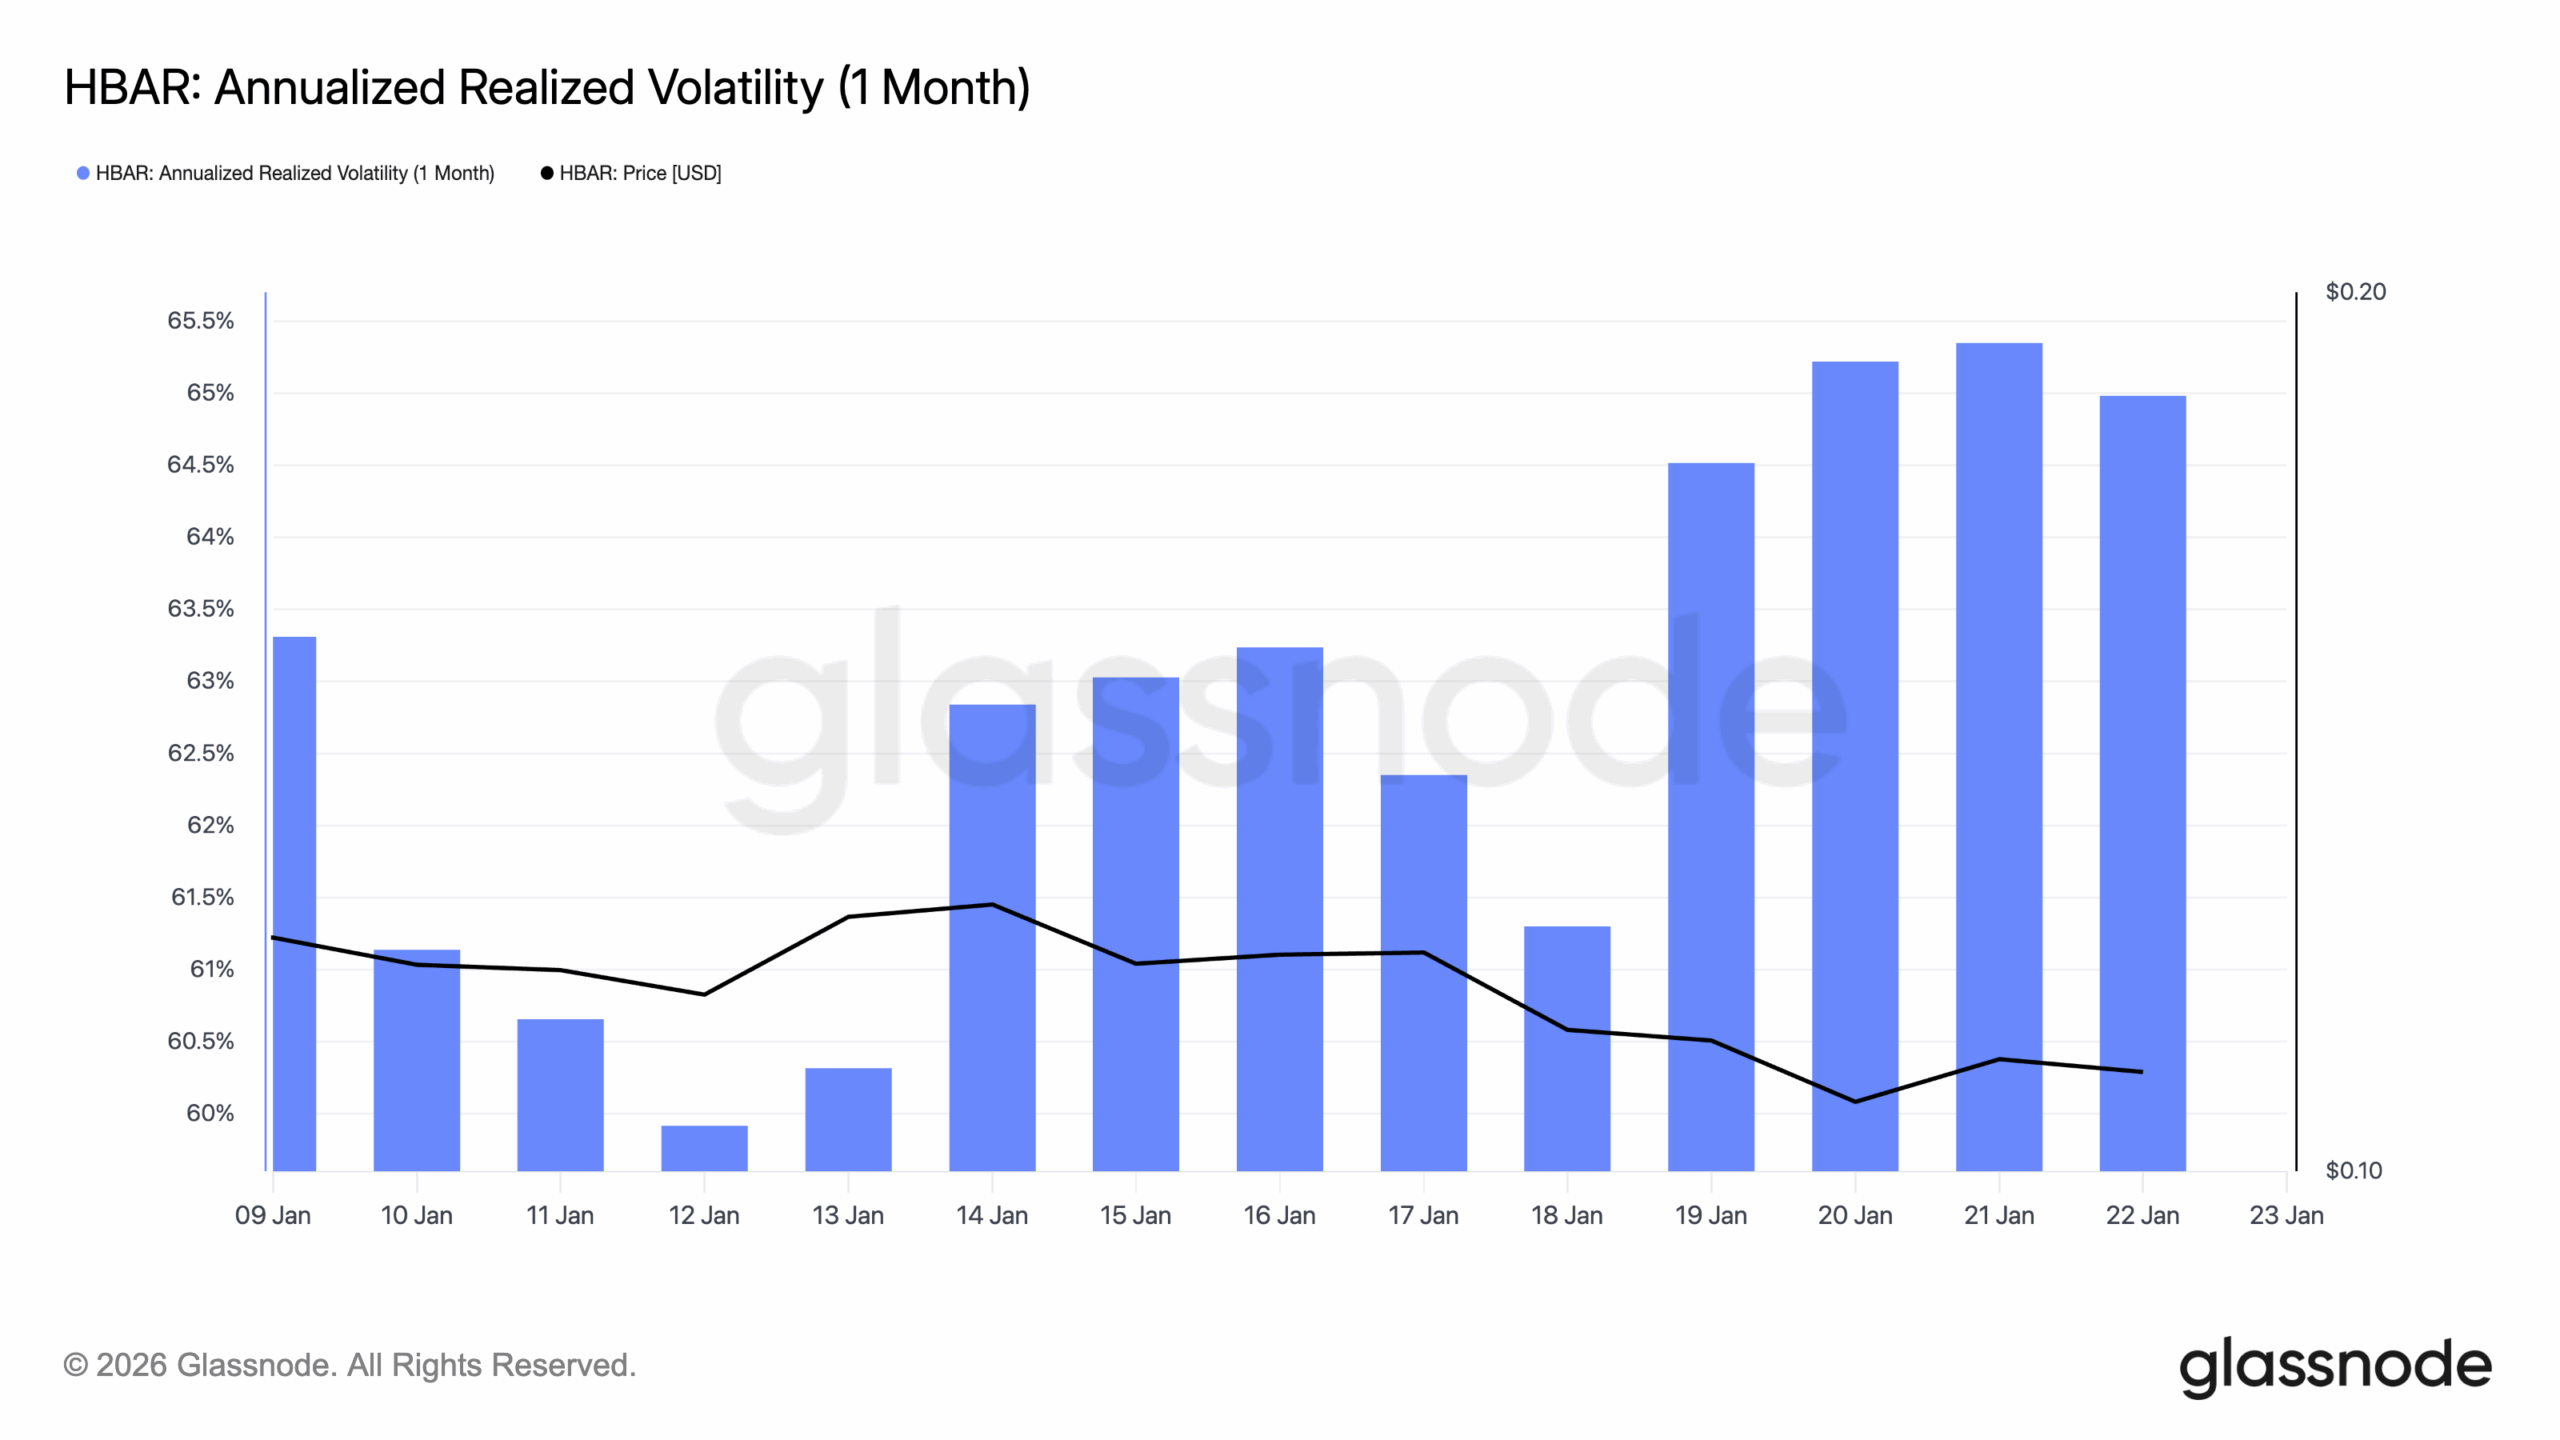
Meanwhile, HBAR’s short-term volatility is climbing again, even as price action remains subdued.
One-month annualized realized volatility has pushed back above the mid-60% range, marking a straightforward pickup from the calmer conditions seen earlier in January.
This rise signals that HBAR is entering a more reactive phase, where price swings are becoming larger and more frequent.
At the same time, spot price has failed to follow volatility higher. HBAR has drifted slightly lower over the same period, slipping toward the lower end of its recent range. That divergence matters.
Historically, rising realized volatility alongside stagnant or falling prices often reflects positioning and uncertainty building beneath the surface, rather than a trend move already in progress.
The daily chart keeps the bearish case intact. HBAR’s price remains trapped in a descending channel, and it continues to print lower highs and lower lows.
Capital flow data is not helping. As seen below, the Chaikin Money Flow (CMF) remains deep in negative territory, signaling sustained outflows and weak accumulation.
Furthermore, the Awesome Oscillator (AO) has also flipped negative and is printing red bars, confirming that bearish momentum is expanding rather than stabilizing.
Fibonacci levels reinforce the roadmap. With HBAR trading around $0.11, the path of least resistance still points down toward $0.10, and then toward $0.085 if the breakdown deepens.
However, the bearish thesis weakens if buyers step in aggressively and reclaim key levels.
If that happens, HBAR’s price could attempt a recovery toward $0.15, but it would need a clear momentum flip and stronger inflows to make that move credible.
Disclaimer:
The information provided in this article is for informational purposes only. It is not intended to be, nor should it be construed as, financial advice. We do not make any warranties regarding the completeness, reliability, or accuracy of this information. All investments involve risk, and past performance does not guarantee future results. We recommend consulting a financial advisor before making any investment decisions.
Victor Olanrewaju is a crypto analyst and reporter at CCN with deep roots in on-chain research and technical analysis. His crypto journey began in 2017, but it was the 2020 Uniswap airdrop that sparked a full-time pivot into the space.
With a foundation in copywriting, Victor honed his craft creating high-converting content for leading crypto brokers — most notably an XRP price prediction that ranked #1 on Google during the 2021 bull run.
He later joined AMBCrypto in 2022, where he combined storytelling with technical and on-chain analysis to cover key market narratives.
In 2024, he expanded his expertise at BeInCrypto, collaborating with analysts and using tools like Glassnode, Santiment, and IntoTheBlock to break down Bitcoin and altcoin trends.
At CCN, Victor covers the top cryptocurrencies, memecoins, macro shifts, blending real-time insights with deep-dive metrics.
He holds a Bachelor’s degree in Physics from the University of Ibadan, equipping him to simplify complex data for a wide audience. Follow his work or connect on LinkedIn or X.