Home / Analysis / Crypto / Technical Analysis / Gold to $4,900, Silver to $98 — Bitcoin (BTC) Unlikely to Test $100K as Bank of Japan Keeps Interest Rate Unchanged
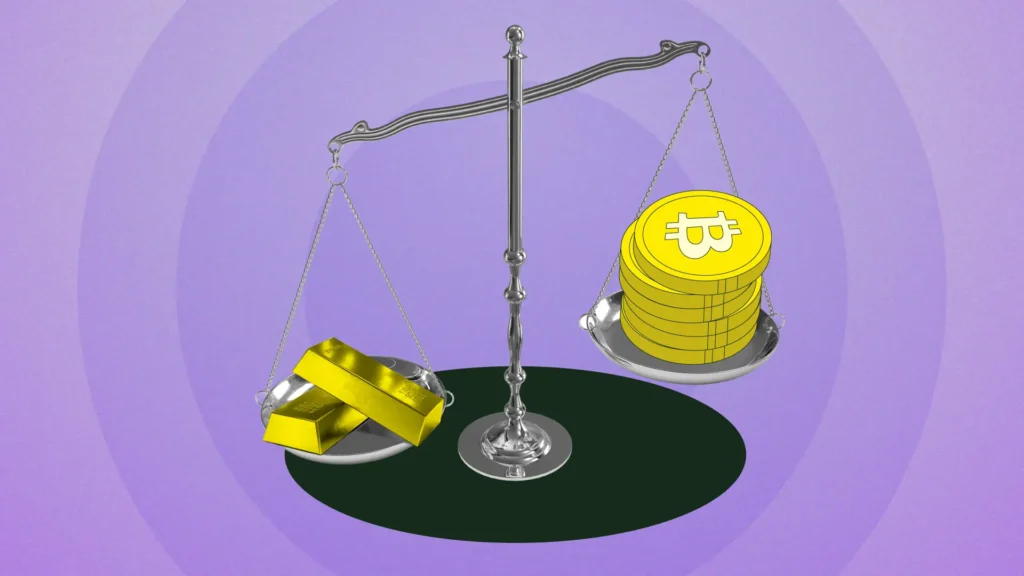
Is the Bitcoin price undervalued compared to gold? See what the BTC-to-gold ratio suggests about the next crypto market move and price trend. | Credit: Hameem Sarwar/CCN.com
Share
Key Takeaways
Gold and silver surged to new all-time highs as hawkish BoJ signals drove capital into hard assets.
Silver’s breakout signals a long-term repricing cycle, while gold eyes the $5,000 psychological milestone.
Bitcoin continues to lag below $90,000, with weakening structure suggesting another downside move.
As has been the case over the past few months, global markets have continued to split in two.
Traditional safe havens are exploding higher. Bitcoin (BTC) price, on the other hand, continues to lose altitude.
The divergence is clear and telling, leading to gold and silver prices rallying to new highs again.
At the time of writing, gold has surpassed $4,900, silver has climbed above $98, while Bitcoin continues to lag.
Interesting, this comes after the Bank of Japan (BoJ) kept its policy rate unchanged. Here is how it all happened and what lies ahead.
The move forced a fast rethink on Wall Street. Goldman Sachs responded by raising its year-end target to $5,400, citing accelerating central bank demand and diversification away from the U.S. dollar.
Silver is moving even faster. Prices briefly touched $98.79, outperforming gold on a percentage basis. Investors are treating silver as a leveraged play on energy security, electrification, and Arctic geopolitical risk.
Even as President Trump softened near-term tariff language, uncertainty around Arctic sovereignty and transatlantic relations continues to push investors toward tangible stores of value.
Amid this, economist Peter Schiff noted that he expects Bitcoin to continue to lag behind gold and silver.
According to Trump’s speech at the World Economic Forum in Davos, it played a role in the surge. As such, he expects buying pressure on the precious metals to continue.
“Gold is up over $90 today, trading above $4,920. Silver is up over $3, trading above $96.10. Of course, these are new record highs. Mining stocks are on fire. Trump’s Davos speech was the catalyst that lit it, along with the sell-off in the dollar, which is helping fuel the move,” Schiff posted on X.
But that’s not all.
Bank of Japan Presses Pause, but Stays Hawkish
The Bank of Japan added fuel to the move. It held rates steady at 0.75%, choosing patience after December’s surprise hike.
Governor Kazuo Ueda framed the decision as a data check on consumption and borrowing.
Still, the tone stayed hawkish. The BoJ upgraded its 2026 growth and inflation forecasts, and one board member voted for an immediate hike to 1.0%.
Markets heard the message clearly. Tightening is not over. It is merely delayed.
Interestingly, this decision lands just weeks before Japan’s Feb. 8 snap election, where inflation is now a central issue.
That backdrop keeps pressure on the yen and reinforces demand for hard assets globally.
Date of Change
New Interest Rate
Change
Jan. 23, 2026
0.75%
No Change (Hold)
Dec. 19, 2025
0.75%
+0.25%
Jan. 2025
0.50%
+0.25%
July 31, 2024
0.25%
+0.15%
March 19, 2024
0.10%
+0.20% (Ended Negative Rates)
2016 – Feb 2024
-0.10%
Long-term Negative Policy
Gold Technical Analysis
On the weekly chart, gold has accelerated into a fresh breakout, pushing toward $4,925 after cleanly clearing the $4,200 resistance.
For context, this zone has restricted the price action through much of the prior advance.
Therefore, the recent move confirms the continuation of the long-term uptrend, with price now trading at the upper boundary of its rising channel and holding well above all major Fibonacci retracement levels.
In addition, the Awesome Oscillator (AO) is expanding to new highs. Likewise, the Moving Average Convergence Divergence (MACD) continues to widen to the upside, signaling strong trend persistence rather than exhaustion.
With former resistance now acting as support, the structure points to further upside exploration, with the $5,000 psychological level in focus.
Pullbacks, if they occur, are likely to be shallow within an increasingly steep secular uptrend. However, if demand for gold declines, the metal will likely consolidate.
In a highly bearish scenario, it could experience a decline to $4,151.
Silver Technical Analysis
Looking at the monthly chart, silver has entered a historic breakout phase, surging to around $98 after clearing the long-term resistance bands near $30 and $35 that had capped the price for decades.
The move marks a structural regime shift, with silver exiting a multi-decade basing formation and accelerating vertically through every major Fibonacci level in quick succession.
The speed and scale of the rally suggest this is not a typical cyclical upswing but a repricing event, with price already well above the 0.786 retracement and approaching psychological triple-digit territory.
With no meaningful resistance until much higher levels, upside projections now point toward the $150 and $160 zone over the longer term, aligned with the 1.618 extension.
As long as silver holds above the former breakout zone, pullbacks are likely to be corrective within a newly established secular uptrend rather than signs of exhaustion.
However, if demand for silver drops, it might experience a notable correction alongside gold and Bitcoin. In that scenario, the price might decline to $78.97 per ounce.
Bitcoin Loses the “Digital Gold” Narrative — For Now
Bitcoin is telling a very different story. BTC trades near $89,600, stuck below the critical $90,000 level.
Notably, the flagship cryptocurrency’s structure has weakened.
Technically, analysts point to a negative divergence on the daily chart. As long as BTC stays capped below resistance, the path of least resistance points lower. A retest of $74,000 now looks more likely than a clean run to $100,000.
Institutional flows confirm the shift. Gold ETFs are pulling in capital at a record pace.
Spot Bitcoin ETFs, meanwhile, have flipped to net outflows this week. This implies that institutions are hedging geopolitical risk with metal, not crypto.
Following this move, pseudonymous crypto analyst Rekt Capital opined that this year could be a bear phase for BTC.
“It’s 2026 The second year in the current #BTC Four Year Cycle has begun History suggests 2025 was the year of the $BTC Bull Market peak 2026 should be the year of the Bitcoin Bear Market And 2027 will be the Bottoming Out year to precede an entirely brand new future Bull Market,” The analyst stated.
At the time of writing, the price trades around $89,000.
According to CCN’s findings, the sharp sell-off from the October highs has transitioned into a clear bear flag, defined by a rising consolidation channel that has formed after the impulsive breakdown.
The structure suggests this bounce is corrective rather than the start of a new uptrend.
As it stands, BTC’s price continues to hold below the 0.382 Fibonacci level and the Supertrend. Meanwhile, momentum indicators remain weak, reinforcing the risk of continuation lower if the flag breaks down.
A loss of the $86,811 support area would likely open the door toward deeper retracements. If that happens, Bitcoin’s price might fail to keep pace with the rally in gold and silver.
In that scenario, it could decline to $74.644. On the contrary, only a sustained reclaim of $94,339 would invalidate the bearish setup and shift the near-term outlook back toward neutral.
Disclaimer:
The information provided in this article is for informational purposes only. It is not intended to be, nor should it be construed as, financial advice. We do not make any warranties regarding the completeness, reliability, or accuracy of this information. All investments involve risk, and past performance does not guarantee future results. We recommend consulting a financial advisor before making any investment decisions.
Victor Olanrewaju is a crypto analyst and reporter at CCN with deep roots in on-chain research and technical analysis. His crypto journey began in 2017, but it was the 2020 Uniswap airdrop that sparked a full-time pivot into the space.
With a foundation in copywriting, Victor honed his craft creating high-converting content for leading crypto brokers — most notably an XRP price prediction that ranked #1 on Google during the 2021 bull run.
He later joined AMBCrypto in 2022, where he combined storytelling with technical and on-chain analysis to cover key market narratives.
In 2024, he expanded his expertise at BeInCrypto, collaborating with analysts and using tools like Glassnode, Santiment, and IntoTheBlock to break down Bitcoin and altcoin trends.
At CCN, Victor covers the top cryptocurrencies, memecoins, macro shifts, blending real-time insights with deep-dive metrics.
He holds a Bachelor’s degree in Physics from the University of Ibadan, equipping him to simplify complex data for a wide audience. Follow his work or connect on LinkedIn or X.