Meet the Top 101 in Crypto

Hedera (HBAR) Price Falls Through 380-Day Support— Charts Signal More Pain Ahead

Published 18 December 2025
Valdrin Tahiri
Authors
Edited by Insha Zia

Key Takeaways

  • Hedera (HBAR) remains within a long-term descending triangle.
  • The HBAR price broke down from a 380-day horizontal support zone.
  • The breakdown could lead to HBAR’s sharpest decline this cycle.

Hedera has broken down from its most important support level.

After holding the same support level for more than a year, HBAR finally closed below it amid growing downside pressure.

Unless buyers step in soon, the next move could be violent.

So why is HBAR going down, and what does the current structure suggest about where price could head next?

Hedera Price Analysis

On the weekly chart, HBAR has remained capped below a descending resistance trendline since December 2024.

That trend line delivered another rejection in July, accelerating the decline and pushing the price back toward its most crucial horizontal level.

Get These Top Crypto Casino Offers Now!
Sponsored
Disclosure
Opened in 2023
Promotions
200% deposit bonus up to 20,000 USDT + up to 100 FS (promo code: CG100)
Coins
Tether Bitcoin Ethereum USD Coin TRON +7
Opened in 2021
Promotions
Casino No Wagering 100 Free Spins
Coins
Bitcoin Tether USD Coin Ethereum Solana +11
Opened in 2018
Promotions
500% Welcome Bonus up to $90,000 + 100 Free Spins
Coins
Bitcoin Ethereum Litecoin Tether Dogecoin +3
Show More

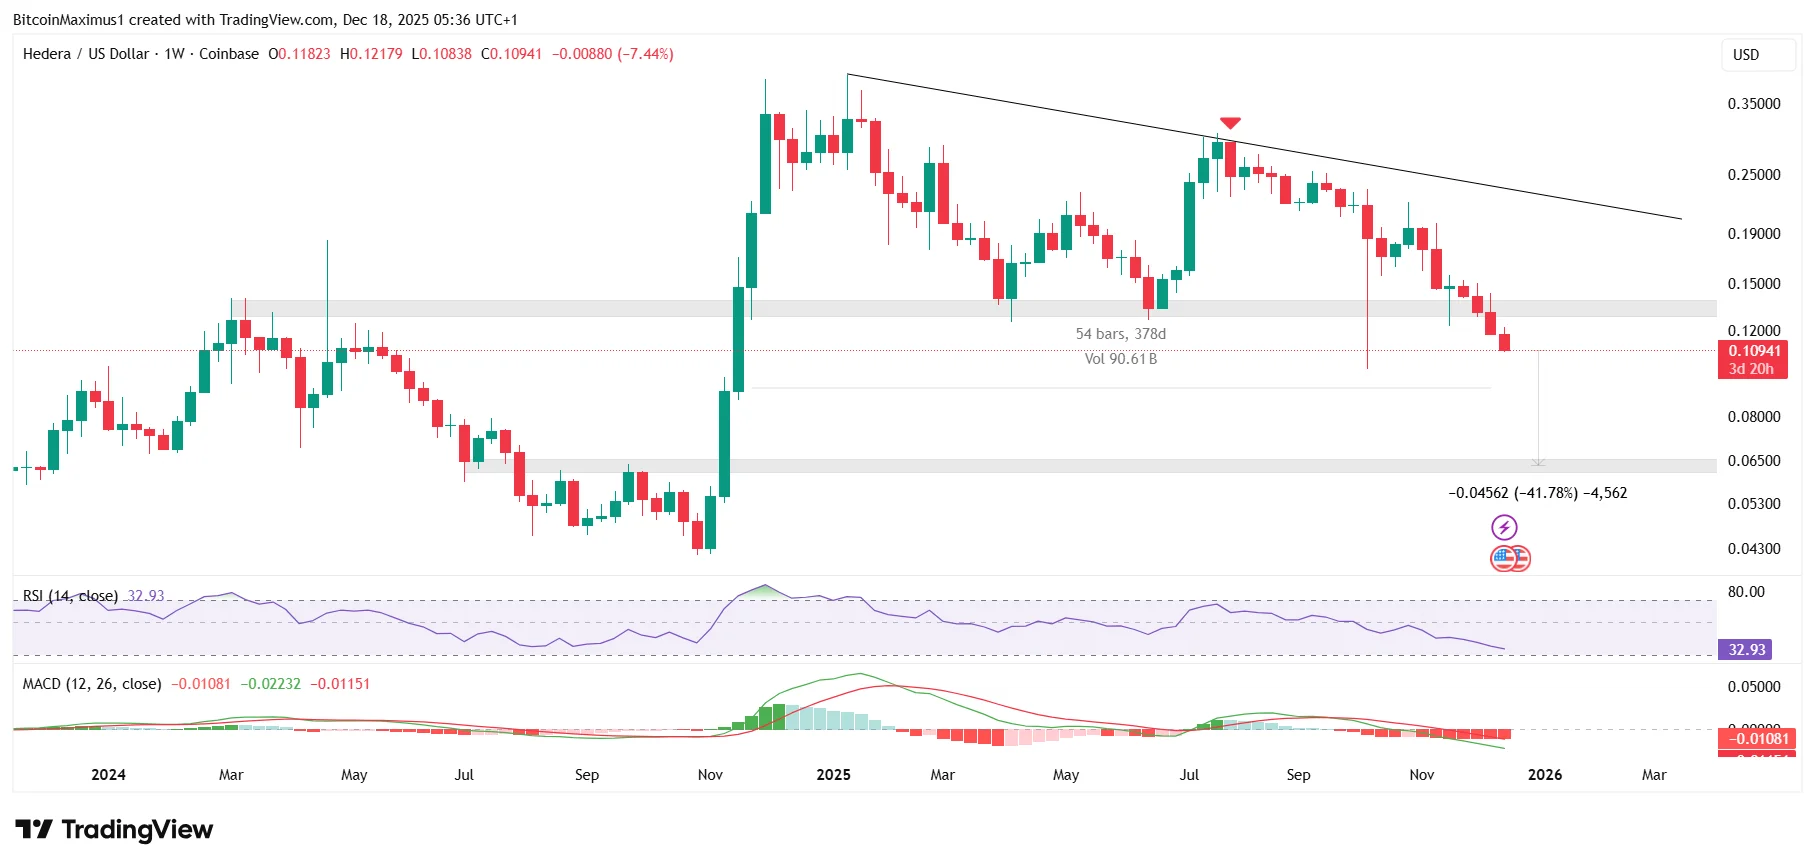
After an initial bounce, the HBAR price broke down from the $0.135 support zone, a level that has repeatedly prevented deeper losses for over a year.

Because this area has held for so long, the breakdown marks a decisive shift in the long-term trend and strongly increases the odds of new lows.

Momentum readings reinforce the bearish outlook.

  • The Relative Strength Index remains below 50, signaling weak demand.
  • The Moving Average Convergence Divergence is firmly negative, confirming downside momentum.
HBAR Weekly
HBAR Weekly Chart | Credit: Valdrin Tahiri/TradingView

Taken together, the technical picture suggests that a downward movement is the path of least resistance.

If that support gives way, the next major target sits near $0.065, implying a downside of roughly 50%.

Will HBAR Keep Going Down?

Elliott Wave structure adds further weight to the bearish case.

According to the wave count, HBAR’s price has started the fifth and final wave of its decline.

Wave four formed a symmetrical triangle, which is the most common corrective pattern at this stage.

HBAR Daily
HBAR Daily Chart | Credit: Valdrin Tahiri/TradingView

Using a 1.61 external Fibonacci projection from the triangle, the next downside target comes in near $0.102.

Then, the HBAR price could possibly bounce, hitting the $0.135 area and confirming it as resistance.

Afterward, the downward movement could continue.

Breakdown Will Deepen

HBAR’s price broke down from the most important level of its entire structure.

A multi-month support zone has failed, momentum indicators remain bearish, and the wave structure suggests an unfinished downside.

Unless buyers manage to reclaim and hold above $0.135 quickly, the risk strongly favors a continuation of the lower trend.

In that scenario, a move toward $0.10 and potentially $0.065 becomes increasingly likely in the weeks ahead.

Disclaimer: The information provided in this article is for informational purposes only. It is not intended to be, nor should it be construed as, financial advice. We do not make any warranties regarding the completeness, reliability, or accuracy of this information. All investments involve risk, and past performance does not guarantee future results. We recommend consulting a financial advisor before making any investment decisions.
Valdrin Tahiri

Valdrin Tahiri is a cryptocurrency analyst and reporter at CCN, specializing in technical analysis with a focus on Elliott Wave theory, on-chain metrics, and fundamental research. He brings over seven years of experience in the crypto space as both a trader and writer.

He discovered cryptocurrencies in 2017 while earning his MSc in Financial Markets at the Barcelona School of Economics, which sparked a deep interest in blockchain and market dynamics. Since then, he’s contributed to top crypto outlets like BeInCrypto and CoinGape.

Valdrin also served as Community Manager of BeInCrypto’s Telegram group for three years, helping grow it into one of the largest crypto communities worldwide. His expertise in market structure and price patterns allows him to break down complex trends into clear, actionable insights.

He’s published thousands of articles covering altcoins, Bitcoin cycles, and macro trends.

Related

Survey Icon
Help us improve
1 of 4
Is this your first time here?
What brought you here today?
What are you most interested in?
Would you be interested in:
Thank you icon
Thank you for your feedback!
DMCA.com Protection Status