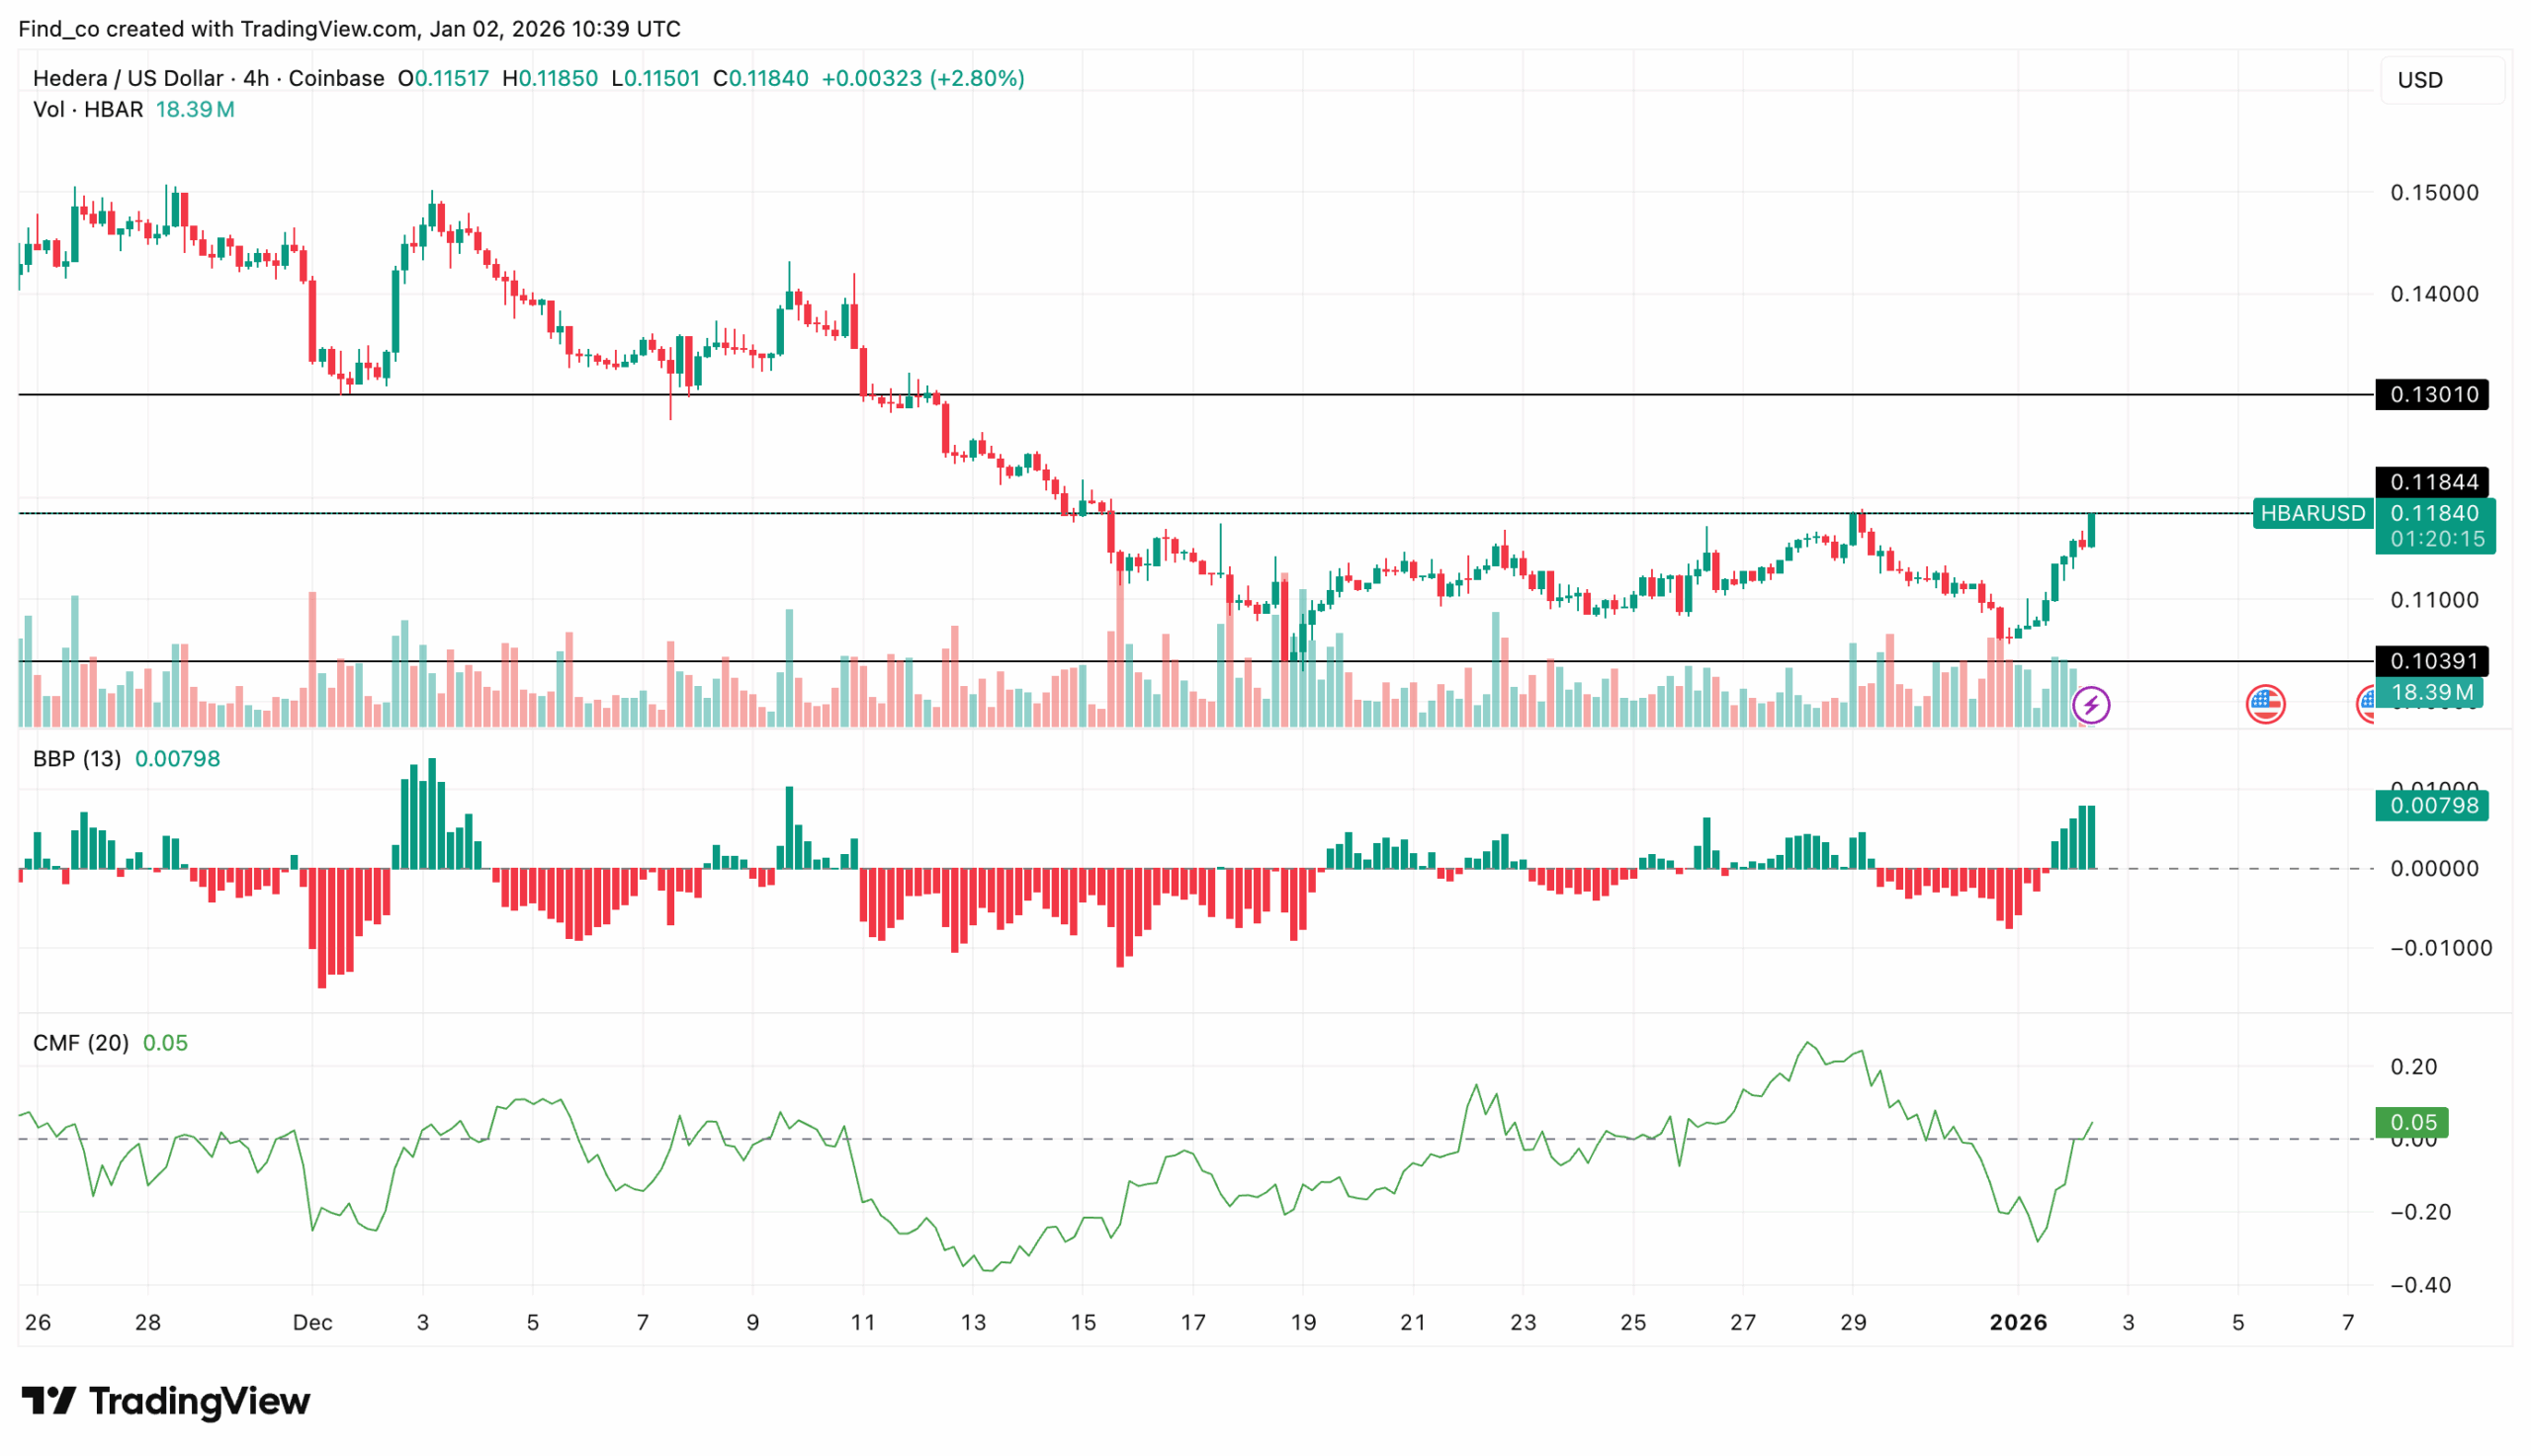
Distribution is slowing and capital is returning to HBAR | Credit: TradingView
Share
Key Takeaways
HBAR has established support at $0.10, easing immediate downward pressure.
Both the BBP and Awesome Oscillator are signaling a shift in favor of HBAR buyers.
A break above $0.14 is required to confirm a sustained recovery in the Hedera price.
Hedera (HBAR) has started 2026 with a bounce above the $0.10 support zone.
This area has repeatedly acted as a critical demand floor during recent market weakness. The rebound has eased immediate downside pressure and shifted sentiment toward optimism.
Still, the broader structure remains unresolved, leaving traders to watch closely for the next decisive move.
HBAR’s price is now approaching a well-defined resistance band.
Furthermore, the next move will be pivotal in determining whether HBAR’s price can transition from stabilization into a sustained recovery.
Does HBAR’s price have the strength to break this zone? Let’s check the charts.
HBAR Eyes Key Resistance
On the 4-hour chart, the Bull Bear Power (BBP) signals a bullish crossover.
As shown below, the histogram bars have flipped positive and are expanding, indicating a growing imbalance in favor of buyers.
We sometimes use affiliate links in our content, when clicking on those we might receive a commission at no extra cost to you. By using this website you agree to our terms and conditions and privacy policy.
This also indicates that bulls are regaining short-term control following the recent dip, providing the market with a potential springboard for further upside.
The Chaikin Money Flow (CMF) supports this narrative of stabilization. Furthermore, the CMF is hovering around the zero line, indicating neutral to slightly positive capital flows.
While not yet signaling accumulation, the indicator shows that distribution has slowed and incremental inflows are returning. Historically, this serves as a prerequisite for a breakout attempt.
The gradual improvement in capital movement signals that buyers are cautiously re-entering, testing the market’s resilience as they gauge strength ahead of the next challenge.
Currently, HBAR’s price is trading above the $0.10 support band, with resistance clustered near the $0.12 zone.
This level has capped upside attempts multiple times.
It remains the key barrier that bulls must reclaim to unlock further gains, meaning every move within this range carries heightened significance for the near-term price direction.
Meanwhile, the Money Flow Index (MFI) suggests improving capital inflows. This indicates that buying pressure is gradually building rather than fading, and offering early signs that accumulation may be underway.
Similarly, the Awesome Oscillator (AO) has printed multiple green histogram bars while still in negative territory, signaling early signs of recovery in capital inflows rather than full confirmation of bullishness.
This setup indicates that buyers are stepping back in, even as broader sentiment remains fragile, reminding traders that momentum is improving but not yet fully validated.
However, as long as the indicator stays below the neutral threshold, the risk of rejection at resistance remains elevated.
If this remains the same, HBAR’s price will likely maintain a balanced outlook between optimism and caution.
The Fibonacci retracement levels show HBAR’s price action. Trading at $0.12, HBAR is trending toward its key resistance zone at $0.14, which aligns with the 0.236 Fib level.
Disclaimer:
The information provided in this article is for informational purposes only. It is not intended to be, nor should it be construed as, financial advice. We do not make any warranties regarding the completeness, reliability, or accuracy of this information. All investments involve risk, and past performance does not guarantee future results. We recommend consulting a financial advisor before making any investment decisions.
Victor Olanrewaju is a crypto analyst and reporter at CCN with deep roots in on-chain research and technical analysis. His crypto journey began in 2017, but it was the 2020 Uniswap airdrop that sparked a full-time pivot into the space.
With a foundation in copywriting, Victor honed his craft creating high-converting content for leading crypto brokers — most notably an XRP price prediction that ranked #1 on Google during the 2021 bull run.
He later joined AMBCrypto in 2022, where he combined storytelling with technical and on-chain analysis to cover key market narratives.
In 2024, he expanded his expertise at BeInCrypto, collaborating with analysts and using tools like Glassnode, Santiment, and IntoTheBlock to break down Bitcoin and altcoin trends.
At CCN, Victor covers the top cryptocurrencies, memecoins, macro shifts, blending real-time insights with deep-dive metrics.
He holds a Bachelor’s degree in Physics from the University of Ibadan, equipping him to simplify complex data for a wide audience. Follow his work or connect on LinkedIn or X.