How Will Gold and Silver Perform If Global Markets Crash? | Credit: Derek Fenech
Share
Key Takeaways
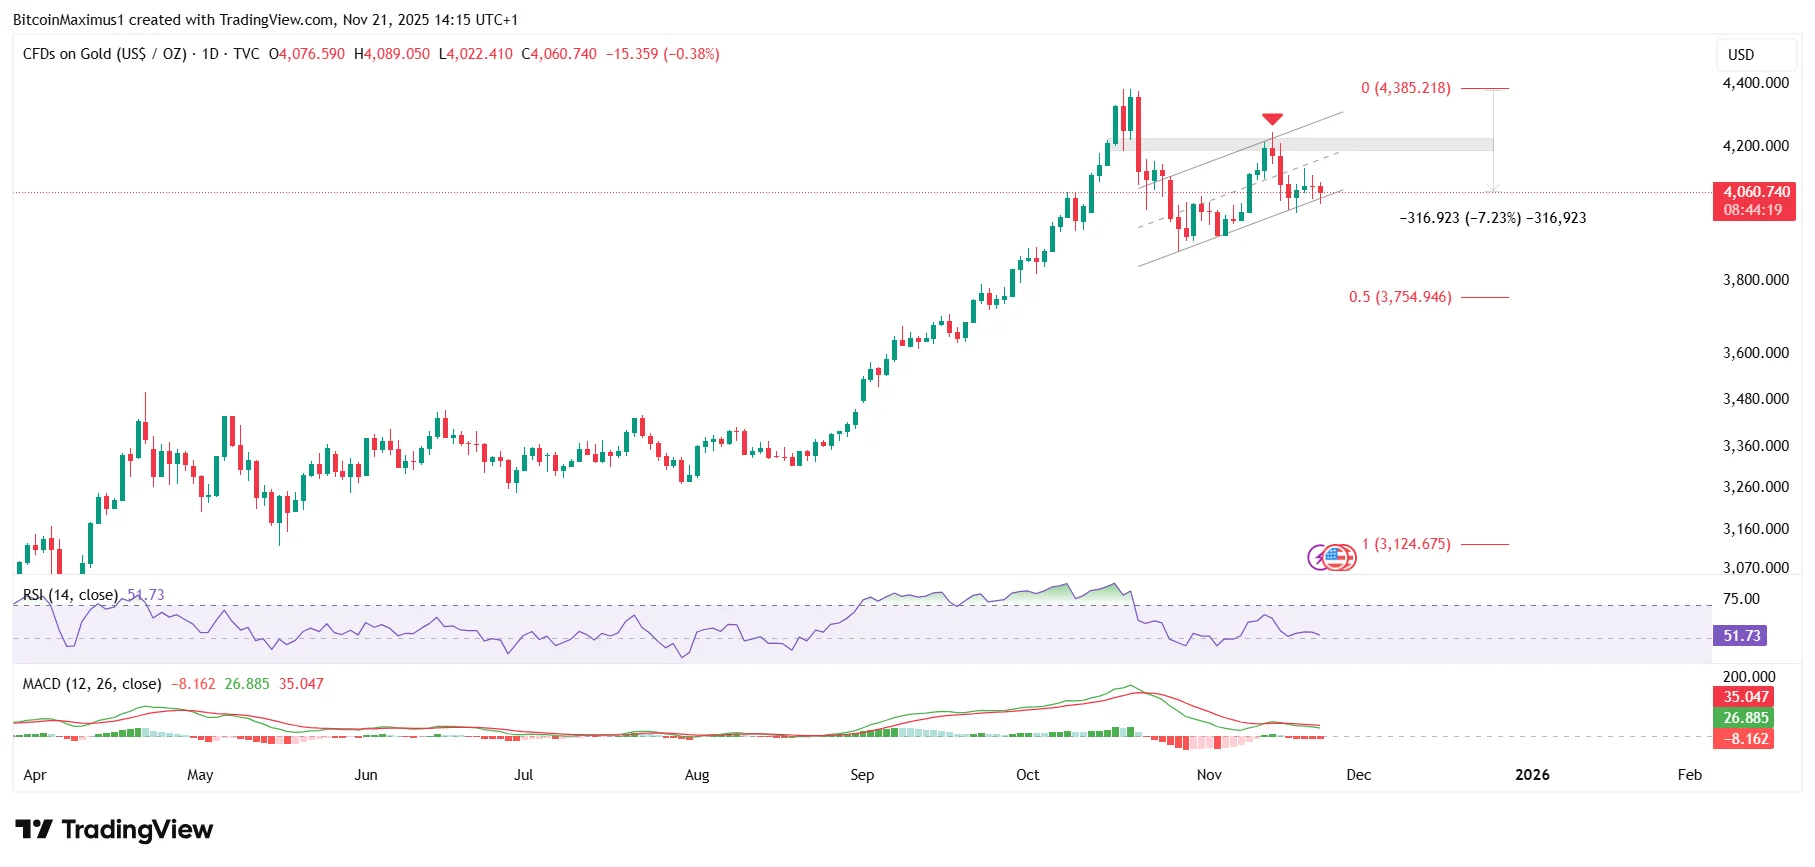
Gold’s price has dropped by nearly 7% since its all-time high on October 20.
Silver has crashed by slightly more than that, falling 10% since the all-time high.
With global markets preparing for a crash, will gold and silver decline or act as a hedge?
Gold is plummeting rapidly, and traders are scrambling to understand the reasons behind this sudden decline.
After hitting an all-time high in October, gold has reversed sharply, losing momentum as key indicators roll over and fear builds across global markets.
Silver is falling even harder, and with macro pressure rising, investors are asking the same urgent question: why is gold going down now, and will it get worse if markets crash?
Why is the Gold Price Going Down
Gold’s price has lost momentum since its all-time high of $4,380 on October 17, decreasing by 7% so far.
While gold bounced on October 28, temporarily halting the decline, it resumed another decline last week, which is still ongoing.
Get These Top Crypto Casino Offers Now!
Sponsored
Disclosure
We sometimes use affiliate links in our content, when clicking on those we might receive a commission at no extra cost to you. By using this website you agree to our terms and conditions and privacy policy.
Nowhere was this more apparent than during last month, when retail flocked to buy gold, creating long queues.
That almost perfectly marked the top of this cycle and triggered the ongoing collapse.
Pressure from Silver only added fuel to the drop, since once its price started catching up to Gold, previous bulls began to jump on it as an alternative to quicker gains.
The wave count also reveals something far more serious, in the form of an A-B-C correction.
If the wave count plays out, Silver will likely sink soon, spiraling downward as soon as it breaks below the trend line.
Possible Global Market Crash?
Several analysts are warning of a potential global market crash, caused by several factors, the most prominent being the increasing Japanese Bond Yield rate and the possible Artificial Intelligence (AI) bubble.
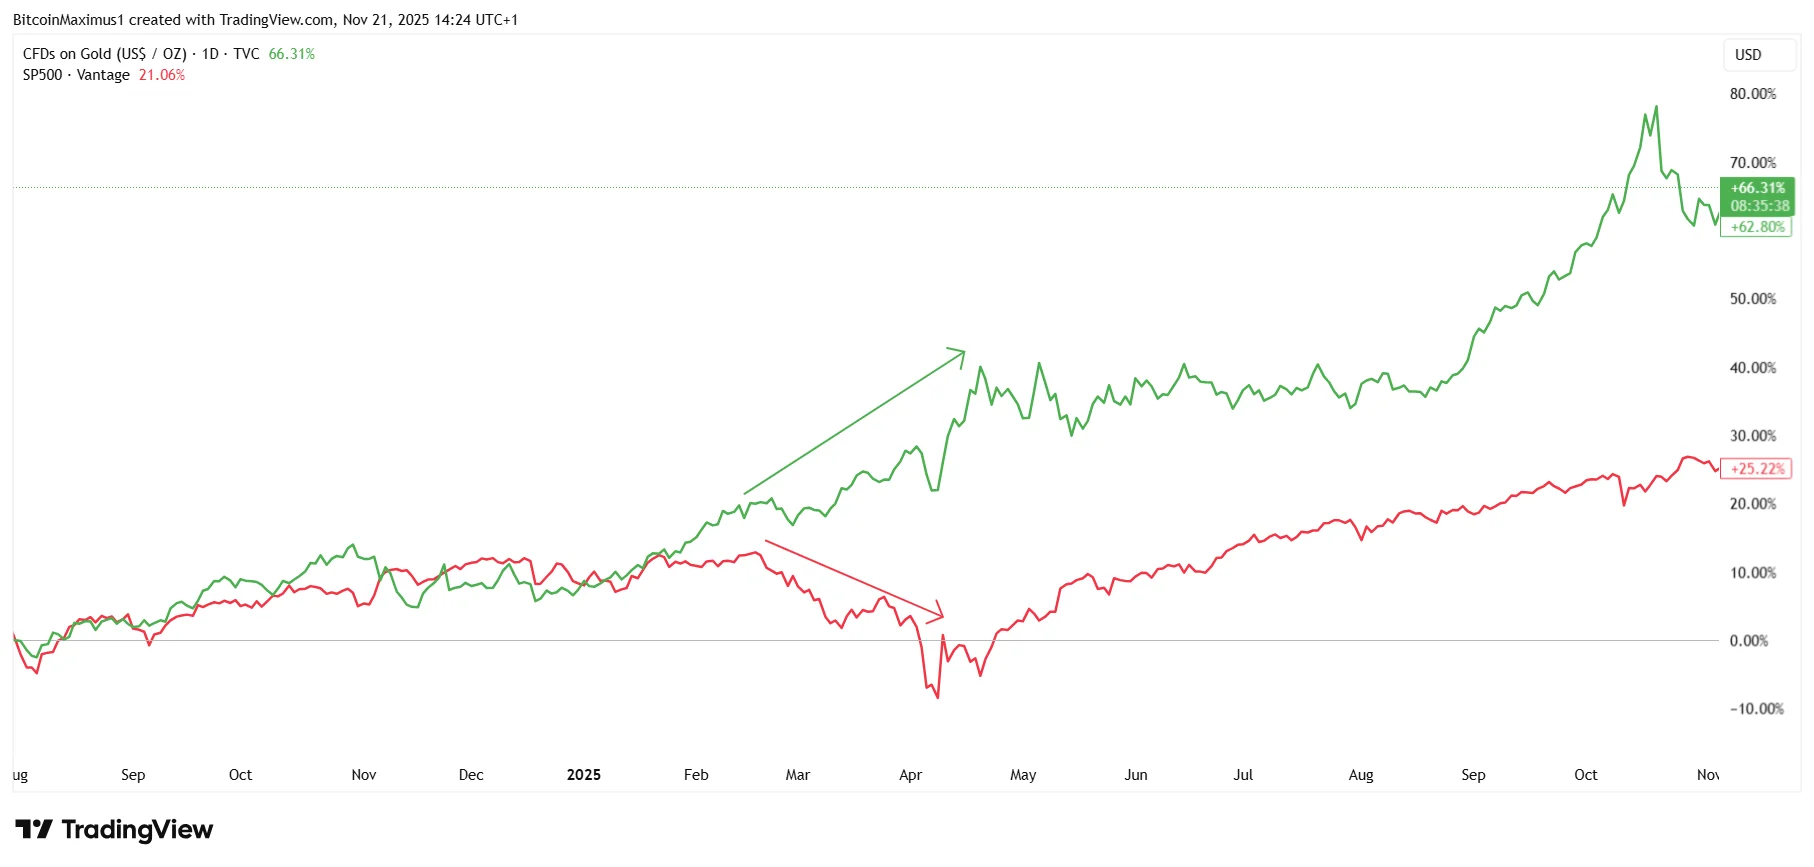
If this happens, gold may act in one or two ways. This year, the gold price has been positively correlated to the S&P 500, meaning they have moved in the same direction.
However, this was not the case at the start of 2025, when the Stock market crash led to the gold price pumping and triggered the ongoing upward movement.
So the big question remains: will gold hedge against a global crash again, or fall alongside risk assets?
Why Gold Is Still Going Down
Gold is declining because momentum has shifted bearish, technical patterns are breaking down, and macroeconomic forces are exerting increasing pressure each week.
Silver’s weakness only adds fuel to the decline, and retail euphoria at the top confirmed that the rally overheated.
With global markets flashing warning signs again, gold could either become a hedge or start its subsequent decline.
Disclaimer:
The information provided in this article is for informational purposes only. It is not intended to be, nor should it be construed as, financial advice. We do not make any warranties regarding the completeness, reliability, or accuracy of this information. All investments involve risk, and past performance does not guarantee future results. We recommend consulting a financial advisor before making any investment decisions.
Valdrin Tahiri is a cryptocurrency analyst and reporter at CCN, specializing in technical analysis with a focus on Elliott Wave theory, on-chain metrics, and fundamental research. He brings over seven years of experience in the crypto space as both a trader and writer.
He discovered cryptocurrencies in 2017 while earning his MSc in Financial Markets at the Barcelona School of Economics, which sparked a deep interest in blockchain and market dynamics. Since then, he’s contributed to top crypto outlets like BeInCrypto and CoinGape.
Valdrin also served as Community Manager of BeInCrypto’s Telegram group for three years, helping grow it into one of the largest crypto communities worldwide. His expertise in market structure and price patterns allows him to break down complex trends into clear, actionable insights.
He’s published thousands of articles covering altcoins, Bitcoin cycles, and macro trends.