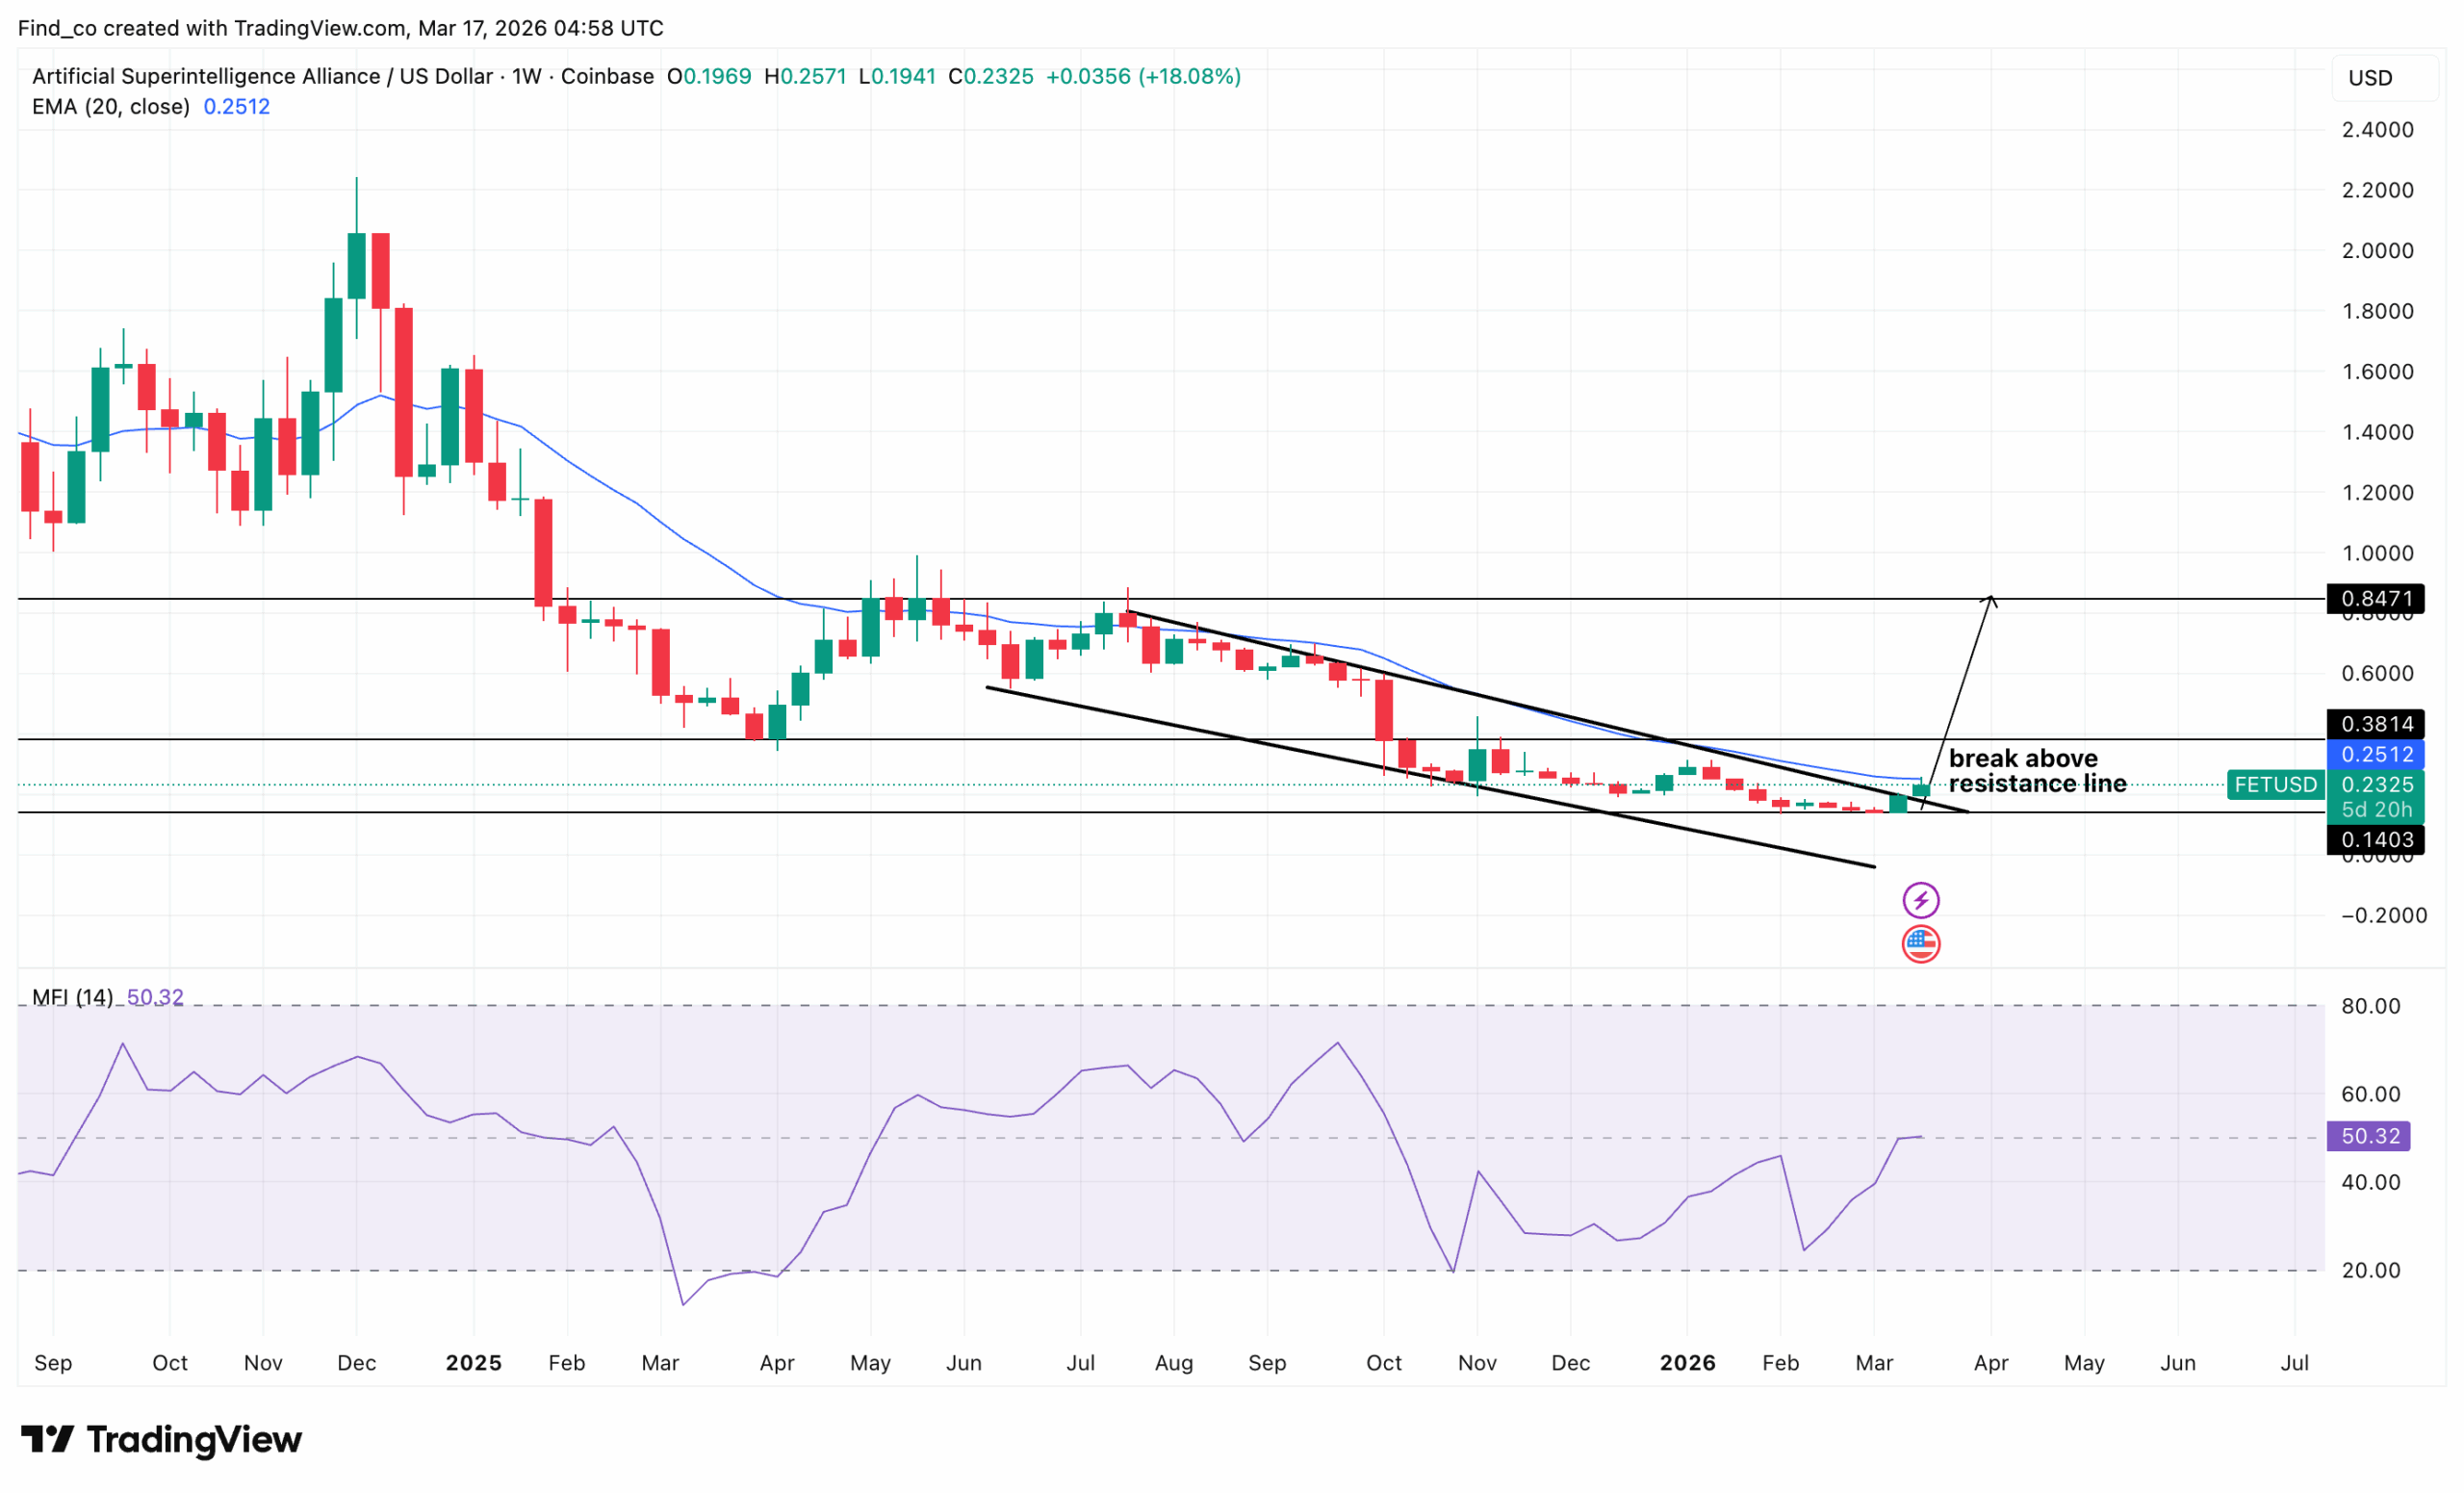
Since October 2025, FET’s price has been compressed inside a descending wedge, grinding lower from $0.85 toward $0.14. That wedge has now cracked.
This week’s candle broke above the resistance line that has capped every rally attempt for about eight months.
Equally important, the 20-EMA at $0.2512 is directly overhead. Should the FET crypto register a weekly close above it, it would mark the first EMA reclaim since mid-2025.
Meanwhile, the MFI at 50.32 is rising from oversold lows near 20 recorded just weeks ago. There’s no overbought ceiling in sight on the weekly timeframe, which means momentum can build without immediate resistance.
To start with, FET’s price might climb to $0.38 in the short term. However, in the long run, the chart annotates a target at $0.85 (the prior horizontal resistance level from 2025) as the mid-term target.
What Else Drove the Surge?
Meanwhile, outside the technical setup, the NVIDIA GTC 2026 also seems to be playing a part in the FET crypto rally.
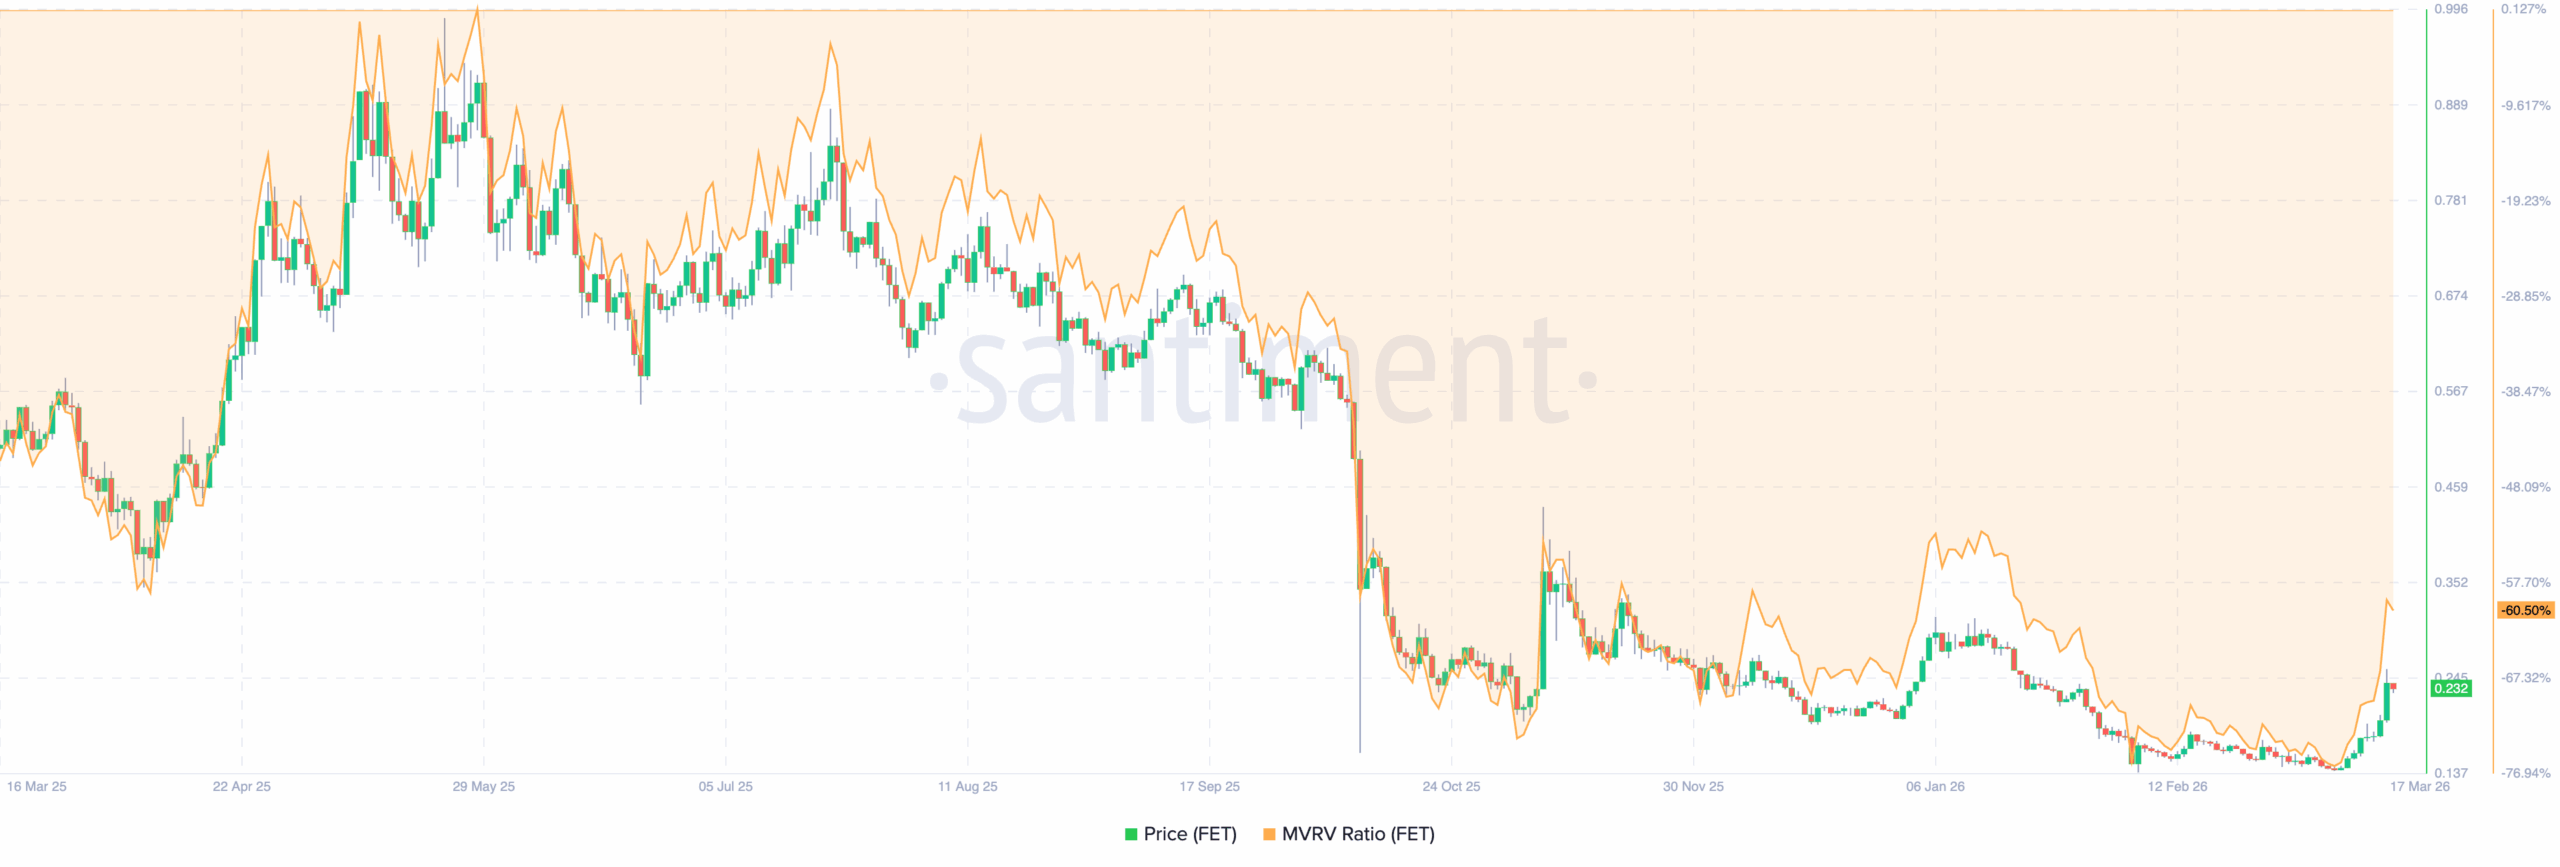
From an on-chain perspective, the Market Value to Realized Value (MVRV) ratio currently sits at -60.50%.
That means the average FET holder is sitting on an unrealised loss of more than 60 cents for every dollar invested.
To put that in context: when FET was trading near its highs above $0.99 in April–May 2025, the MVRV was persistently positive — holders were in profit, and that profit was available to sell.
Here’s why that matters right now. At -60.50%, the average seller has already sold.
Furthermore, the MVRV turning from deeply negative back toward zero is a mechanical process. As the price recovers, unrealized losses shrink.
Historically, when FET’s MVRV has bounced from extreme negative territory, as seen briefly in October 2025. So, as it stands, FET’s price will likely continue to recover.
Furthermore, the recent 56% weekly candle and the wedge breakout are the beginning of that MVRV mean reversion.
At current prices, recovering to zero MVRV would require FET to roughly reach $0.62. If sustained, this could act as a launchpad toward $1.
FET Price Prediction: Higher Highs Likely
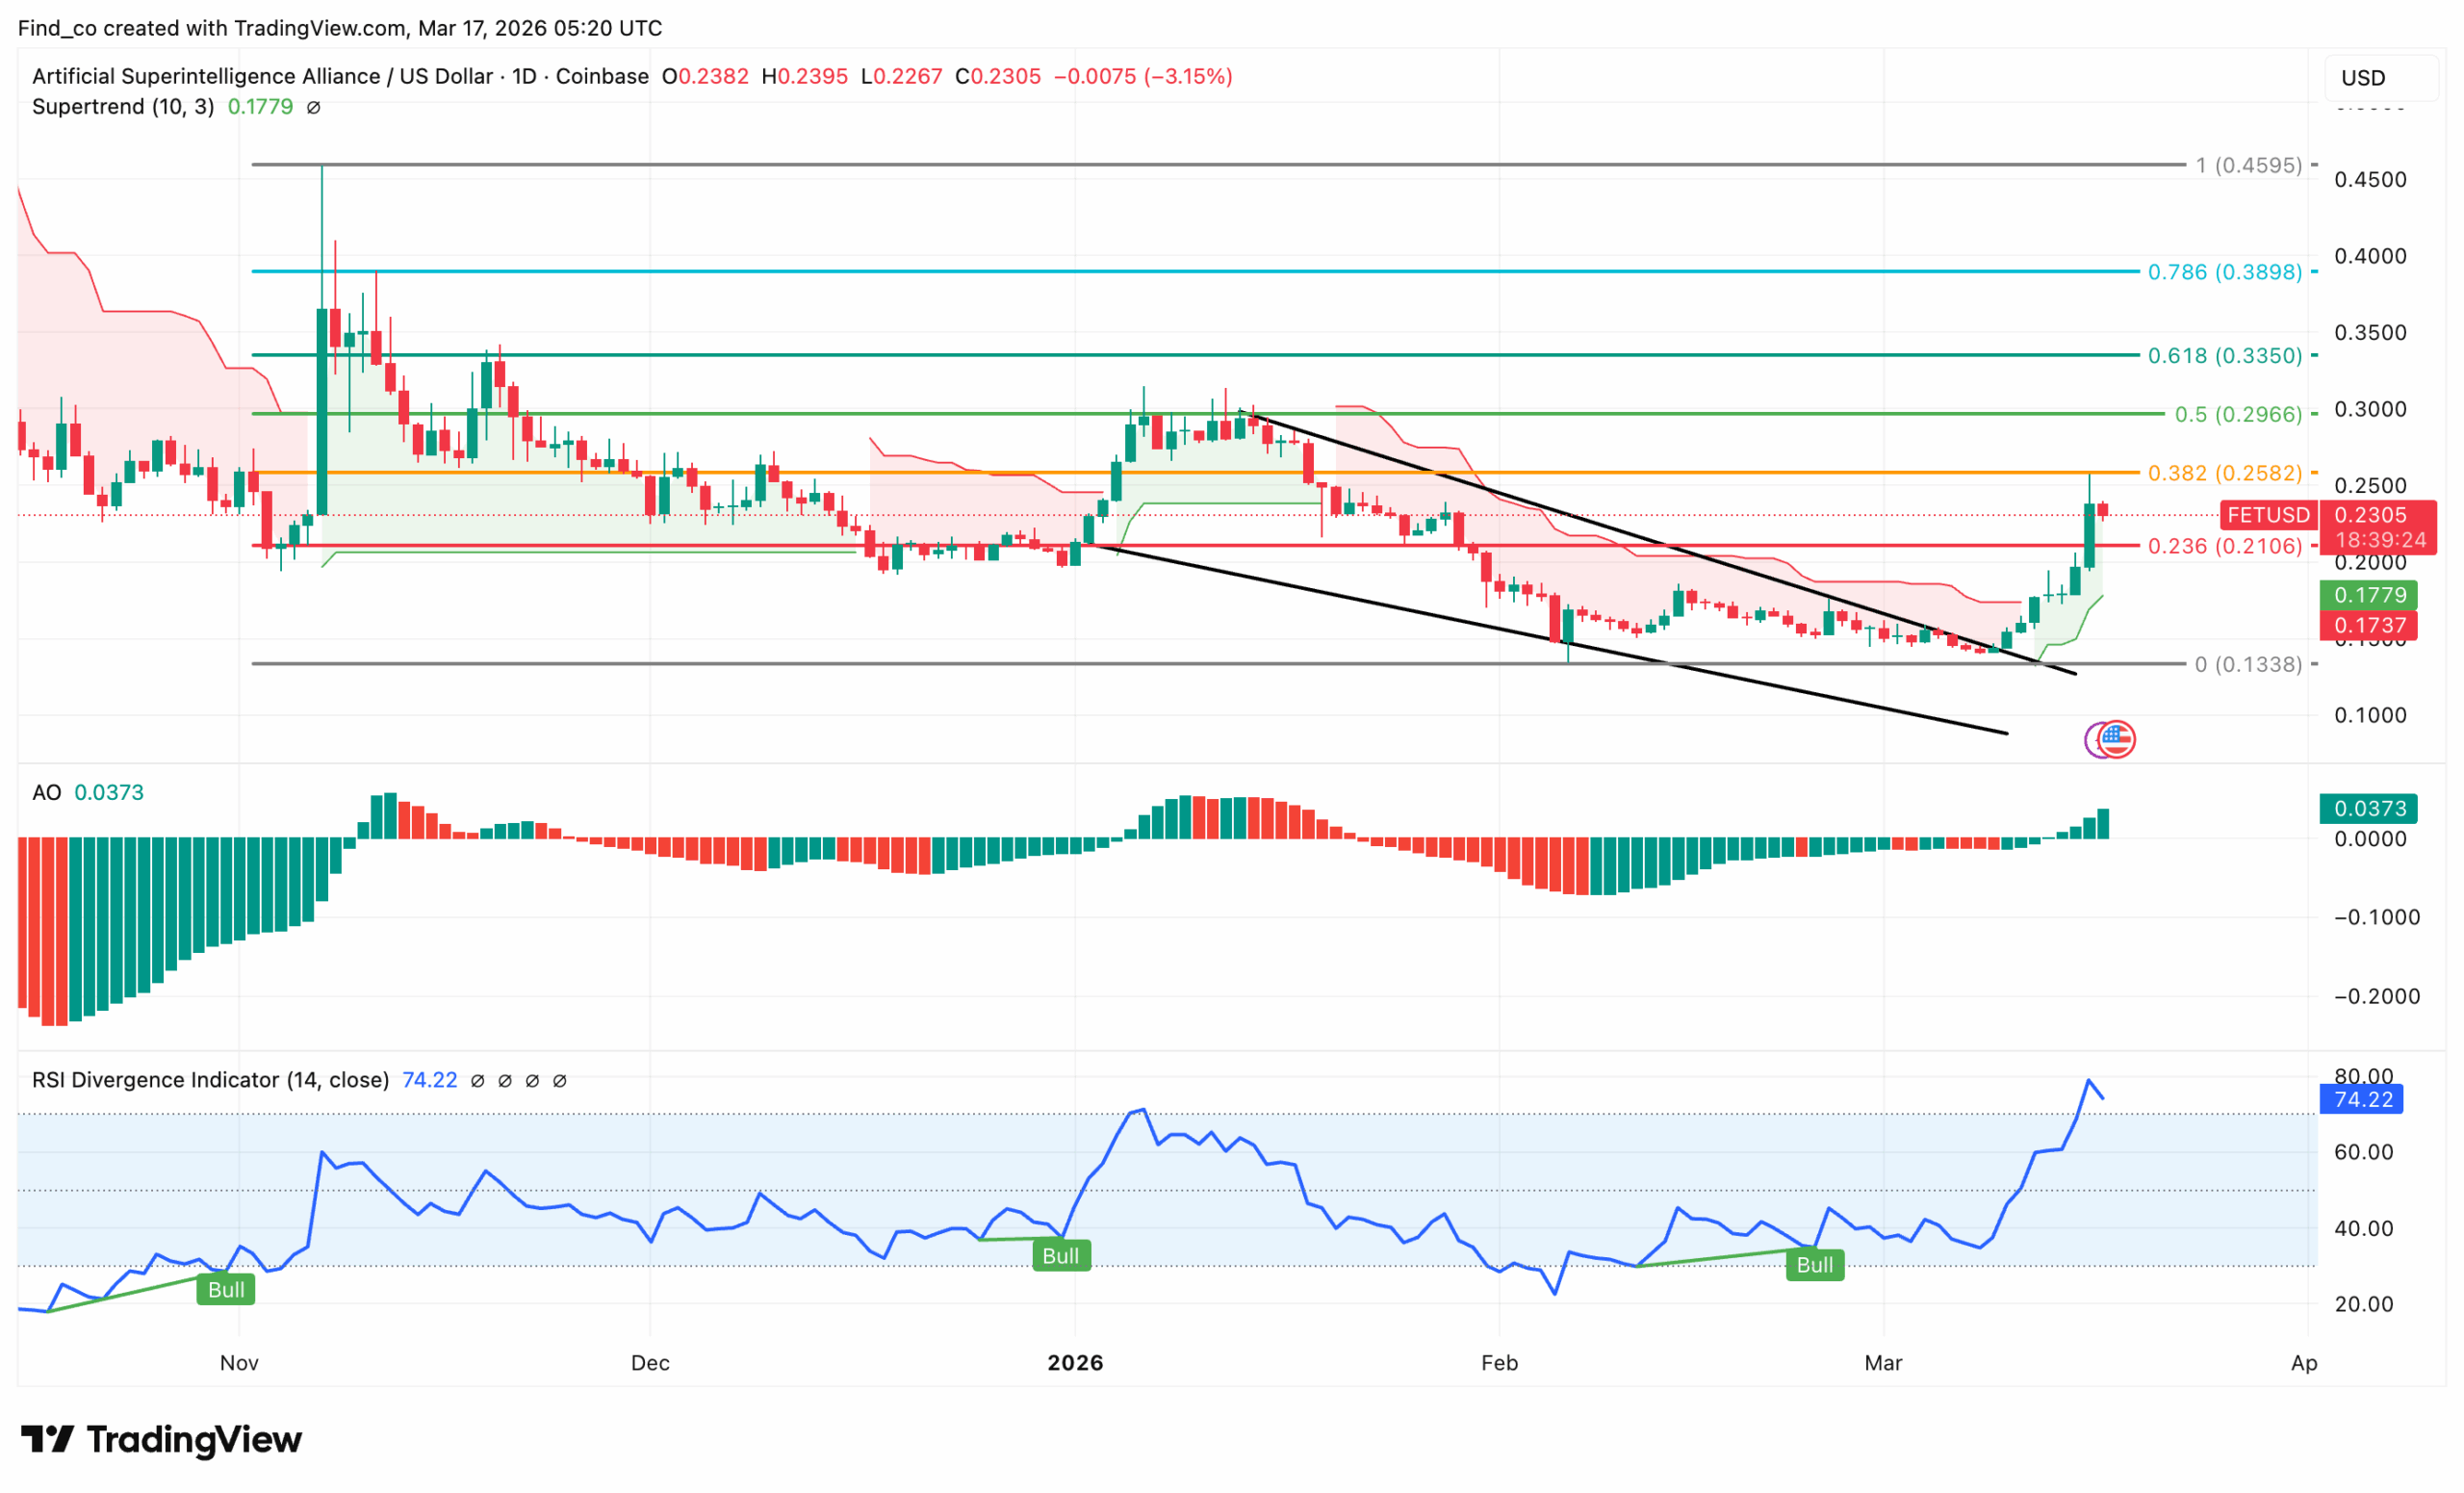
Examining the daily chart, CCN noticed that it fills in every detail that the weekly chart left out.
At the time of writing, FET trades at $0.23. On the same timeframe, two RSI Bull divergence signals have now printed on this chart.
The first was fired in October 2025. The second was printed just weeks ago at the February lows.
Both preceded meaningful recoveries. Moreover, the RSI Divergence Indicator has now surged to 74.22 — its highest reading since mid-2025, confirming that momentum has shifted in favour of buyers.
Meanwhile, the Awesome Oscillator (AO) has crossed above zero for the first time since August.
That crossing, combined with building green bars, signals that short-term momentum has aligned with the longer-term trend for the first time in seven months.
Disclaimer:
The information provided in this article is for informational purposes only. It is not intended to be, nor should it be construed as, financial advice. We do not make any warranties regarding the completeness, reliability, or accuracy of this information. All investments involve risk, and past performance does not guarantee future results. We recommend consulting a financial advisor before making any investment decisions.
Victor Olanrewaju is a crypto analyst and reporter at CCN with deep roots in on-chain research and technical analysis. His crypto journey began in 2017, but it was the 2020 Uniswap airdrop that sparked a full-time pivot into the space.
With a foundation in copywriting, Victor honed his craft creating high-converting content for leading crypto brokers — most notably an XRP price prediction that ranked #1 on Google during the 2021 bull run.
He later joined AMBCrypto in 2022, where he combined storytelling with technical and on-chain analysis to cover key market narratives.
In 2024, he expanded his expertise at BeInCrypto, collaborating with analysts and using tools like Glassnode, Santiment, and IntoTheBlock to break down Bitcoin and altcoin trends.
At CCN, Victor covers the top cryptocurrencies, memecoins, macro shifts, blending real-time insights with deep-dive metrics.
He holds a Bachelor’s degree in Physics from the University of Ibadan, equipping him to simplify complex data for a wide audience. Follow his work or connect on LinkedIn or X.