Let’s look at the FTN price predictions made by CCN on April 7, 2025. It is important to remember that price predictions can often be wrong, especially for something as potentially volatile as cryptocurrency.
Our Fasttoken price predictions use the wave count method. Then, we will add and remove 20% from the final targets to create the minimum and maximum FTN price predictions.
Minimum FTN Price Prediction
Average FTN Price Prediction
Maximum FTN Price Prediction
2025
$2.16
$2.70
$3.24
2026
$2.64
$3.30
$3.96
2030
$5.60
$6.80
$8
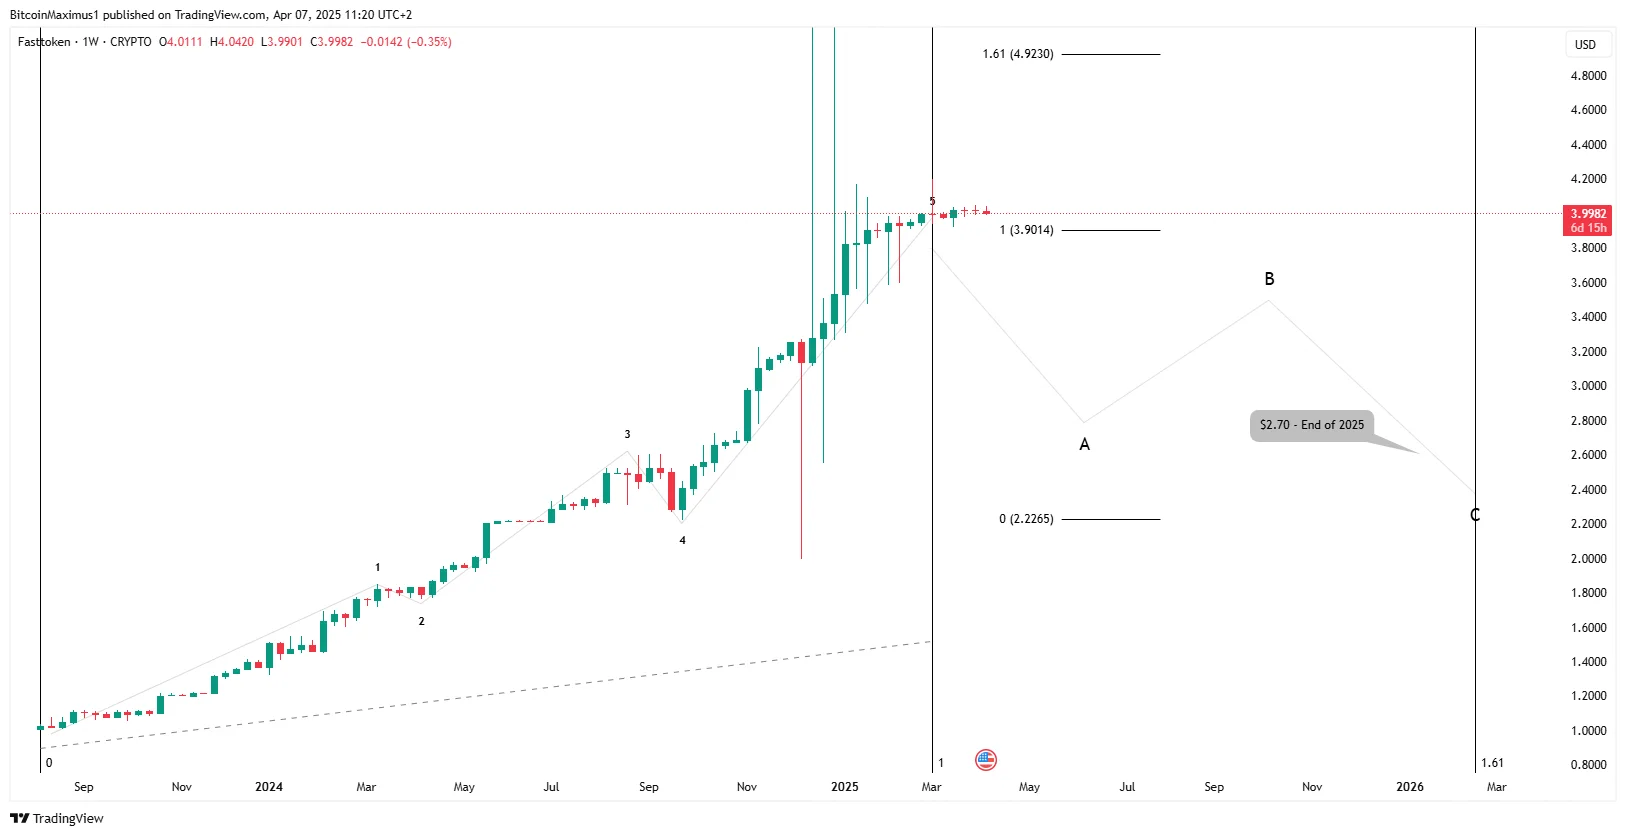
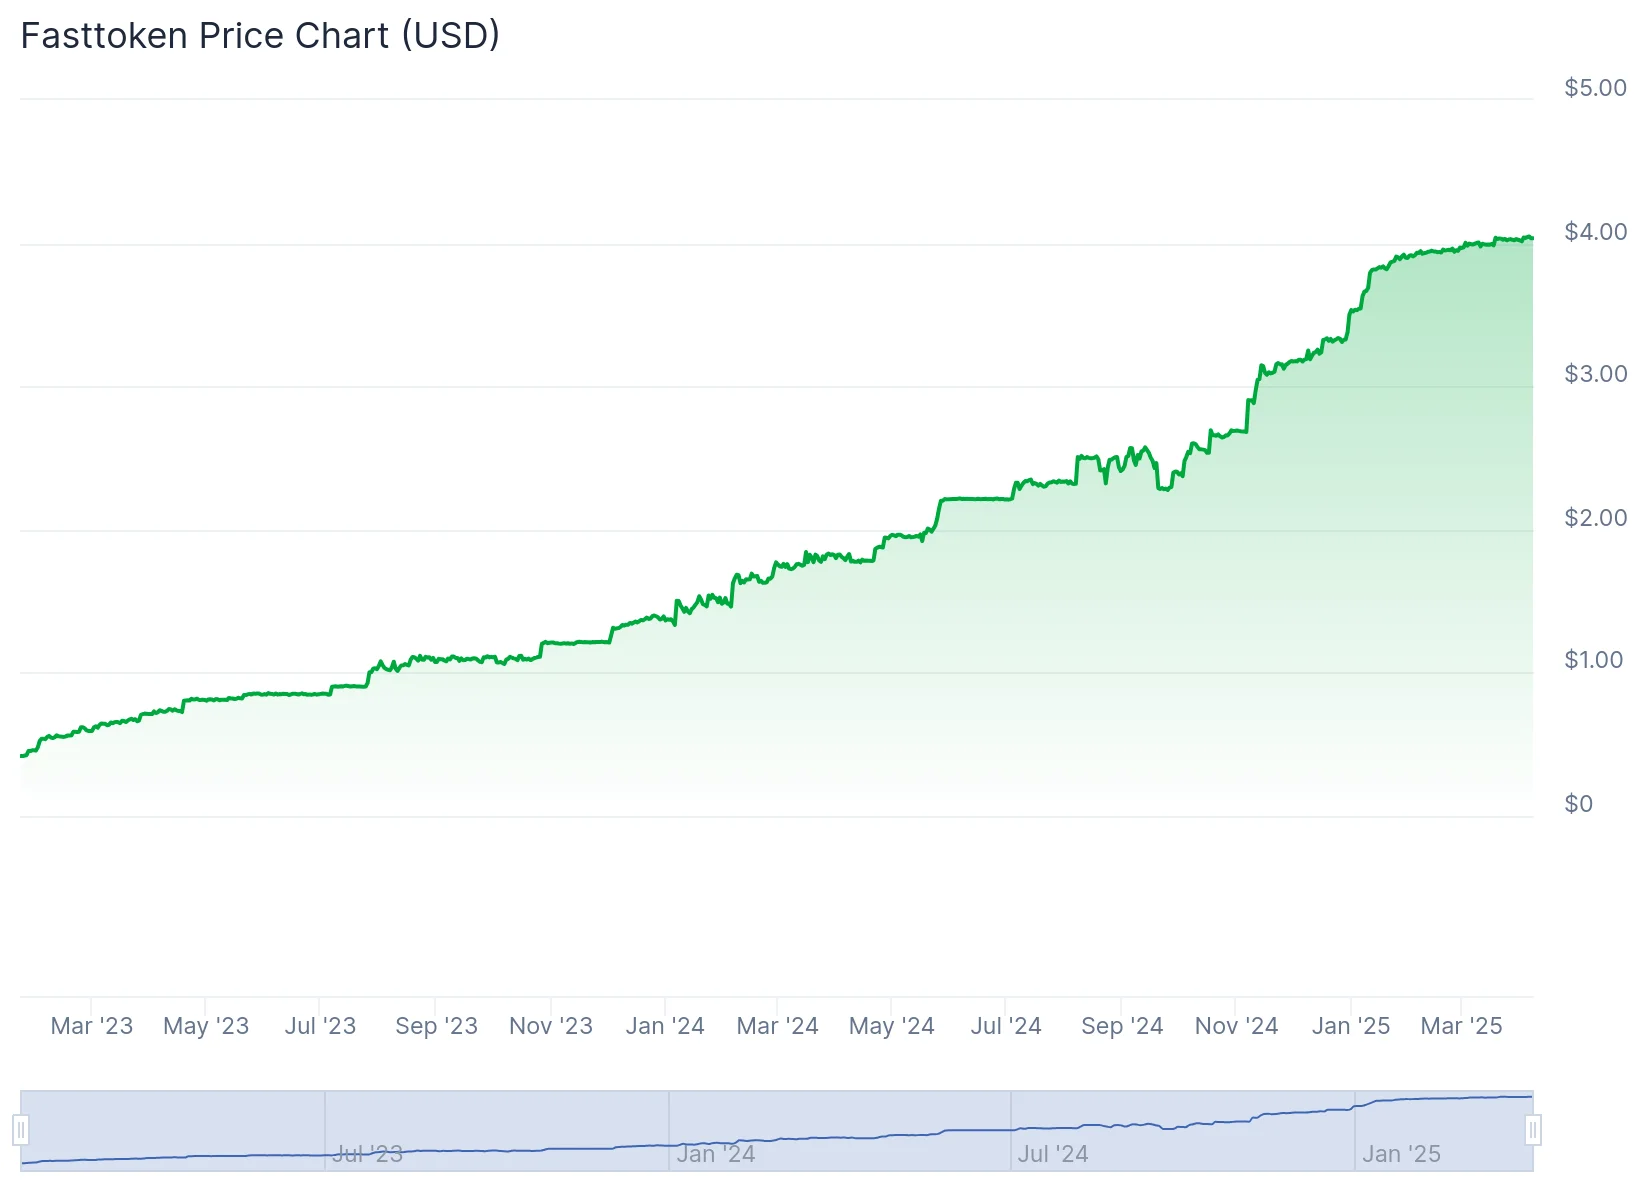
The wave count indicates that FTN is in the fifth and final wave of an upward movement that started in August 2023.
Wave five has extended and has the same length as waves one and three combined. If this is the case, the FTN price is reaching or has reached the end of its upward movement.
Then, the price could begin an A-B-C correction that lasts 0.61 times the upward movement and ends at the $2.35 horizontal support level.
The wave count method gives an FNT prediction of $2.70 for the end of 2025.
Then, we will use the daily rate of increase from launch to this projected target to create the FTN price prediction for the end of 2026 and 2030, respectively.
Doing so leads to targets of $3.30 and $6.80, respectively.
Fasttoken Price Prediction for 2025
The wave count method predicts that the FTN price range will be between $2.16 and $3.24 by the end of the year.
Fasttoken Price Prediction for 2026
The wave count method combined with the rate of increase gives an FTN price prediction range between $2.64 and $3.96 for the end of 2026.
Fasttoken Price Prediction for 2030
The wave count method, combined with the rate of increase, gives an FTN price prediction range between $5.60 and $8 by the end of 2025.
Fasttoken Price Analysis
The daily time frame chart technical indicators show some weakness.
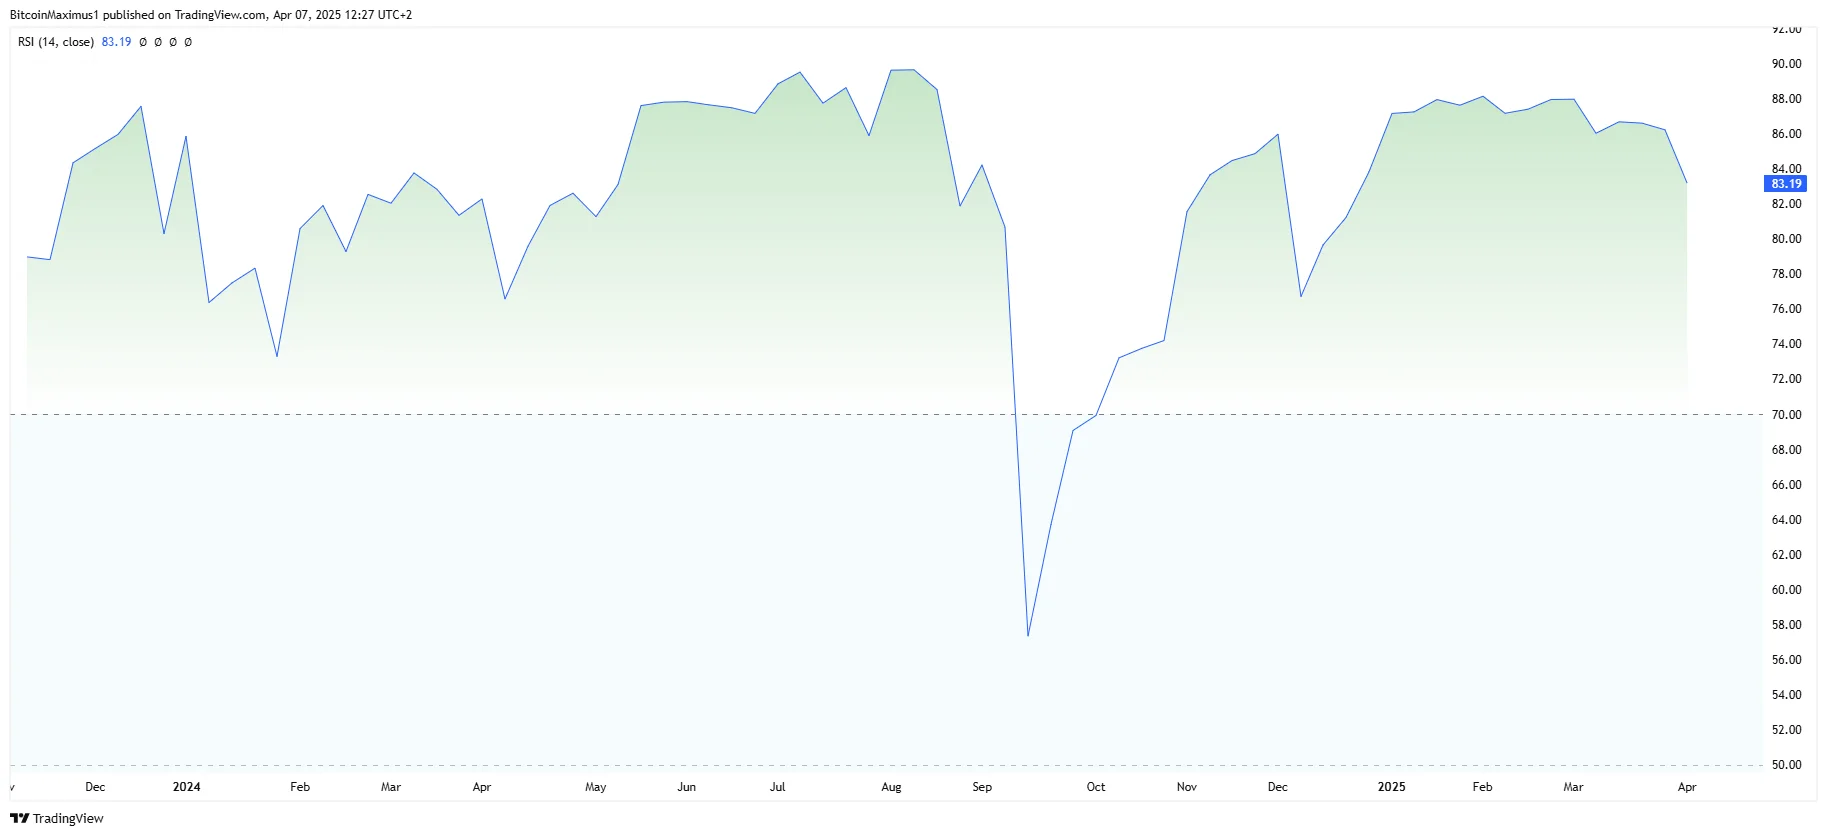
The weakness is visible in the daily RSI, which has generated a bearish divergence for the entire year.
Such divergences often lead to bearish trend reversals, also supported by the bearish wave count.
If FTN starts to decline, the first significant support will be $3.35, created by the 0.382 Fibonacci retracement support level.
Short-Term Fasttoken Price Prediction
The Fasttoken price prediction for the next 24 hours is neutral. While the price will likely reach the top soon, this might not happen in the next 24 hours.
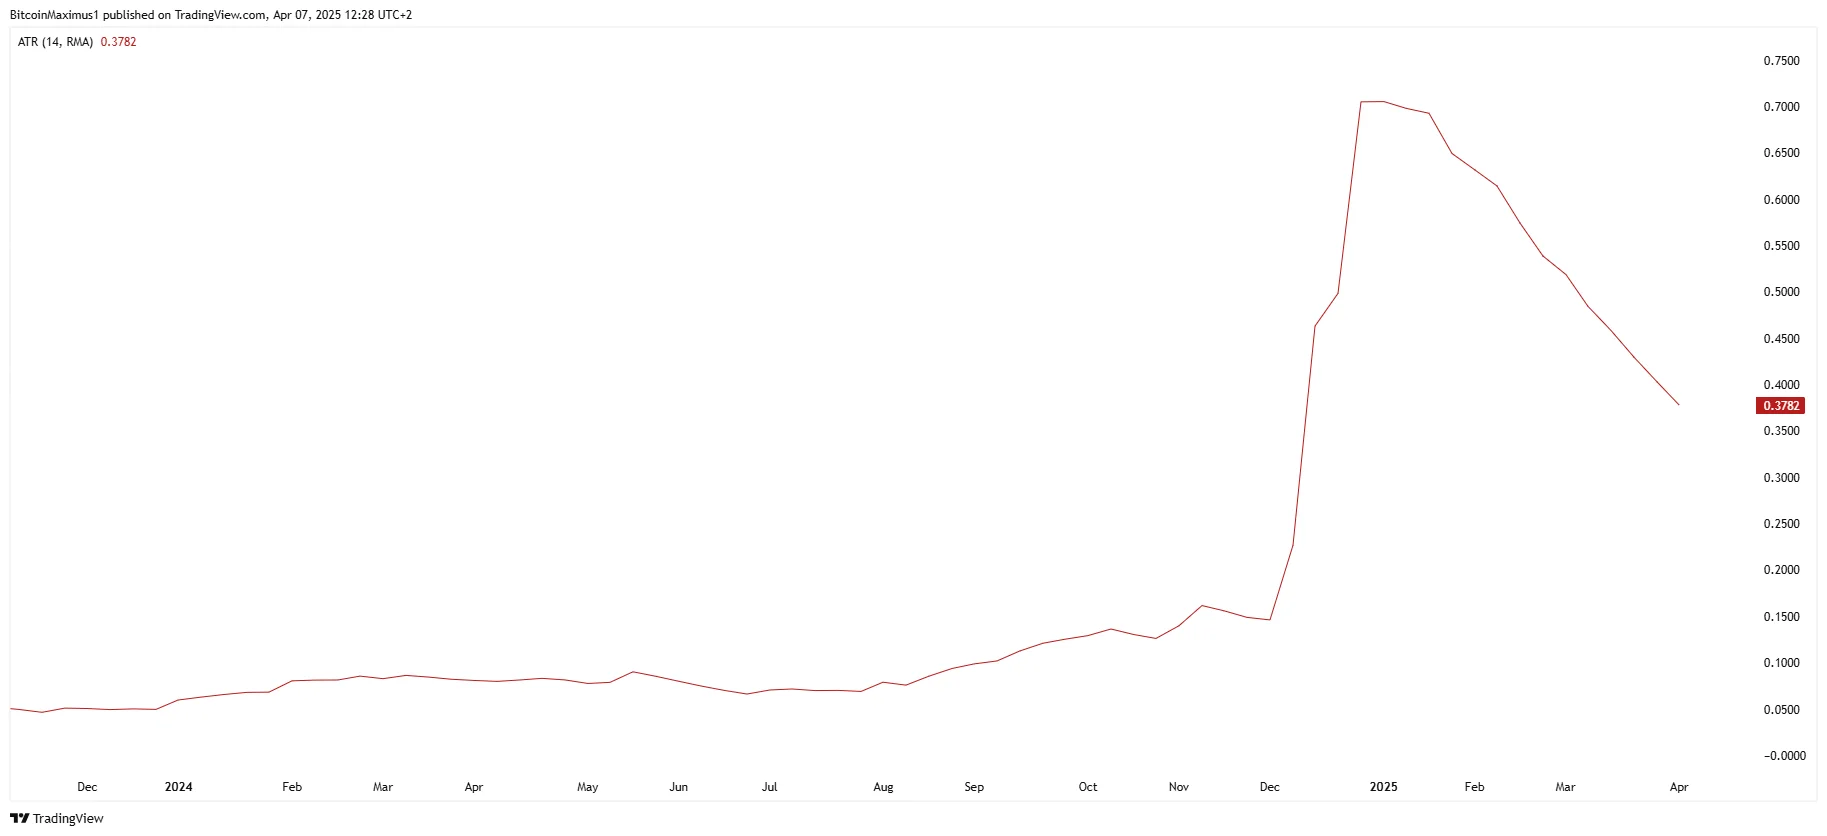
Fasttoken Average True Range (ATR): FTN Volatility
The Average True Range (ATR) measures market volatility by averaging the largest of three values: the current high minus the current low, the absolute value of the current high minus the previous close, and the absolute value of the current low minus the previous close over a period, typically 14 days.
A rising ATR indicates increasing volatility, while a falling ATR indicates decreasing volatility. Since ATR values can be higher for higher-priced assets, normalize ATR by dividing it by the asset price to compare volatility across different price levels.
On April 7, 2025, Fasttoken’s ATR was 0.378, suggesting average volatility.
Fasttoken Relative Strength Index (RSI): Is FTN Overbought or Oversold?
The Relative Strength Index (RSI) is a momentum indicator traders use to determine whether an asset is overbought or oversold. Movements above 70 and below 30 show over and undervaluation, respectively. Movements above and below the 50 line also indicate if the trend is bullish or bearish.
On April 7, 2025, the Fasttoken RSI was 83, indicating bullish conditions.
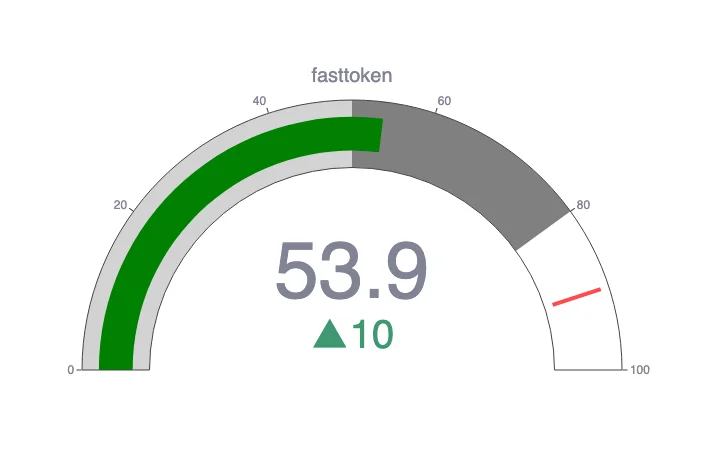
CCN Strength Index
The CCN Strength Index combines an array of advanced market signals to measure the strength of individual cryptocurrencies over the last 30 days.
Every day, it assigns a strength score, ranging from 0 to 100, to the top 500 assets by market capitalization on CoinMarketCap, focusing on both trend direction and the intensity of price movements.
0 to 24: Assets exhibit significant weakness, showing signs of sustained downtrend behavior.
25 to 35: The price tends to move within stable bounds with minimal volatility.
36 to 49: Assets begin a stable uptrend but without strong surges.
50 to 59: Consistent growth with moderate price advances, building momentum.
60+: Sharp price movements and high demand indicate more volatility and trend shifts.
The index dynamically adapts to rapid changes. For example, an asset experiencing a 100% increase within a short timeframe would see a sharp jump in its score to reflect the intensity of the rise.
However, should that asset stabilize at this new price level, the score will gradually taper down and align with the dampened momentum as the movement normalizes.
We looked at the Fasttoken price history and found the best times to buy FTN.
Day of the Week
Tuesday
Week
6
Month
January
Quarter
First
FTN Price History
Now, look at some key dates in the Fasttoken price history. While past performance should never be taken as an indicator of future results, knowing what the coin has done can give us some much-needed context when making or interpreting an FTN price prediction.
0xc7867fccbd5bc5170a90972ffaaa6ccb7a093231. This wallet held 381,607,570 FTN or 78.41% of the supply.
0x040a96659fd7118259ebcd547771f6ecb9580d17. This wallet held 99,198,957 FTN or 20.38% of the supply.
0x8b5bf267f91c71f1e2f43659bf4e88afadc3d795. This wallet held 4,557,426 FTN or 0.94% of the supply.
0xa141176200addb6bb2289e38e59a7d4aea12b1ab. This wallet held 224,362 FTN or 0.05% of the supply.
0xa2602c62520892b13a8472e86639e2e955367210. This wallet held 140,175 FTN or 0.03% of the supply.
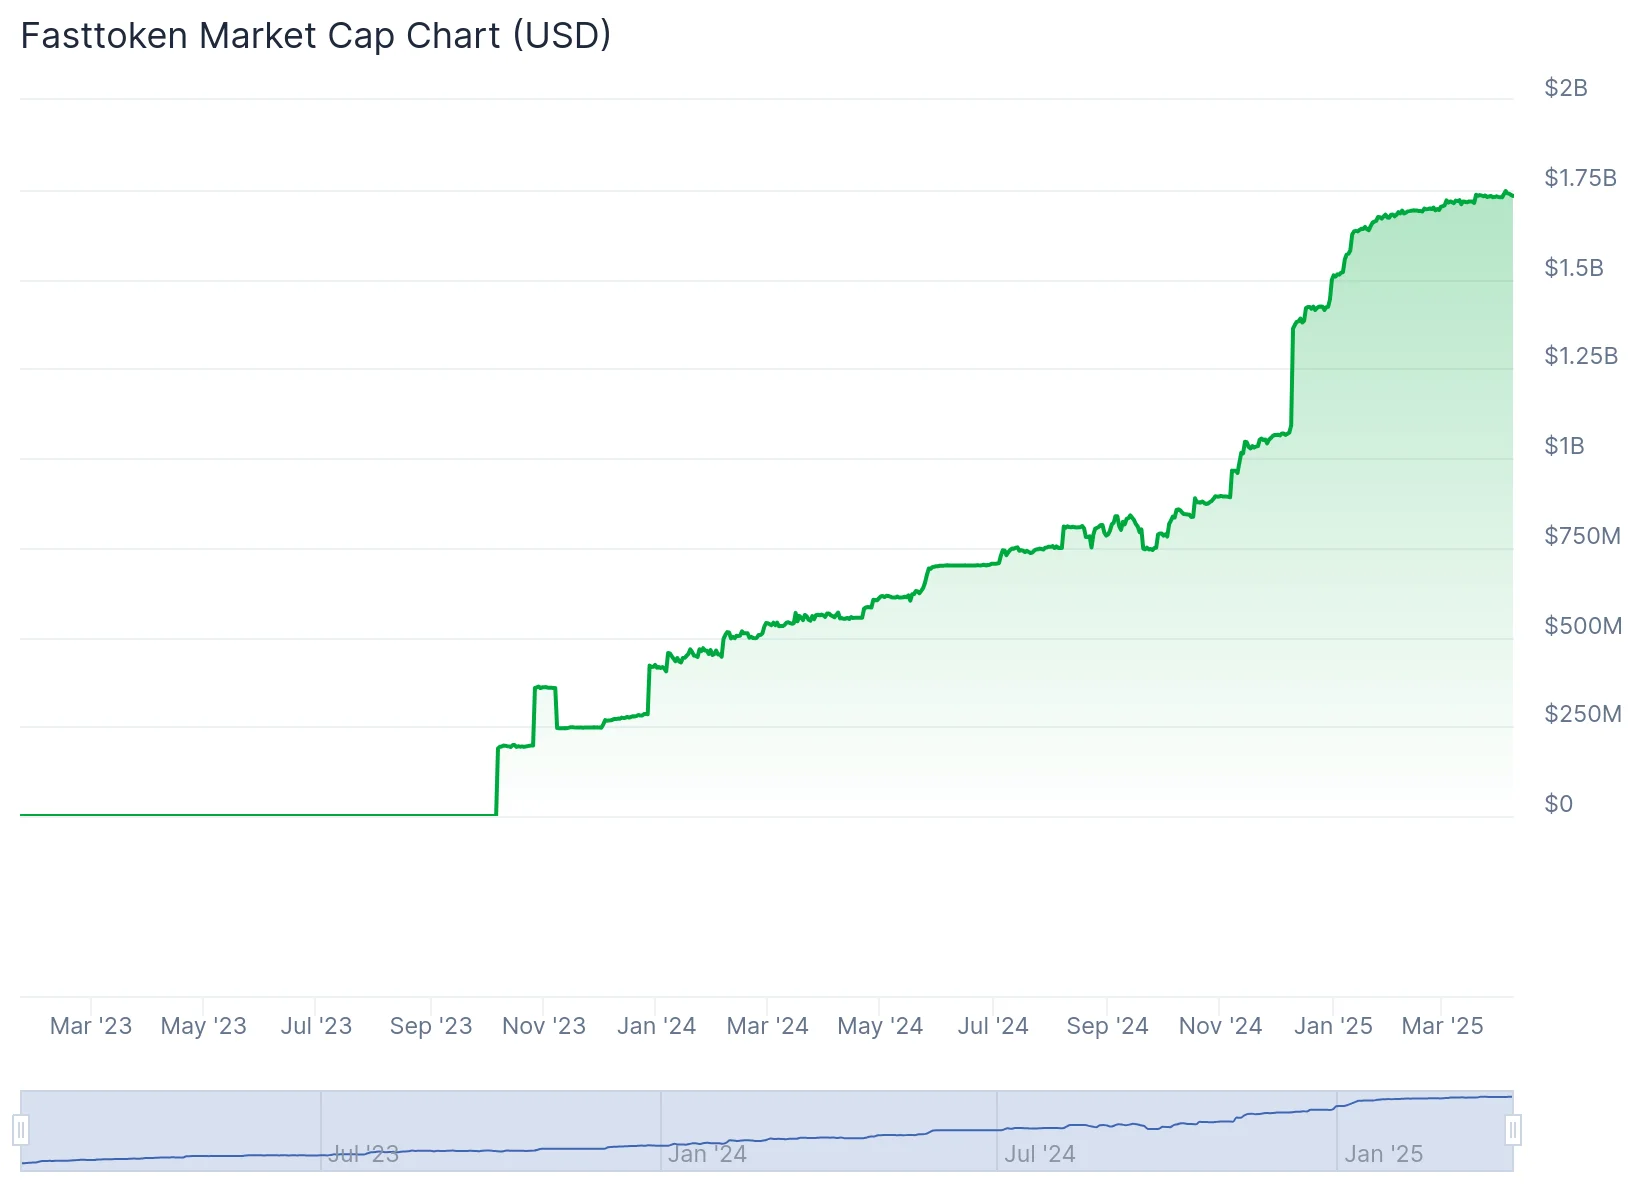
Fasttoken Supply and Distribution
Supply and distribution
Figures
Maximum Supply
1,000,000,000
Circulating supply as of April 7, 2025
430,162,250 (43.16% of maximum supply)
Holder distribution as of April 7, 2025
Top 10 holders owned 99.85% of the supply
From the Fasttoken Whitepaper
In its technical documentation or whitepaper, Fasttoken says it is the native currency of the Fasttex ecosystem, which includes the Bahamut blockchain.
It adds: “A unique feature of the ecosystem is the unified wallet/account for every user. The unified account allows us to register every user and carry out the corresponding KYC/AML policies as required, after which users can easily access all our products and services.”
What is Fasttoken?
Fasttoken, which first emerged in early 2024, is based on the Bahamut blockchain. FTN pays for transactions on Bahamut, functioning on a Proof-of-Stake (PoS) consensus mechanism that allows people to add blocks based on how much FTN they hold and how much they have paid in gas fees.
How Fasttoken Works
Fasttoken is a reward for adding blocks to the Bahamut blockchain. It can be staked or set aside in return for rewards, and people can also buy, sell, and trade it on exchanges.
Is Fasttoken a Good Investment?
It is hard to say. FTN has been a consistent riser since its debut nearly two years ago, but the climb must stop somewhere. As always with crypto, you must research before deciding whether or not to invest in Fasttoken.
Will Fasttoken Go Up or Down?
It is difficult to determine. While the Fasttoken crypto price predictions are optimistic, price predictions have a well-earned reputation for being wrong. Keep in mind that prices can and do go down and up.
Should I Invest in Fasttoken?
Before you decide whether or not to invest in Fasttoken, you will have to do your research, not only on FTN but also on related coins and tokens such as Ethereum (ETH). Either way, you must also ensure you never invest more money than you can afford to lose.
FAQs
How many Fasttoken are there?
On April 7, 2024, there were 430,162 million FTN out of a total circulation of 880 million.
Will Fasttoken reach $10?
It might do, but not for quite some time. Our Fasttoken price predictions suggest FTN won’t get to double figures until at least the 2030s, if at all.
What is Fasttoken used for?
FTN supports the Bahamut blockchain. People can also buy, sell, and trade it on exchanges.
Disclaimer:
The information provided in this article is for informational purposes only. It is not intended to be, nor should it be construed as, financial advice. We do not make any warranties regarding the completeness, reliability, or accuracy of this information. All investments involve risk, and past performance does not guarantee future results. We recommend consulting a financial advisor before making any investment decisions.
Valdrin Tahiri is a cryptocurrency analyst and reporter at CCN, specializing in technical analysis with a focus on Elliott Wave theory, on-chain metrics, and fundamental research. He brings over seven years of experience in the crypto space as both a trader and writer.
He discovered cryptocurrencies in 2017 while earning his MSc in Financial Markets at the Barcelona School of Economics, which sparked a deep interest in blockchain and market dynamics. Since then, he’s contributed to top crypto outlets like BeInCrypto and CoinGape.
Valdrin also served as Community Manager of BeInCrypto’s Telegram group for three years, helping grow it into one of the largest crypto communities worldwide. His expertise in market structure and price patterns allows him to break down complex trends into clear, actionable insights.
He’s published thousands of articles covering altcoins, Bitcoin cycles, and macro trends.