ETH is crushing its symmetrical triangle resistance | Credit: Derek Fenech
Share
Key Takeaways
ETH is squeezed inside a triangle near resistance, and rising MFI suggests buyers still have control for a breakout.
A liquidation cluster sits below $2,800, where approximately $3 billion could be wiped out if ETH breaks down.
If Ethereum’s price loses $3,000 and closes below $2,800, forced selling could accelerate a drop toward $2,619.
Ethereum’s (ETH) price is approaching a key resistance level after it reclaimed the $3,200 mark.
Following the move, traders have built heavy exposure around $2,800, and the downside looks crowded.
However, if Ethereum’s price breaks below that level, the market could experience liquidations not seen in months.
That’s why the altcoin’s next move matters. In this analysis, CCN reveals what an extended bounce could mean for ETH, and how a breakout could signal trouble.
Ethereum Traders Are Overleveraged
CoinGlass data from the liquidation map highlights a significant downside risk zone for Ethereum traders, especially on Binance.
This indicates that approximately $3 billion in long positions, utilizing 25x leverage, could be liquidated if the price of ETH falls below $2,800.
This matters because 25x leverage leaves almost no room for error. Traders with that level of leverage get liquidated after a relatively small move against them.
Therefore, if Ethereum starts slipping below $3,000, many of those long positions can become vulnerable simultaneously.
That creates a crowded liquidation cluster, and the price often reacts violently around those zones.
Once ETH breaks into that area, the selling pressure can become forced. Binance would automatically close those long positions, which typically means market sells.
That action adds extra supply to the order book. As a result, the drop can accelerate, not because spot holders are panicking, but because leverage is unwinding.
That’s why this is more than just a chart level. The $2,800 zone becomes a trigger point. If bulls defend it, Ethereum’s price can stabilize, and the market can cool off.
However, if ETH closes below it with weak buying volume, the liquidation chain can deepen the pullback and push the price lower faster than most traders expect.
That’s because the Short-Term Holder Net Unrealized Profit/Loss (STH-NUPL) is trending upward and has moved away from the capitulation zone.
This matters because STH-NUPL tracks whether short-term holders are sitting in profit or loss.
When it rises above capitulation, it typically indicates that recent buyers are no longer under heavy stress.
As a result, they are less likely to panic-sell into small dips. Instead, many holders tend to wait, which can reduce immediate downside pressure and support price stability.
So, while the liquidation cluster under $3,000 remains a clear risk, the improving STH-NUPL suggests sentiment among newer participants is strengthening.
That shift can help Ethereum’s price absorb volatility and keep the trend intact — at least until fresh selling pressure reappears.
ETH Price Analysis: Will Bulls Survive?
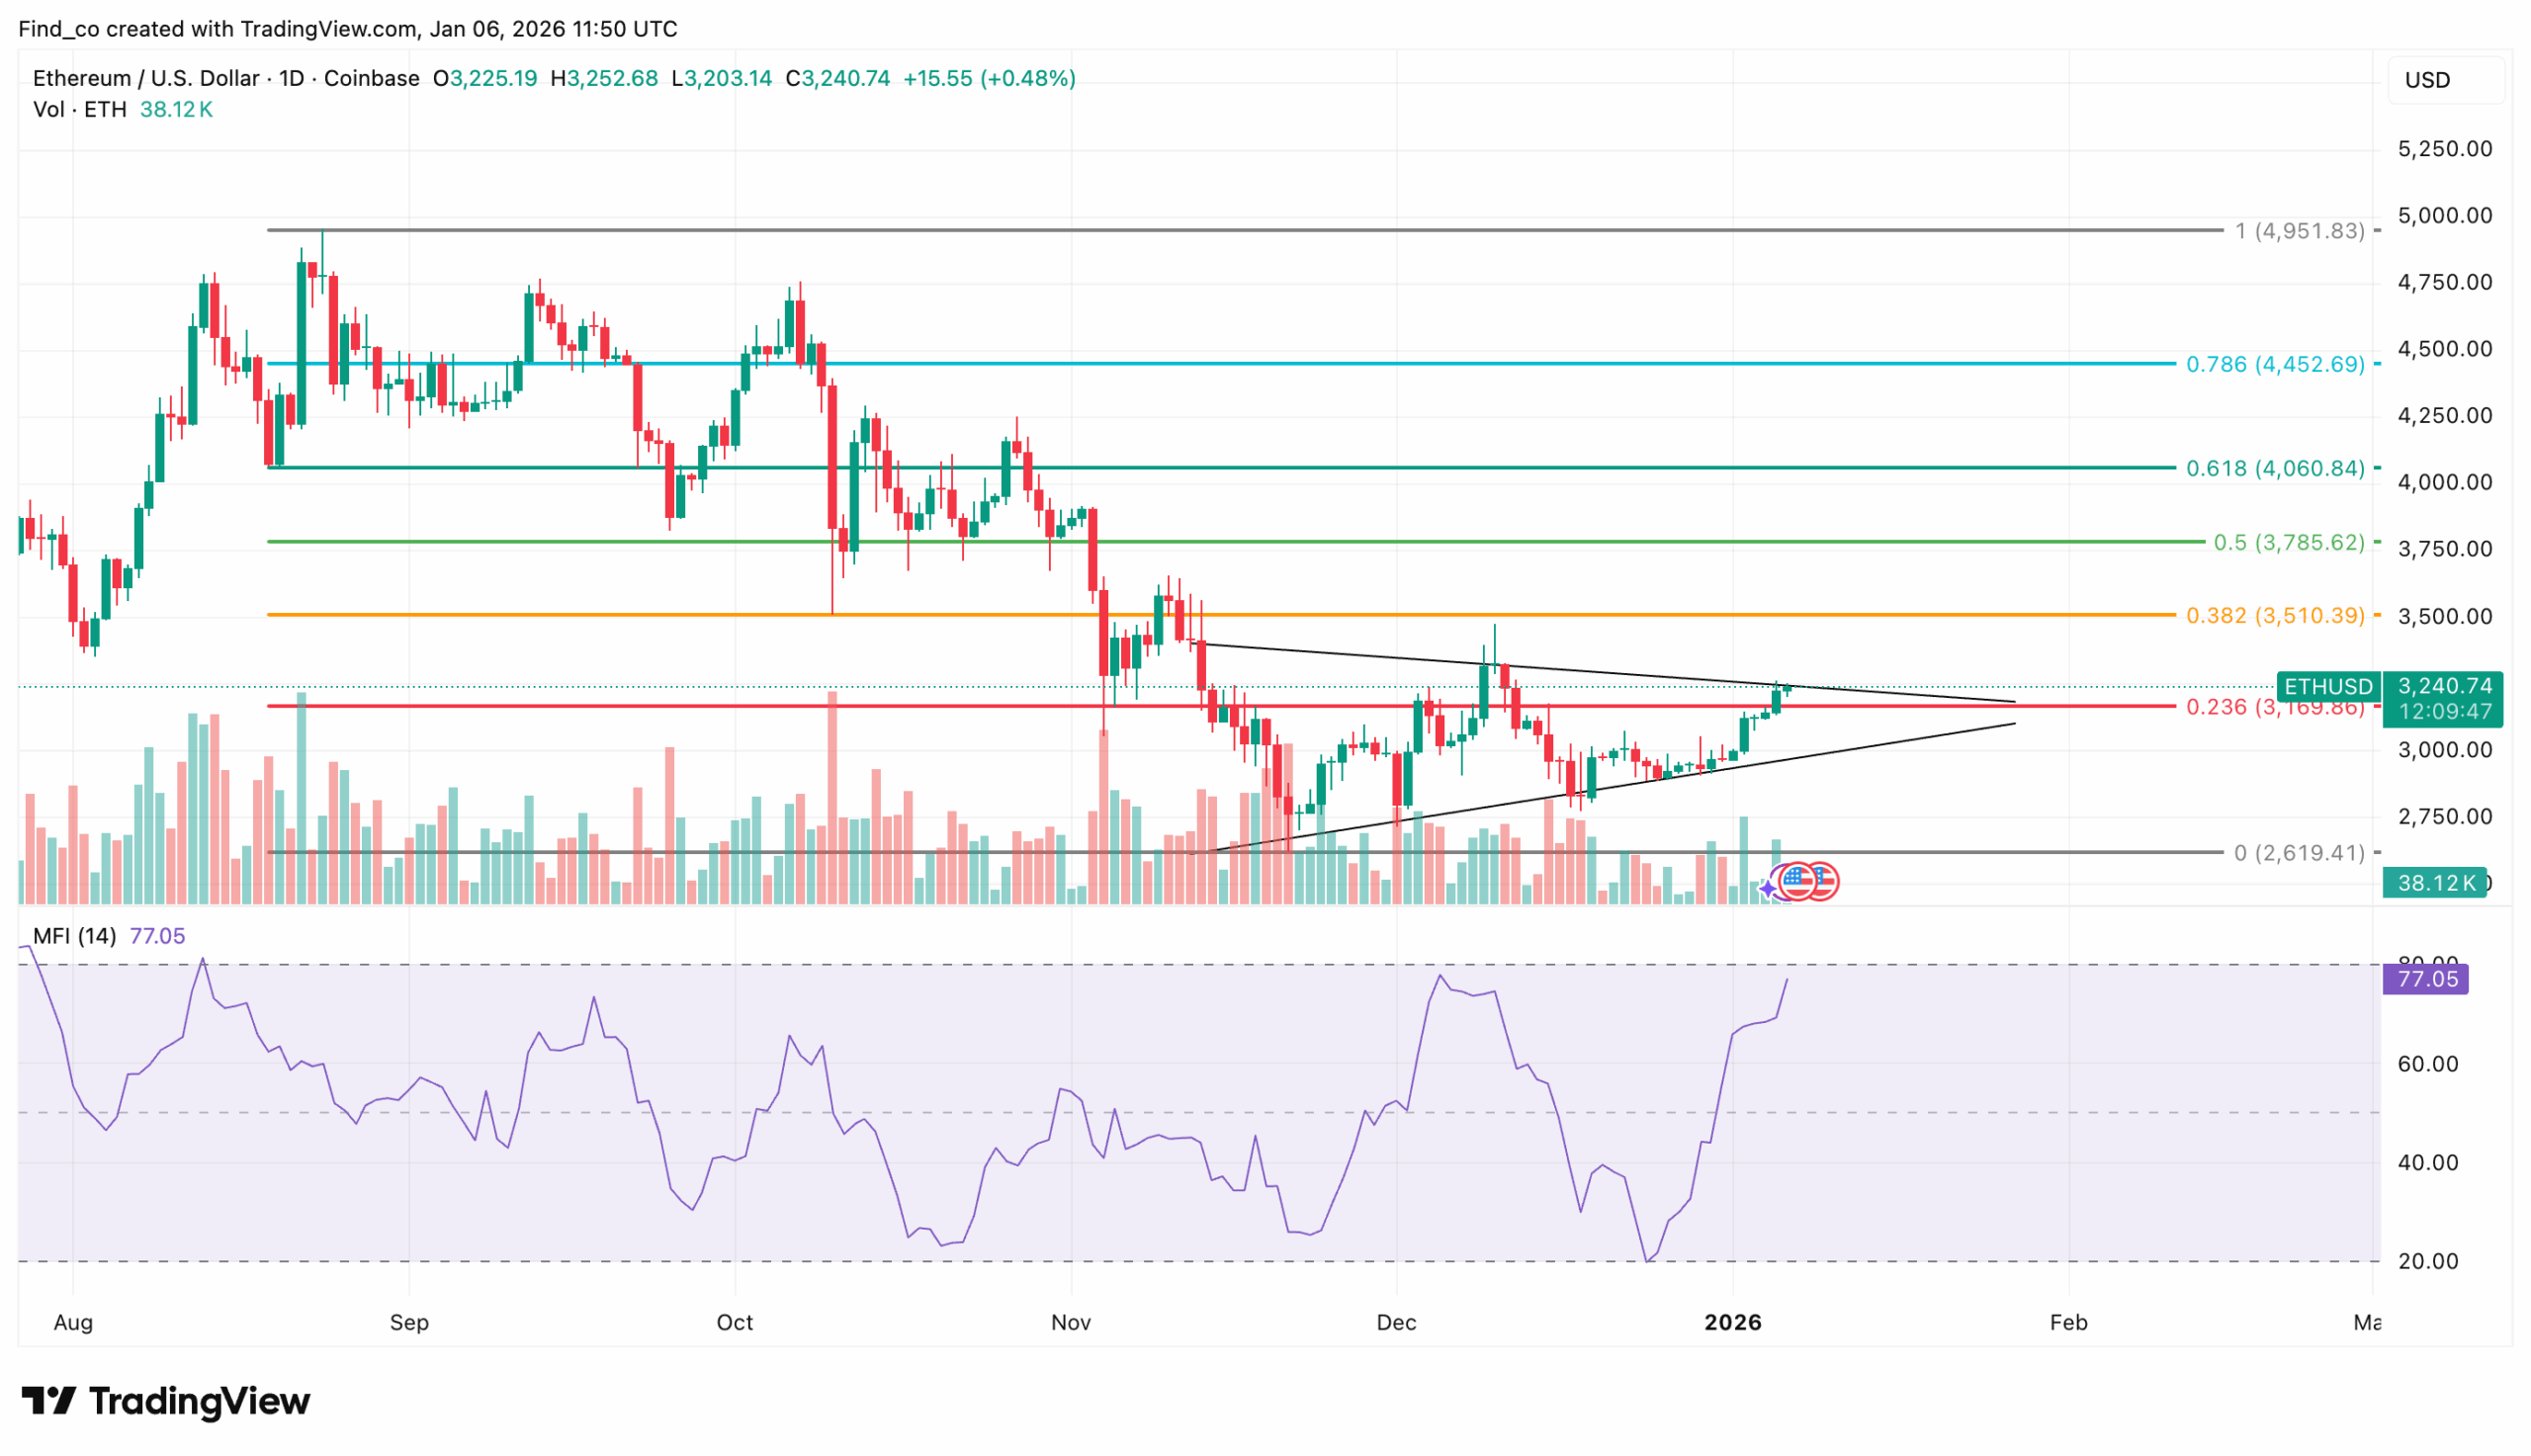
From a technical angle, Ethereum is now pressing against the upper trendline of a symmetrical triangle on the daily chart.
That matters because triangles act as compression zones. As shown below, Ethereum’s price has tightened within the structure, and a breakout appears likely.
At the same time, the Money Flow Index (MFI) keeps rising. That suggests capital is still flowing into ETH, not out of it.
In other words, buyers are showing up, and the market is supporting the push toward resistance.
If ETH holds this momentum and breaks the triangle to the upside, the next likely target sits around $3,510.
If bullish pressure intensifies, the move could extend toward $4,060, particularly if volume increases during the breakout.
However, the triangle can also break lower. If bears regain control and ETH’s price loses support, the bullish scenario can fail quickly.
In that case, ETH could drop toward $2,619. That move would likely push the price below the $3,000 danger zone and could trigger the $3 billion long liquidations on Binance, which may amplify the decline through forced selling.
Disclaimer:
The information provided in this article is for informational purposes only. It is not intended to be, nor should it be construed as, financial advice. We do not make any warranties regarding the completeness, reliability, or accuracy of this information. All investments involve risk, and past performance does not guarantee future results. We recommend consulting a financial advisor before making any investment decisions.
Victor Olanrewaju is a crypto analyst and reporter at CCN with deep roots in on-chain research and technical analysis. His crypto journey began in 2017, but it was the 2020 Uniswap airdrop that sparked a full-time pivot into the space.
With a foundation in copywriting, Victor honed his craft creating high-converting content for leading crypto brokers — most notably an XRP price prediction that ranked #1 on Google during the 2021 bull run.
He later joined AMBCrypto in 2022, where he combined storytelling with technical and on-chain analysis to cover key market narratives.
In 2024, he expanded his expertise at BeInCrypto, collaborating with analysts and using tools like Glassnode, Santiment, and IntoTheBlock to break down Bitcoin and altcoin trends.
At CCN, Victor covers the top cryptocurrencies, memecoins, macro shifts, blending real-time insights with deep-dive metrics.
He holds a Bachelor’s degree in Physics from the University of Ibadan, equipping him to simplify complex data for a wide audience. Follow his work or connect on LinkedIn or X.