How Will Ethereum Fare the Rest of the Year? | Credit: Derek Fenech
Share
Key Takeaways
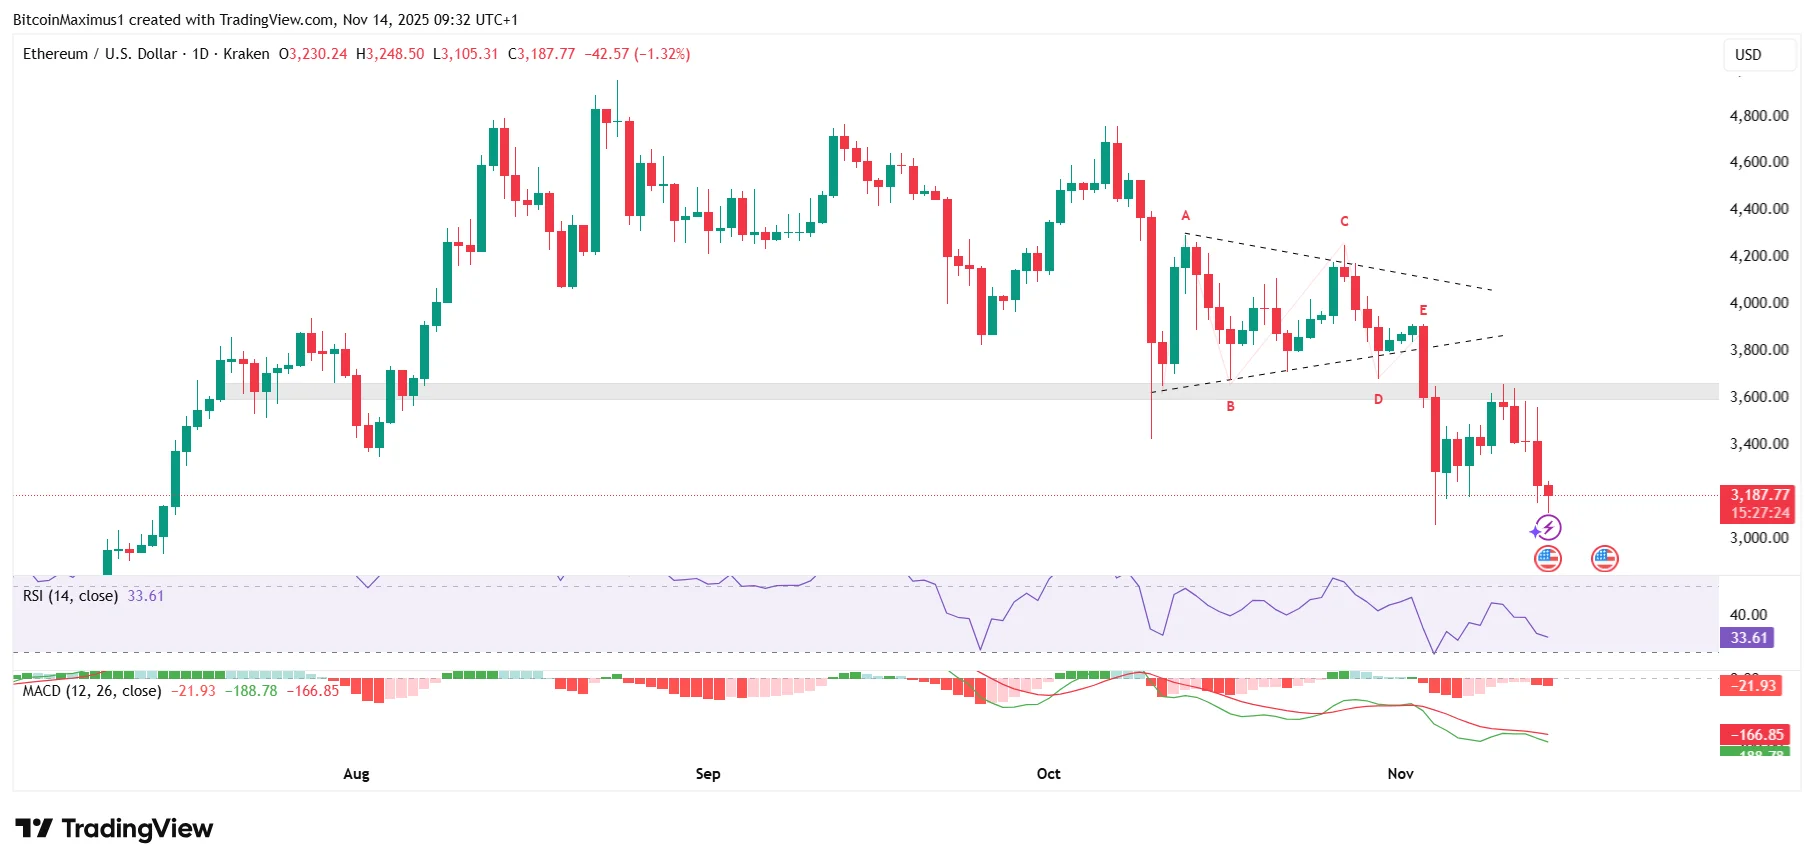
Ethereum (ETH) broke down from a long-term support trend line.
Ethereum remains in the upper part of its long-term horizontal range.
Will Ethereum reverse its decline and break above $4,000?
Ethereum’s price action has taken a decisively bearish turn, shattering key long-term support levels that were reliable for years.
After failing to sustain any grip above the crucial $4,000 area, the trend now shows pronounced weakness across all major timeframes.
Momentum indicators remain firmly bearish, clearly indicating that buyers have lost control.
With ETH still hovering in the upper portion of its broader range, traders are closely watching to see whether another crash is imminent.
Ethereum Price Crash
Ethereum’s weekly price action has shown a 35% decline since its all-time high of $4,955 in August 2021.
Besides the severity of the decline, the drop is worrisome since it caused a crash below two critical levels that were expected to provide support.
Firstly, Ethereum closed below the $4,000 horizontal resistance area, which had served as the range high for over three years.
Get These Top Crypto Casino Offers Now!
Sponsored
Disclosure
We sometimes use affiliate links in our content, when clicking on those we might receive a commission at no extra cost to you. By using this website you agree to our terms and conditions and privacy policy.
The Relative Strength Index (RSI) is below 50 while the Moving Average Convergence/Divergence (MACD) has made a bearish cross.
Therefore, Ethereum’s long-term prediction is bearish. While a bounce at the $2,800 midrange could occur, an eventual breakdown is likely, taking the price to new lows.
If the downward movement continues, the closest support level will be at $2,900, very close to the range’s midline.
Why Ethereum Will Keep Going Down
Ethereum’s price will need to reclaim major resistance levels to invalidate its growing bearish structure. However, technical indicators currently show no sign of a bullish reversal.
Short-term corrective bounces may occur, yet the broader trend continues to point downward.
A breakdown from the current channel structure confirmed the bearish outlook and opened the door to new lows.
Until key support is regained, caution remains the dominant approach for ETH traders.
Disclaimer:
The information provided in this article is for informational purposes only. It is not intended to be, nor should it be construed as, financial advice. We do not make any warranties regarding the completeness, reliability, or accuracy of this information. All investments involve risk, and past performance does not guarantee future results. We recommend consulting a financial advisor before making any investment decisions.
Valdrin Tahiri is a cryptocurrency analyst and reporter at CCN, specializing in technical analysis with a focus on Elliott Wave theory, on-chain metrics, and fundamental research. He brings over seven years of experience in the crypto space as both a trader and writer.
He discovered cryptocurrencies in 2017 while earning his MSc in Financial Markets at the Barcelona School of Economics, which sparked a deep interest in blockchain and market dynamics. Since then, he’s contributed to top crypto outlets like BeInCrypto and CoinGape.
Valdrin also served as Community Manager of BeInCrypto’s Telegram group for three years, helping grow it into one of the largest crypto communities worldwide. His expertise in market structure and price patterns allows him to break down complex trends into clear, actionable insights.
He’s published thousands of articles covering altcoins, Bitcoin cycles, and macro trends.