As sentiment turns positive, ETH's next challenge is building enough momentum to break $5,000 | Credit: Hameem Sarwar
Share
Key Takeaways
Ethereum’s price rebounded above $4,000 after defending key support near $3,723.
A confirmed bull flag breakout could send ETH toward $4,800 if momentum sustains.
While ETH sentiment improves, reaching $5,000 will require intense buying pressure.
Support held, sentiment improved, but a run to $5,000 still looks challenging.
This perfectly describes Ethereum’s (ETH) price action over the past few days. Last week, Ethereum’s price briefly dropped below $4,000 with indicators flashing signs of capitulation.
However, the setup changed days later as ETH broke above the psychological zone again. Yet, this rebound does not imply that a new all-time high is imminent.
Fortunately, the altcoin has avoided a breakdown below the lower trendline at $3,723, signaling downside pressure may be easing.
Get These Top Crypto Casino Offers Now!
Sponsored
Disclosure
We sometimes use affiliate links in our content, when clicking on those we might receive a commission at no extra cost to you. By using this website you agree to our terms and conditions and privacy policy.
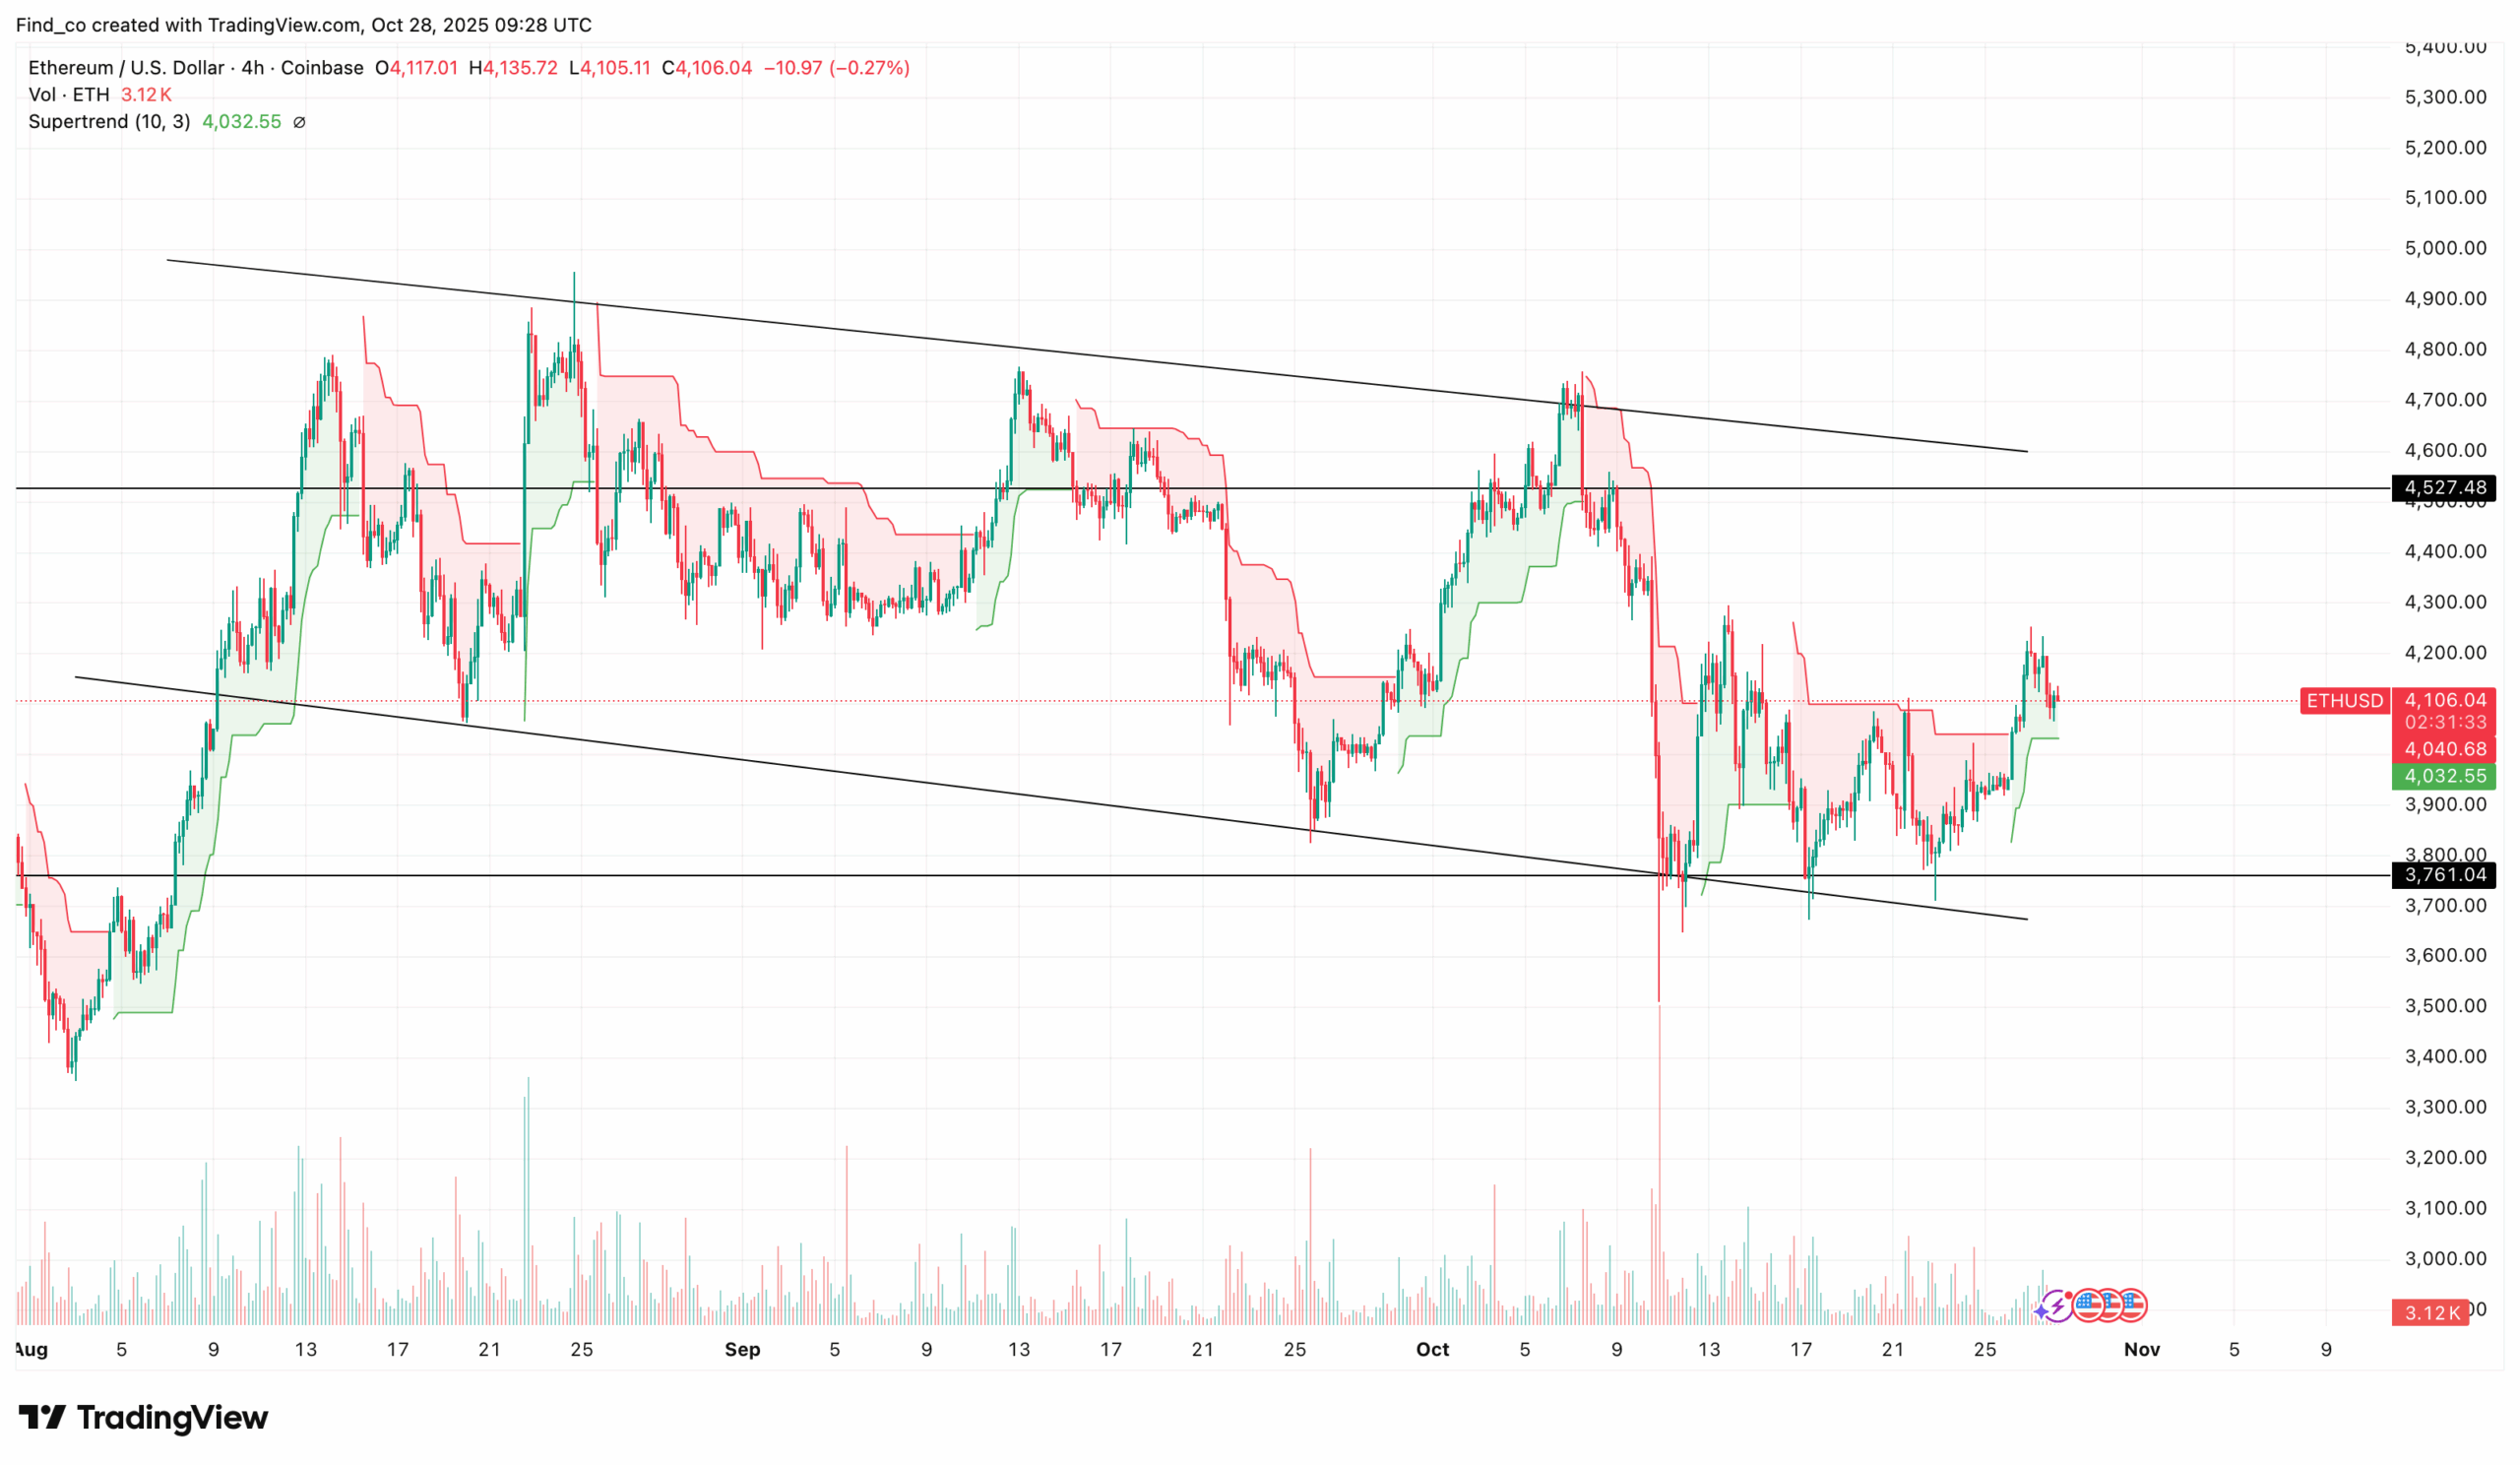
As of this writing, ETH has bounced above this support zone, suggesting that a prolonged downtrend may be unlikely.
The chart also shows that bulls are actively defending the $3,761 level, reinforcing the likelihood of a short-term recovery.
If this momentum continues, Ethereum could test the upper resistance level around $4,527.
Supporting this potential move, the green line of the Supertrend indicator has now flipped below ETH’s price, signaling a bullish bias and confirming improving market strength.
If this position remains unchanged, ETH’s price may trade higher in the short term.
Meanwhile, analysts have weighed in on the recent drawdown, offering insight into its causes while maintaining an overall bullish outlook for Ethereum.
One such analyst, Ted Pillows, noted that despite short-term volatility, ETH remains fundamentally strong and could soon retest the $4,300 level if buying pressure continues to build.
According to Pillows, macro stability and rising interest in Ethereum-based applications may serve as catalysts for this rebound, reinforcing the notion that the recent dip was a healthy correction within an ongoing uptrend.
“ETH failed to reclaim the $4,250 zone. This is why ETH came down and retested the $4,050 support level.
So far, Ethereum is showing a strong bounceback and could rally towards the $4,200-$4,300 level again today,” Pillows emphasized.
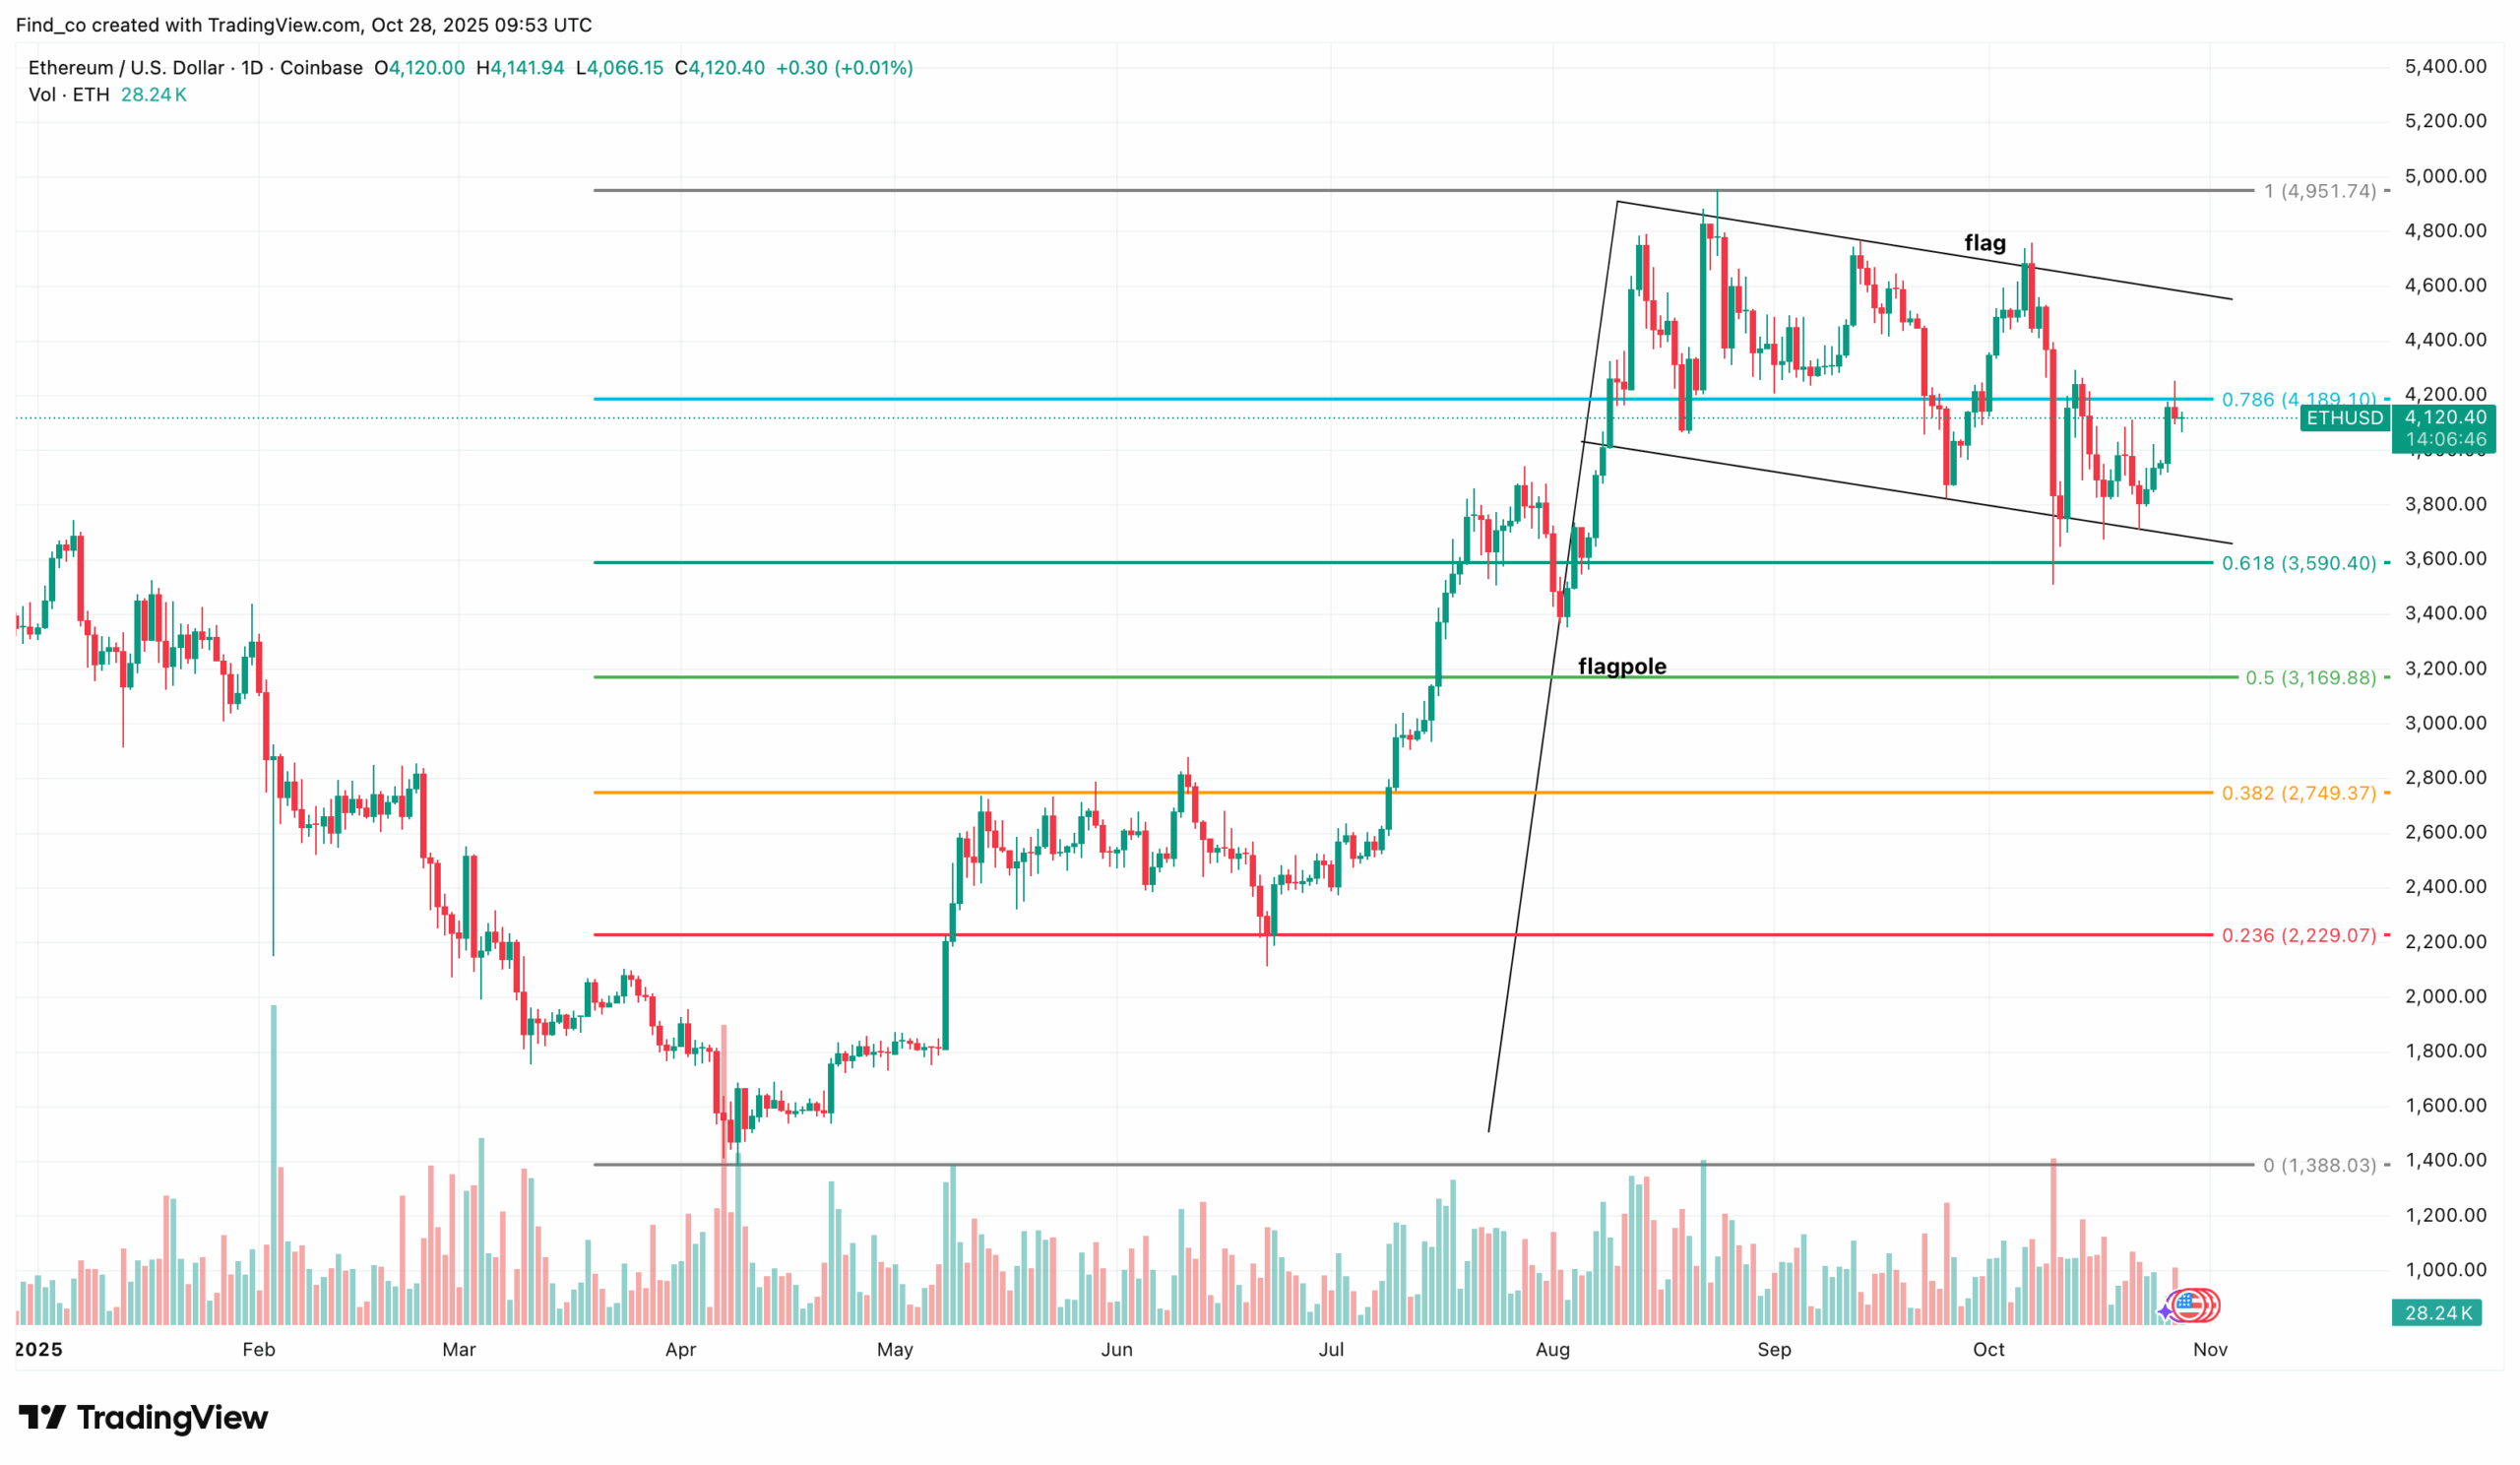
ETH Price Analysis: Resistance Ahead
Looking at the daily chart, Ethereum’s price appears to have formed a bull flag pattern, a continuation setup that typically signals a pause before the next leg of an uptrend.
The pattern typically develops after a strong uptrend, often referred to as the flagpole. Following that, a short period of consolidation occurs, marked by parallel downward-sloping lines, forming the flag.
In this case, the bull flag reflects temporary profit-taking. This happens as the market cools down while buyers prepare for another push higher.
Considering the current setup, Ethereum’s price has breached the 4,189 resistance. If this trend persists, cryptocurrency may inch closer to its all-time high.
Disclaimer:
The information provided in this article is for informational purposes only. It is not intended to be, nor should it be construed as, financial advice. We do not make any warranties regarding the completeness, reliability, or accuracy of this information. All investments involve risk, and past performance does not guarantee future results. We recommend consulting a financial advisor before making any investment decisions.
Victor Olanrewaju is a crypto analyst and reporter at CCN with deep roots in on-chain research and technical analysis. His crypto journey began in 2017, but it was the 2020 Uniswap airdrop that sparked a full-time pivot into the space.
With a foundation in copywriting, Victor honed his craft creating high-converting content for leading crypto brokers — most notably an XRP price prediction that ranked #1 on Google during the 2021 bull run.
He later joined AMBCrypto in 2022, where he combined storytelling with technical and on-chain analysis to cover key market narratives.
In 2024, he expanded his expertise at BeInCrypto, collaborating with analysts and using tools like Glassnode, Santiment, and IntoTheBlock to break down Bitcoin and altcoin trends.
At CCN, Victor covers the top cryptocurrencies, memecoins, macro shifts, blending real-time insights with deep-dive metrics.
He holds a Bachelor’s degree in Physics from the University of Ibadan, equipping him to simplify complex data for a wide audience. Follow his work or connect on LinkedIn or X.