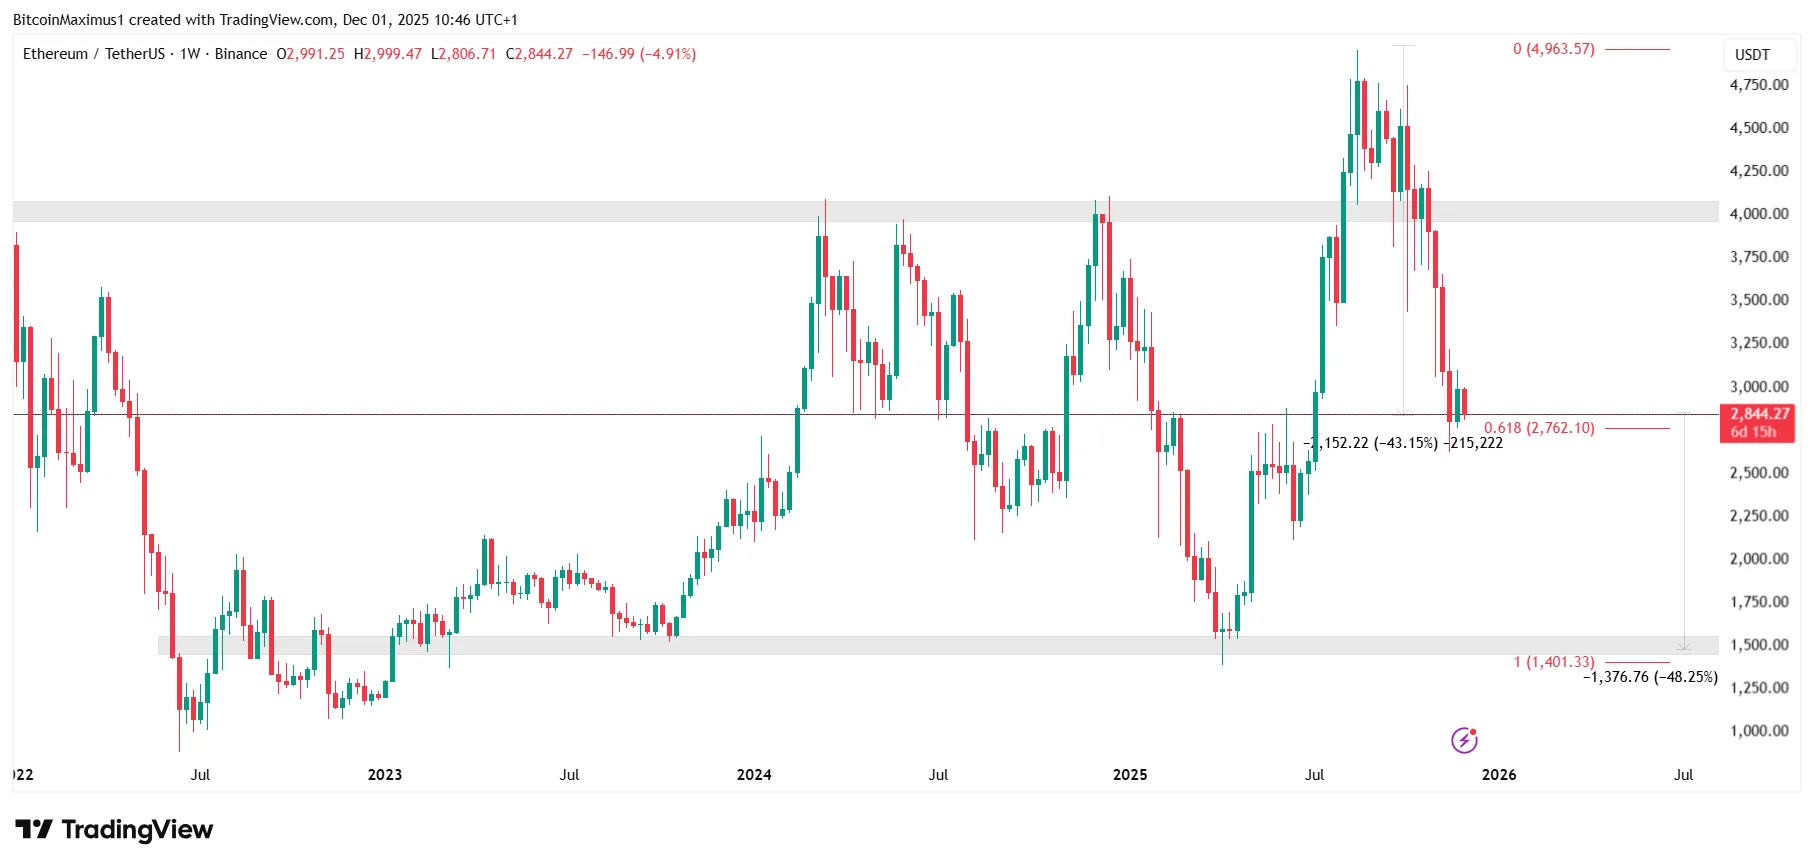
Ethereum is down 43% from its all-time high in August.
ETH trades at a critical support zone inside a long-term range.
A breakdown below $2,800 could trigger a plunge toward $1,500.
Ethereum is suddenly under intense pressure, collapsing more than 43% from its all-time high and testing one of its most crucial long-term support levels.
The sharp decline has left traders asking a critical question: Why is ETH falling, and how much lower can it drop before a real reversal begins?
Let’s break down what the charts and recent macro commentary actually reveal.
Why is ETH Going Down?
Ethereum’s decline began accelerating the moment it lost the $4,000 horizontal support area, a key level that had held for most of the year.
Once that support failed, ETH fell rapidly, hitting a low of $2,623 before attempting to bounce.
Get These Top Crypto Casino Offers Now!
Sponsored
Disclosure
We sometimes use affiliate links in our content, when clicking on those we might receive a commission at no extra cost to you. By using this website you agree to our terms and conditions and privacy policy.
If Ethereum crashes below it, it could plummet by another 50% to the range low of $1,500.
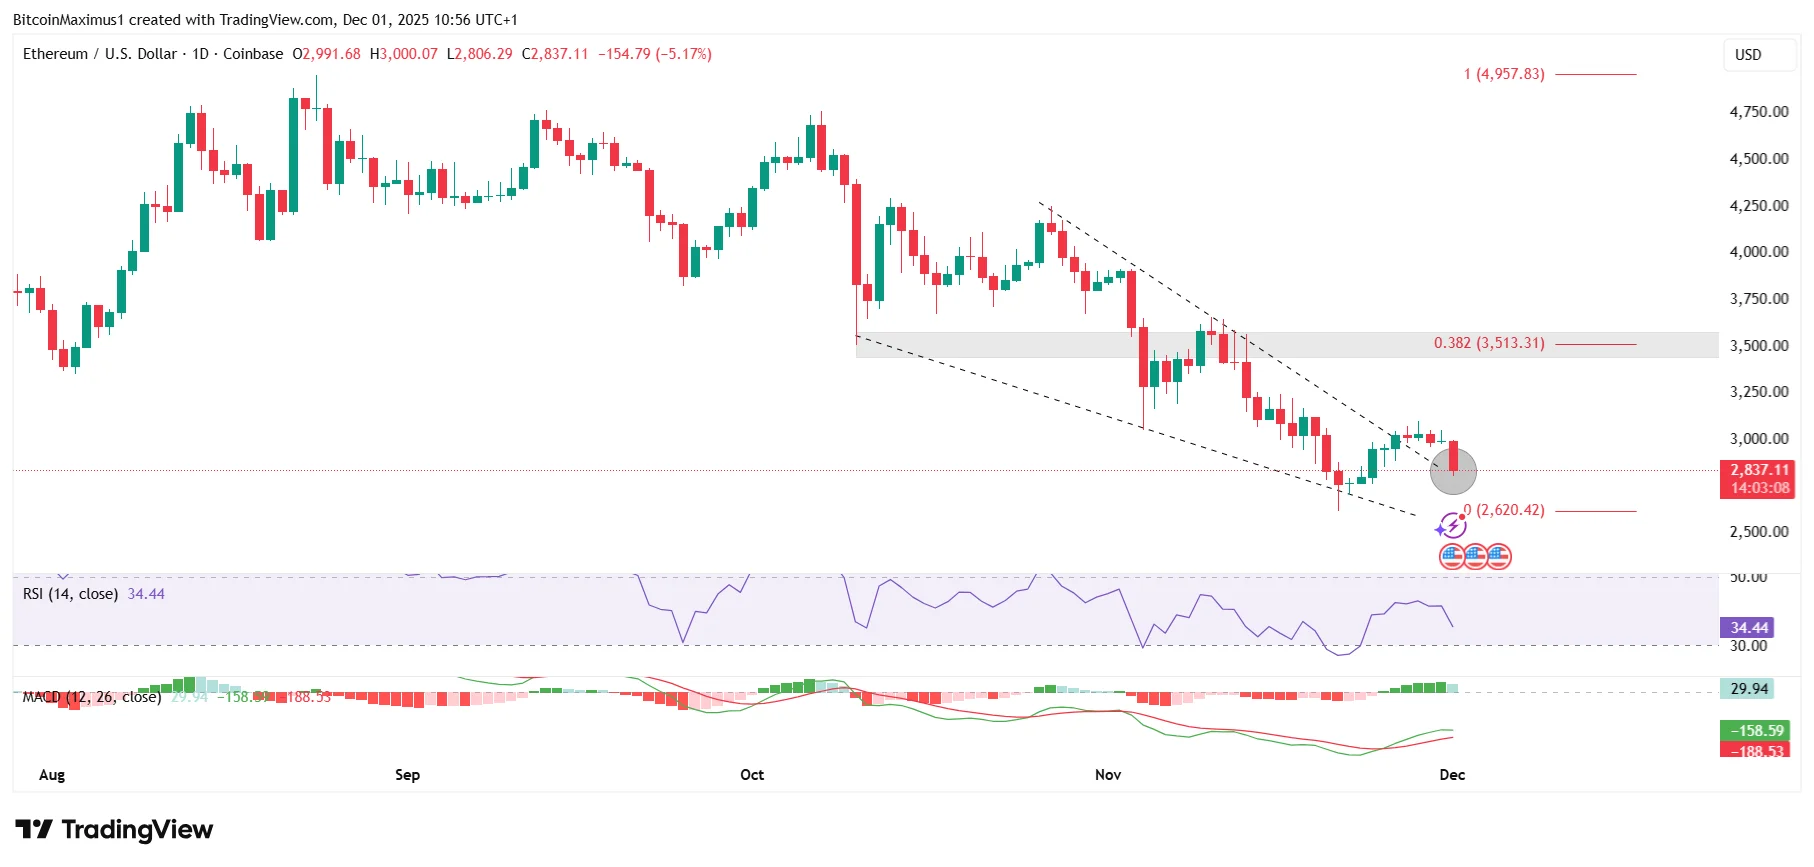
Bulls are making their last stand at the $2,800 support level, and if that fails, ETH will continue to decline at an even faster pace.
Tom Lee’s Ethereum Price Prediction
BitMine Chairman Tom Lee, known for bold crypto forecasts, recently offered comments aimed at explaining Ethereum’s underperformance in this cycle and assessing its outlook.
Yesterday, he discussed his previous predictions, stating that the reason Ethereum did not reach $7,000 as expected this year was due to the unprecedented tariff hikes.
Tom Lee just dropped a huge warning and a surprising crypto call:
• 2026 “policy shock” could slam the S&P 500 by 20%
• On Oct 10, 1/3 of crypto market makers went bankrupt, and 2M accounts were wiped
• “We’re near the crypto bottom, but AI, not crypto, leads next cycle”
•… pic.twitter.com/FRy2qYth94
Crypto had been a leading indicator for the past five years. However, on October 10, it experienced a flash crash that resulted in the largest liquidation ever. A third of market makers went out of business, and two million accounts were wiped out.
According to Lee, crypto prices are likely near a bottom since leverage has already been unwound.
However, he does not foresee a crypto-led recovery; instead, he emphasizes that AI will drive the next cycle.
Interestingly, Tom Lee did not give any new Ethereum price predictions.
In the absence of new predictions, the previous forecast that Ethereum will reach $7,000-$9,000 by January 2026 remains unchanged.
To top it off, the RSI and MACD are both bearish, predicting a breakdown and new lows ahead.
This raises the likelihood of another breakdown, especially if ETH closes the week below $2,800, which would confirm continuation toward new lows.
Another Breakdown Awaits
Ethereum is positioned at one of the most critical points in its multi-year structure.
If $2,800 breaks, the charts point clearly to a drop toward $1,500, completing the long-term range rotation.
While Tom Lee believes ETH is nearing a bottom, momentum signals show no confirmed reversal yet.
Traders should be prepared for more volatility unless ETH reclaims higher resistance levels with conviction.
For now, the answer to why ETH is declining lies in a combination of lost support levels, bearish momentum, and macroeconomic pressure, and the charts still give bears the upper hand.
Valdrin Tahiri is a cryptocurrency analyst and reporter at CCN, specializing in technical analysis with a focus on Elliott Wave theory, on-chain metrics, and fundamental research. He brings over seven years of experience in the crypto space as both a trader and writer.
He discovered cryptocurrencies in 2017 while earning his MSc in Financial Markets at the Barcelona School of Economics, which sparked a deep interest in blockchain and market dynamics. Since then, he’s contributed to top crypto outlets like BeInCrypto and CoinGape.
Valdrin also served as Community Manager of BeInCrypto’s Telegram group for three years, helping grow it into one of the largest crypto communities worldwide. His expertise in market structure and price patterns allows him to break down complex trends into clear, actionable insights.
He’s published thousands of articles covering altcoins, Bitcoin cycles, and macro trends.