Is the Ethereum Trend Bullish or Bearish? | Credit: Hameem Sarwar
Share
Key Takeaways
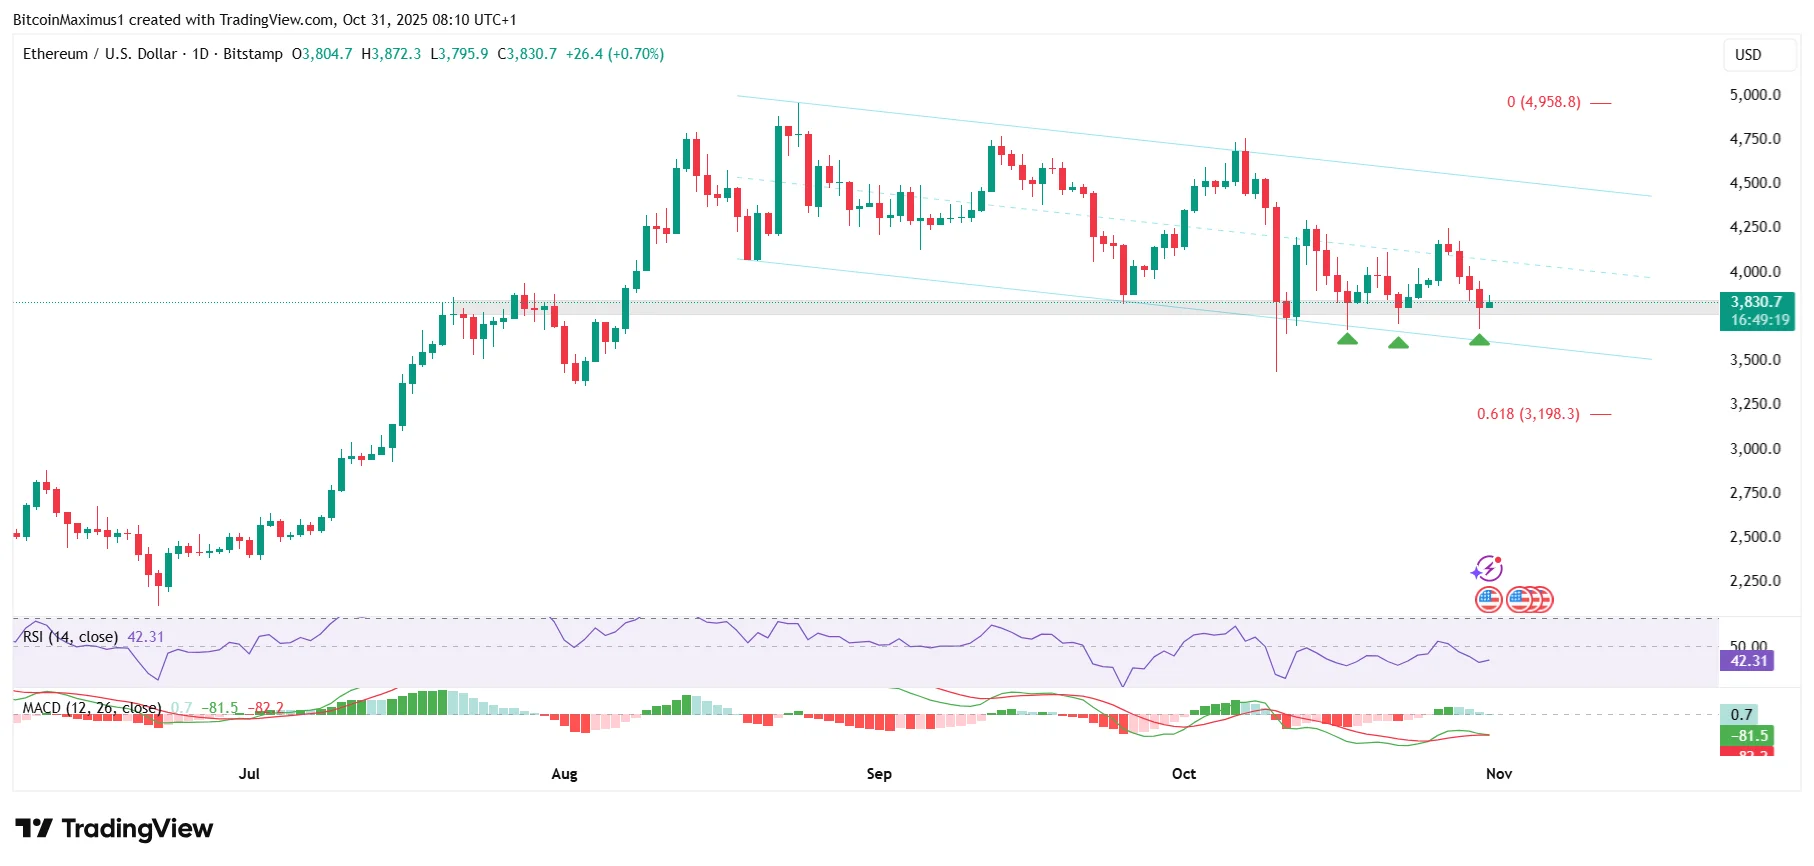
Ethereum (ETH) trades inside a descending parallel channel.
Ethereum has completed a short-term triple bottom pattern.
Will Ethereum begin a bullish trend reversal, or is a breakdown more likely?
Ethereum’s price action continues to be one of the most closely watched in the crypto market, as its price movement could heavily influence where the market, especially altcoins, head next.
ETH has struggled to maintain momentum after an explosive surge earlier in the year, slipping into a descending channel that hints at possible weakness.
With a breakdown from key support looming and momentum indicators flashing red, the next move could define Ethereum’s prediction for the rest of 2026.
Ethereum’s Technical Analysis
Ethereum’s price surged in the second quarter of 2025 but has since fallen, following its all-time high price of $4,955 on Aug. 24.
These channels typically feature corrective structures, supported by the gradual and choppy movement within the pattern.
Get These Top Crypto Casino Offers Now!
Sponsored
Disclosure
We sometimes use affiliate links in our content, when clicking on those we might receive a commission at no extra cost to you. By using this website you agree to our terms and conditions and privacy policy.
Another positive sign is the triple bottom pattern (green icons) inside the $3,800 horizontal support area, which could trigger a bullish trend reversal.
However, some signs suggest a downward movement is more likely than a breakout.
More specifically, the price of Ethereum trades in the lower portion of the channel, reducing the likelihood of an eventual breakout.
Because of these mixed readings, whether the Ethereum price breaks down from the channel or moves in its upper portion can determine the future prediction.
A breakdown could take the price to the 0.618 Fibonacci retracement support level at $3,200 and possibly much lower, while a breakout will lead to new all-time highs.
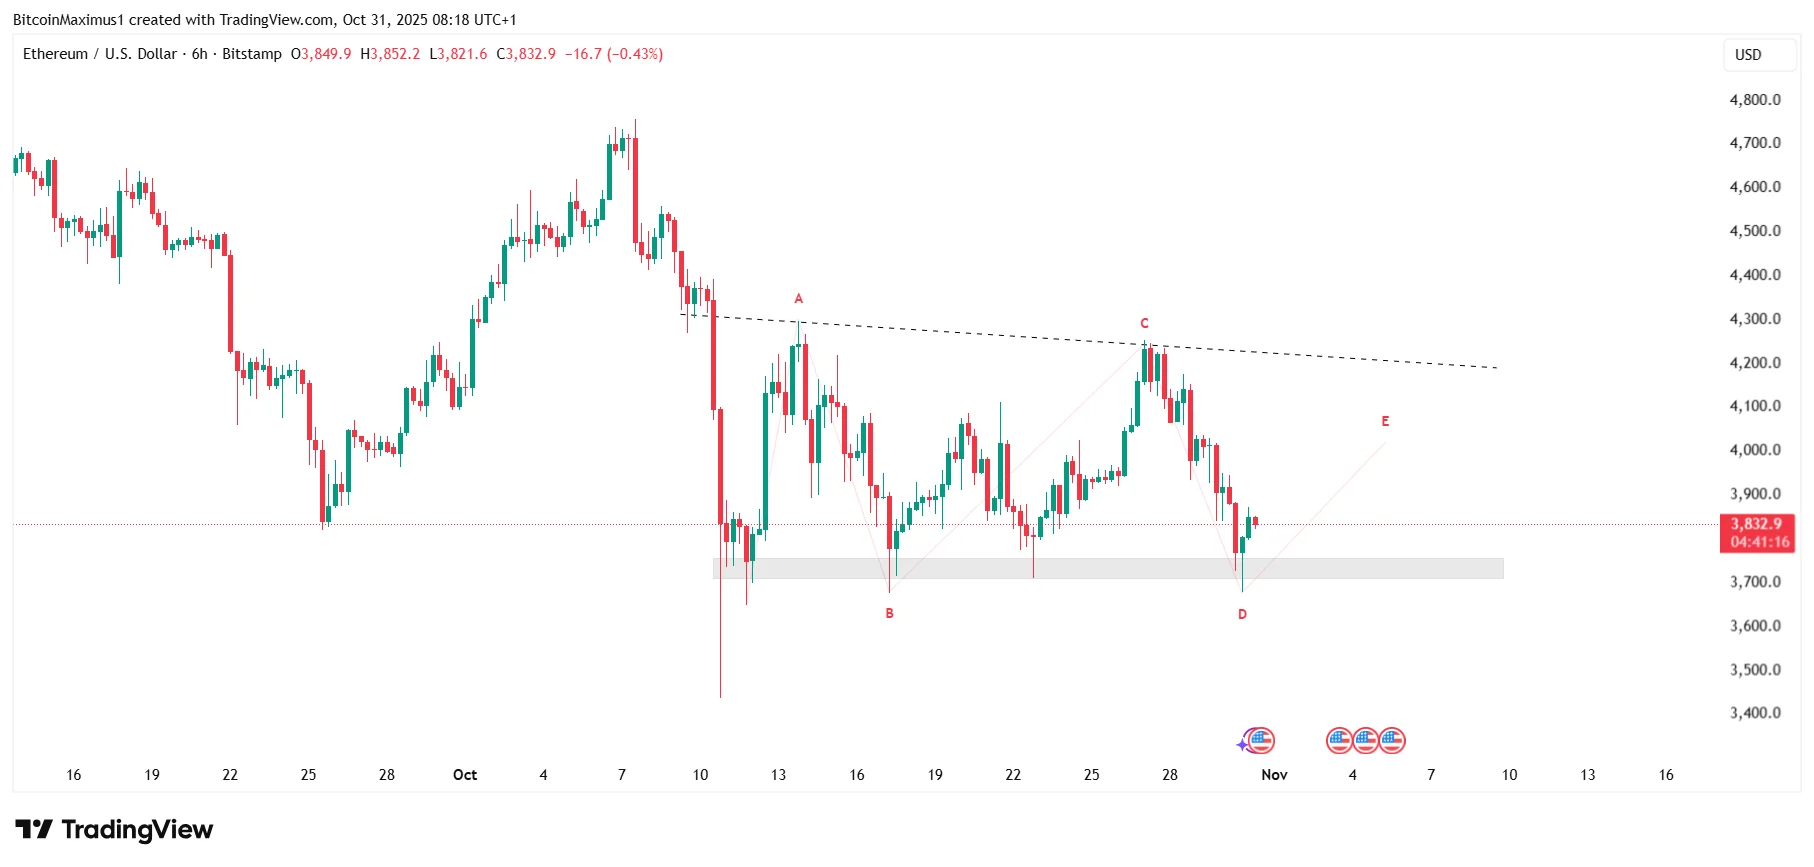
The six-hour chart shows that the price of Ethereum is more likely to break down than move to new highs in the short term.
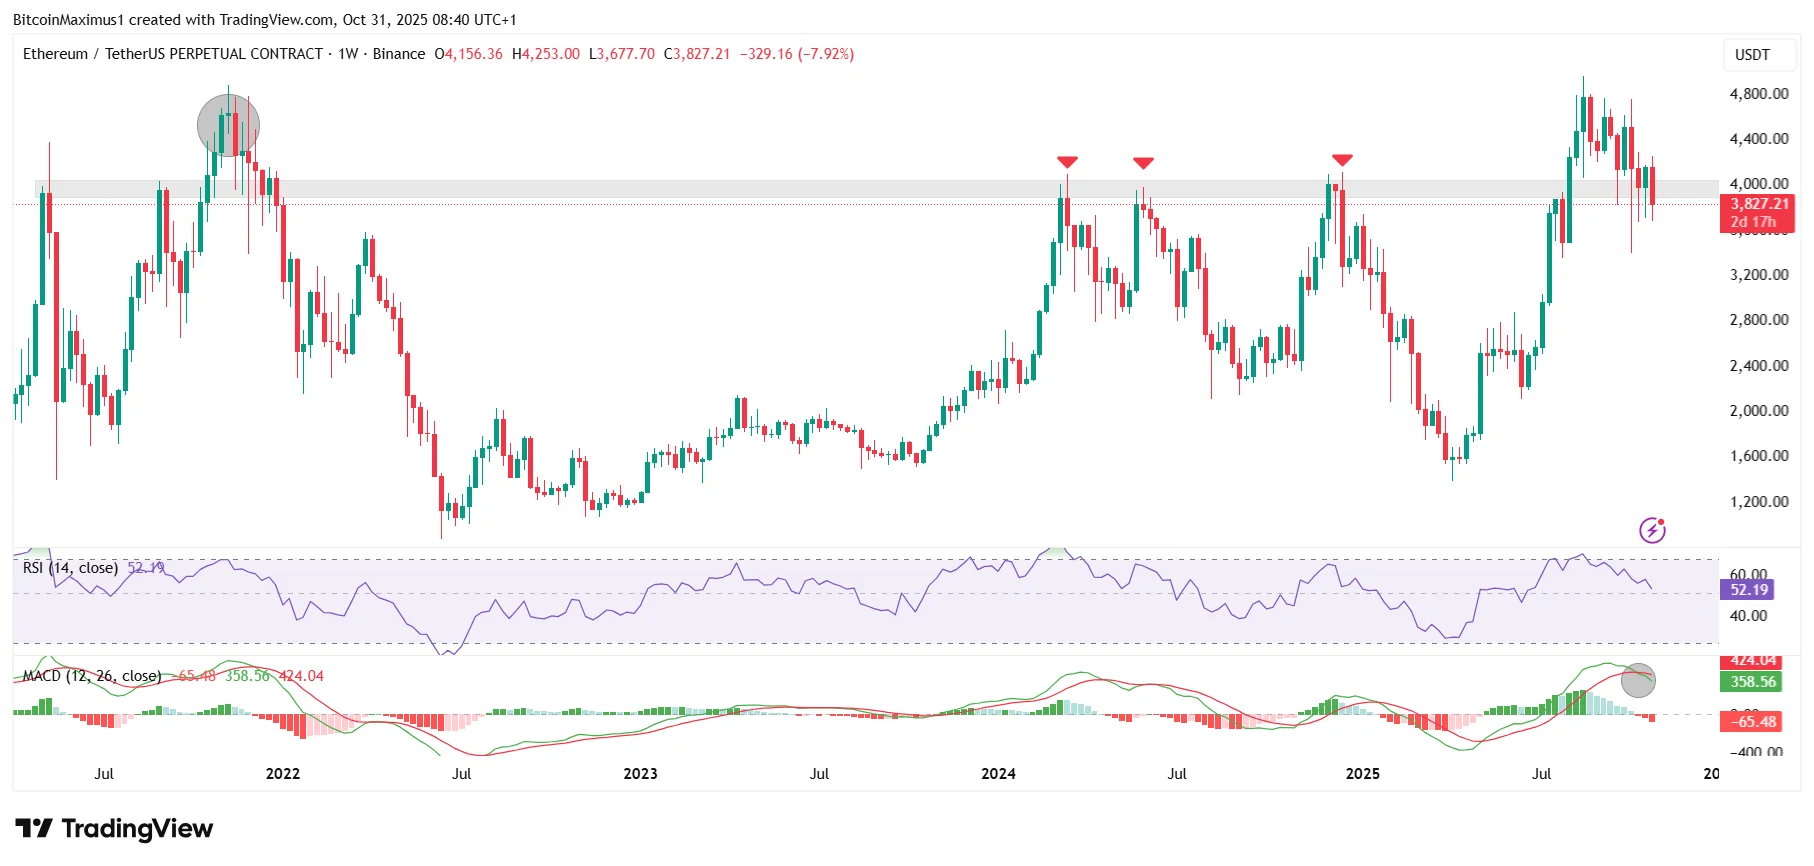
Momentum indicators also point to a downward movement.
The Relative Strength Index (RSI) is declining and is nearly below 50, while the Moving Average Convergence/Divergence (MACD) made a bearish cross (black circle).
Combined with the short-term readings, the weekly chart confirms the bearish Ethereum prediction and suggests the price will break below $3,800 and fall to new lows.
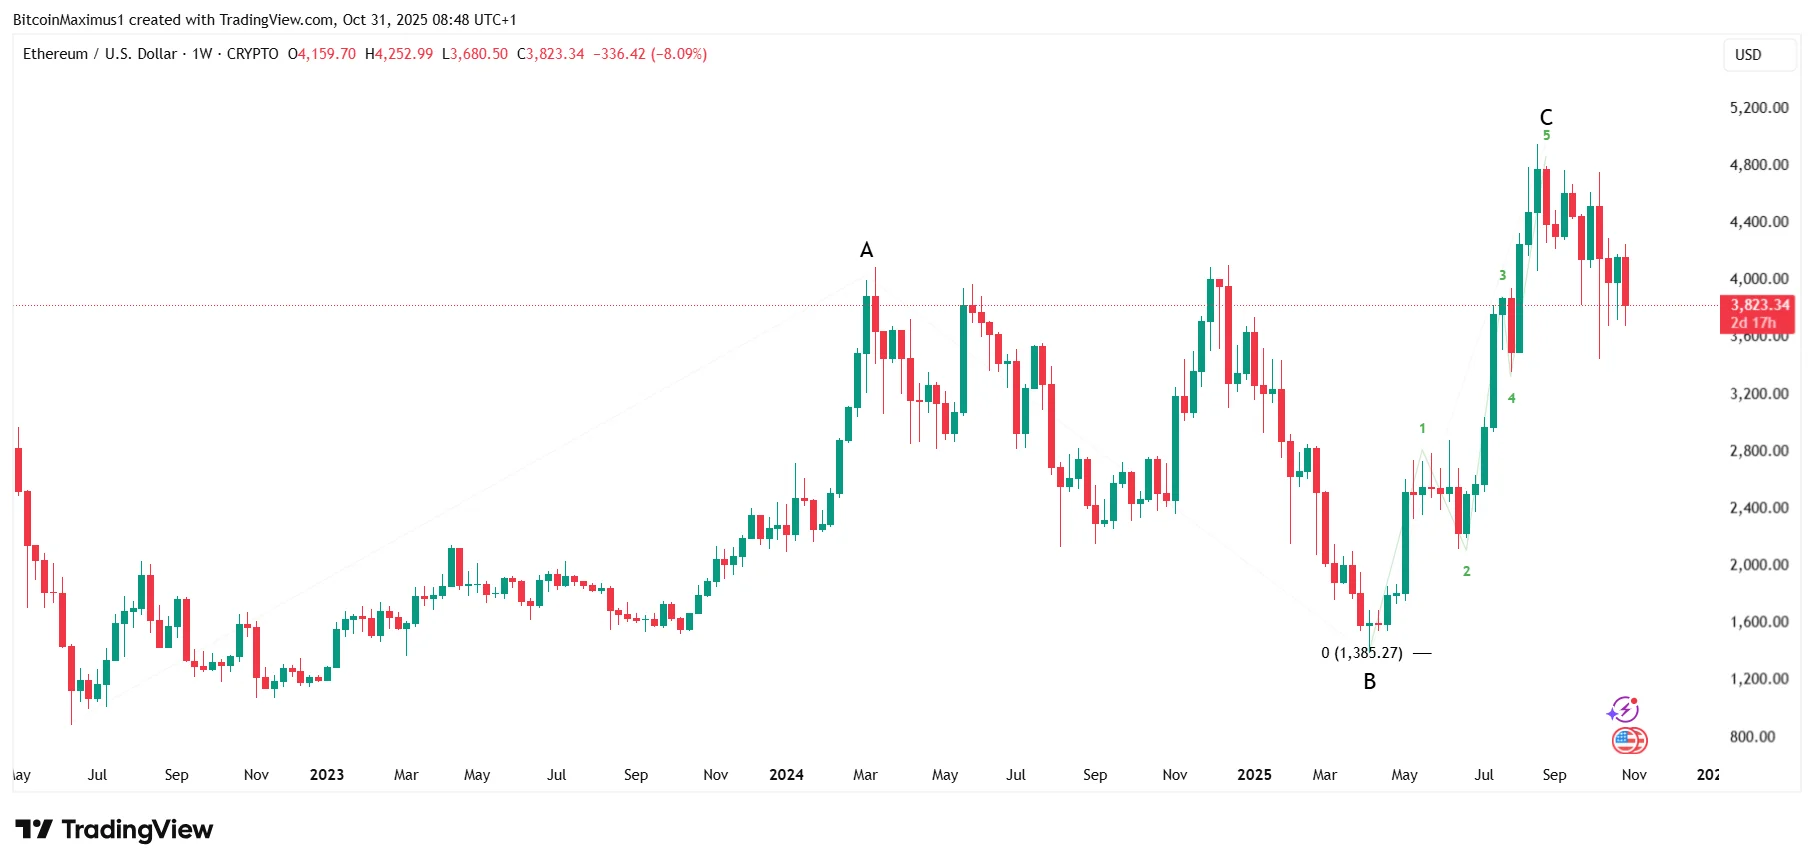
The long-term wave count also aligns. According to the count, Ethereum has completed an A-B-C corrective structure since the June 2022 low.
This means that the entire rally this cycle is corrective.
Wave C has ended, showing a completed five-wave upward movement (green).
If this is the case, the Ethereum price has already started the next portion of its downward movement, eventually taking it to new lows.
Hence, both the weekly and daily time frame predictions are bearish, suggesting that the Ethereum price will continue to decrease.
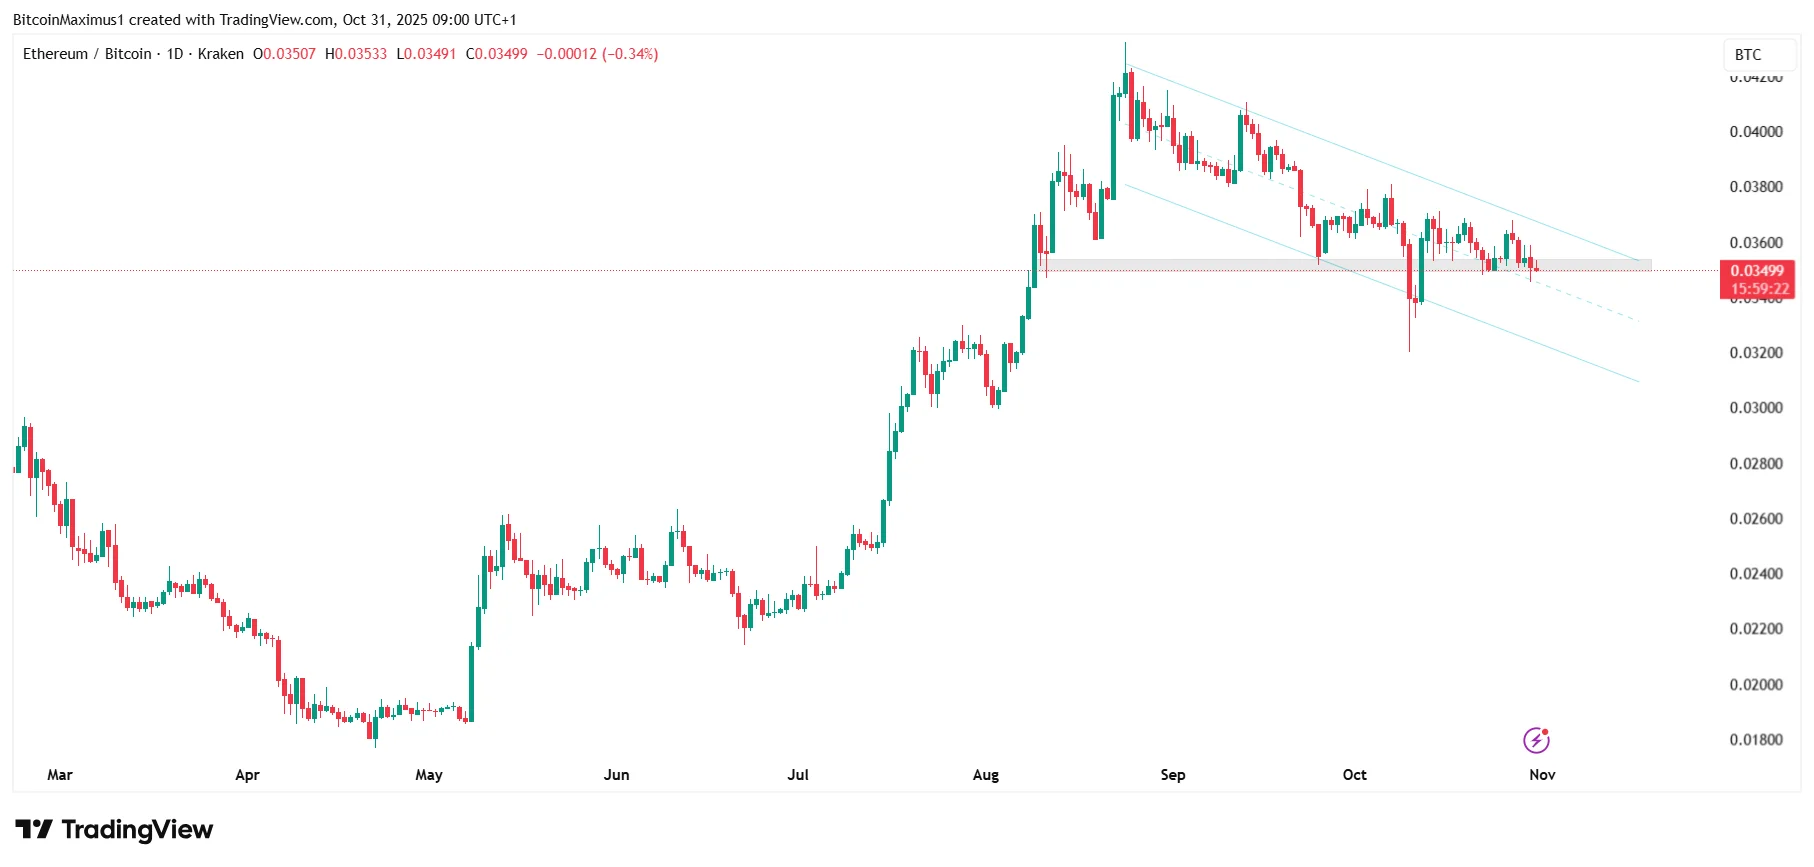
Ethereum to Bitcoin
The Ethereum to Bitcoin chart is more hopeful than the ETH to USDT counterpart.
The primary reason for this is that the price of ETH has decreased within a descending parallel channel since reaching a high of ₿0.043 on Aug. 24.
These channels typically contain corrective movements, and unlike the Ethereum to USDT case, the ETH to BTC price trades in the upper portion of the channel.
The bearish case to this comes from the fact that the price of Ethereum risks breaking down from the ₿0.035 horizontal support area.
Doing so will open the door to a decline toward ₿0.031 and possibly much lower.
So, while the Ethereum to Bitcoin prediction is more bullish than its USDT counterpart, it is still inconclusive about whether the price will break out.
Ethereum Sentiment
Despite numerous bearish signs, sentiment for Ethereum on X remains relatively positive.
Several well-known traders have a bullish view of the price movement and believe Ethereum is creating an accumulation pattern before a massive breakout.
Crypto GEMs outlined a Wyckoff Accumulation chart, showing that Ethereum is preparing for the final spring, which will take it to a new all-time high price above $8,000.
One of the most famous Ethereum bulls, Tom Lee, believes that Ethereum will reach $12,000 to $16,000 by the end of the year.
Some even mention the positive news about megaETH Layer-2 and its potential effect on the Ethereum price in the future.
Mikybull utilized a fractal with the Gold price to predict a significant Ethereum increase, which leads to a parabolic rally and new highs.
Two other bullish predictions either mention the recent retest of the $3,800 support area or compare Ethereum’s price to the previous bullish cycle, which saw it near its final, parabolic stage that led to new highs.
Nevertheless, despite the bullish sentiment, Ethereum’s technical analysis gives a clearly bullish prediction for the rest of the year and 2026.
Final Thoughts
While social sentiment remains optimistic, with prominent analysts calling for a parabolic breakout, the charts tell a different story.
Short- and long-term signals lean bearish unless Ethereum can reclaim critical resistance levels and close above $3,950.
Until then, the risk of a deeper correction remains high despite the bullish Ethereum narrative dominating crypto circles.
Disclaimer:
The information provided in this article is for informational purposes only. It is not intended to be, nor should it be construed as, financial advice. We do not make any warranties regarding the completeness, reliability, or accuracy of this information. All investments involve risk, and past performance does not guarantee future results. We recommend consulting a financial advisor before making any investment decisions.
Valdrin Tahiri is a cryptocurrency analyst and reporter at CCN, specializing in technical analysis with a focus on Elliott Wave theory, on-chain metrics, and fundamental research. He brings over seven years of experience in the crypto space as both a trader and writer.
He discovered cryptocurrencies in 2017 while earning his MSc in Financial Markets at the Barcelona School of Economics, which sparked a deep interest in blockchain and market dynamics. Since then, he’s contributed to top crypto outlets like BeInCrypto and CoinGape.
Valdrin also served as Community Manager of BeInCrypto’s Telegram group for three years, helping grow it into one of the largest crypto communities worldwide. His expertise in market structure and price patterns allows him to break down complex trends into clear, actionable insights.
He’s published thousands of articles covering altcoins, Bitcoin cycles, and macro trends.