ETH consolidates below $3,200, yet long-term patterns suggest this may be another accumulation before breakout phase | Credit: Hameem Sarwar
Share
Key Takeaways
ETH is consolidating and echoing past accumulation phases from 2017 to 2020.
ETH/BTC is stabilizing near long-term support, suggesting downside exhaustion
Short-term prices remain range-bound, but the long-term structure favors a breakout.
Ethereum’s (ETH) price has surged over 105,000% since its launch
However, at the time of writing, traders are obsessing over $100 daily swings. Yet the bigger story is its historical performance.
For those unfamiliar, Early Initial Coin Offering (ICO) buyers paid about $0.31 per ETH.
Since then, ETH’s price has surged roughly 105,850%. That gain tracks Ethereum’s shift from a whitepaper to a core settlement layer for the internet.
Now the market is stuck in a familiar lull. ETH has been trading in a tight $2,860-$3,030 range.
To short-term traders, it feels like dead money. However, cycle watchers recognize the pattern. Similar sideways phases showed up in late 2017 and mid-2020.
Price went flat for weeks. Then it broke hard once positioning reset and volatility returned.
But will it be the same this time? Let’s evaluate it.
Analyzing Ethereum’s Fractal of Patient Capital
Today’s price action echoes the “ghost windows” of 2016 and 2019.
Back then, markets looked dead on the surface. Yet on-chain growth kept accelerating underneath. As a result, patient capital kept building positions while impatient money gave up.
Now the same setup is forming in relative terms. The ETH/BTC ratio has slipped back to a key pivot near 0.033, a level many analysts consider a long-term support.
When ETH/BTC has tagged this zone in prior cycles, it often marked exhaustion in the downtrend. Then it triggered the next phase: a rotation out of Bitcoin dominance and back into Ethereum.
However, for most of this cycle, ETH’s price has struggled to outperform Bitcoin. Yet, the recent performance of the top two cryptos suggests they are in sync.
ETH/BTC Analysis
Ethereum’s performance against Bitcoin is showing early signs of stabilization after a prolonged downtrend, with the weekly ETH/BTC chart highlighting a key structural shift.
As seen below, the price has reclaimed and is holding above the long-term horizontal support around 0.032 to 0.033 BTC.
This area, which previously acted as a major demand zone, now appears to be absorbing selling pressure.
The sharp rebound from the mid-2025 lows broke the prior descending channel, but momentum has since cooled, leading to a tighter consolidation within a smaller downward-sloping range just below the former resistance zone near 0.043-0.045 BTC.
This compression suggests the market is coiling, as repeated defenses of support contrast with lower highs that continue to cap upside.
A weekly close above the descending trendline would likely open the door for a broader mean reversion toward the 0.050 to 0.060 BTC region.
However, a loss of the green support zone would signal that Ethereum remains structurally weak versus Bitcoin.
2017 to 2019: Ghost Town
Ethereum’s last major cycle can be traced through four clear phases.
In 2017, ETH broke into the mainstream. It started the year near $8 and climbed above $700 by December as the ICO boom exploded.
Most new tokens launched as ERC-20s, so market participants had to buy ETH to participate. Demand surged, and the feedback loop strengthened.
That momentum spilled into early 2018. ETH extended the move and peaked near $1,400 in January. However, the cycle then flipped as speculation cooled and liquidity dried up.
Next came the 2018–2019 crypto winter. The ICO bubble burst, and many projects sold ETH to fund operations. As a result, Ethereum fell harder than the broader market at times.
By late 2018, price had collapsed into the double digits, and 2019 mostly became a grind—brief rebounds, then more sideways action as confidence slowly rebuilt.
Year
Start Price (Approx)
End Price (Approx)
Context
2017
$8
$750
ICO Boom
2018
$750
$130
The Great Crash
2019
$130
$130
Sideways/Accumulation
2020
$130
$740
DeFi Summer / ETH 2.0
2021
$740
$3,700
NFT Mania / All-Time Highs
From Accumulation to Blow-Off Top (2020–2021)
Then, 2020 reset the board. ETH’s price plunged again during the March COVID panic, dropping to roughly $90.
Yet the recovery arrived quickly. DeFi took off, activity surged, and Ethereum regained its role as the center of crypto risk-taking.
By year-end, ETH was back near $700, setting the stage for the next leg higher.
Finally, 2021 delivered the moonshot. ETH’s price reclaimed its prior highs early in the year and kept climbing as NFTs went mainstream and institutions broadened exposure.
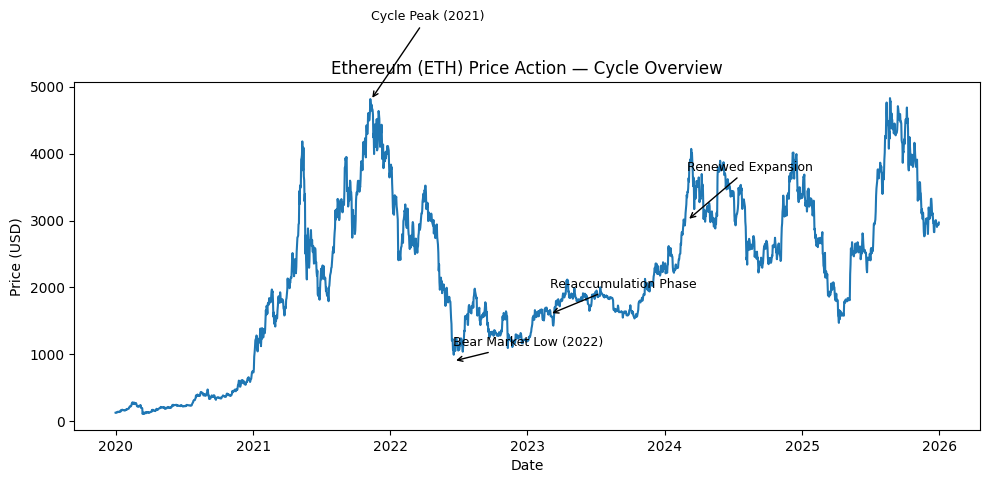
At the same time, the London upgrade introduced fee burning, reinforcing the supply narrative. The rally peaked in November 2021 at around $4,878, cementing Ethereum’s transition from a speculative altcoin into core crypto infrastructure
Bear Market Reset (2022)
The subsequent decline unfolded as a prolonged downtrend, with ETH giving back a significant portion of its gains in a drawdown that visually resembles prior crypto bear cycles.
Historically, this type of phase tends to wash out leverage and reset positioning before a new base forms.
Range-Bound Basing (2023)
By 2023, the series transitions into a broad sideways structure, with price oscillating in a tighter band relative to the prior year.
Market analysts often interpret this as re-accumulation: a period where volatility compresses, and the market builds “stored energy” for a larger move.
| Credit: CCN Analysis Team
ETH Recovery, Rising Volatility (2024–2025)
ETH then re-accelerates into 2024 and 2025, pushing back into higher price zones and revisiting levels that previously acted as major resistance.
The structure appears choppier than the 2021 run — a pattern traders frequently associate with heavier derivatives activity and faster rotation between risk-on and risk-off conditions.
In practice, this level acts like a final stress test. It forces late longs to capitulate. It drains leverage and weak hands from the system.
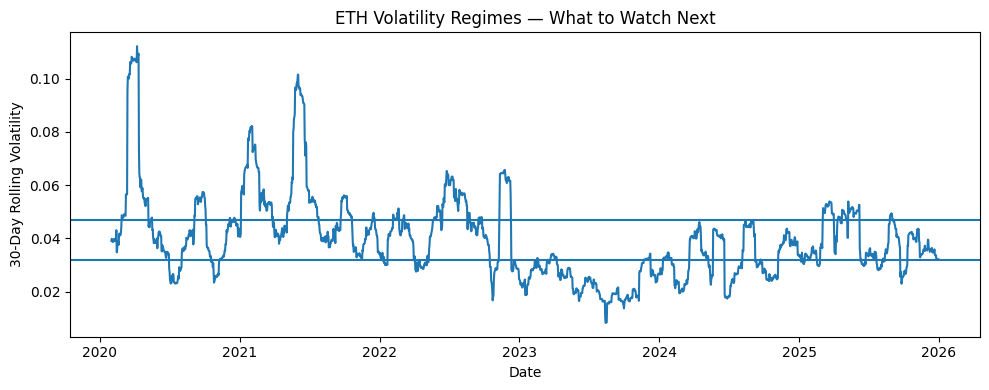
ETH 30-Day Volatility | Credit: CCN Analysis Team
At some point, ETH showed extreme volatility alongside rising price. But the last few months have been tough, suggesting the cryptocurrency could still be in a prolonged period of stress.
ETH Price in 2026
Year-to-date (YTD), Ethereum’s price has dropped 0.32%. So, it trades near the same region where it started the year.
By the look of things, Ethereum appears to be in a familiar phase—one that closely resembles the period between 2017 and 2020.
Back then, the blockchain went through multiple upgrades and experienced significant accumulation.
Network development accelerated, and long-term holders built positions. Yet, despite those fundamentals, ETH’s price stayed low for an extended period before finally breaking out.
A similar dynamic is playing out today. We can draw a parallel with the Tom Lee–led BitMine accumulation.
Although the firm now holds billions of dollars’ worth of ETH, that demand has not yet translated into sustained upside.
Notably, ETH’s price has still failed to reclaim the $5,000 psychological level.
On the development side, Ethereum continues to move forward. The network completed the Pectra and Fusaka upgrades last year.
In 2026, attention is shifting toward protocol-level privacy through the upcoming Glamsterdam and Heze–Bogota milestones.
This roadmap mirrors earlier cycles. In the past, Ethereum rolled out Byzantium (2017), Constantinople and St. Petersburg (2019), Istanbul (2019), and later Muir Glacier and the Beacon Chain (2020).
At the time, price lagged development. Shortly afterward, however, ETH entered a powerful explosion phase.
Therefore, if history rhymes, Ethereum’s price may once again be in a build-and-accumulate window.
In this case, the chart below shows that major expansions in the number of addresses holding at least 10,000 ETH tend to precede or accompany sustained bull markets rather than short-term tops.
In past cycles, steady accumulation by these large wallets during periods of price consolidation or weakness was followed by multi-year upside moves.
Prolonged declines in this cohort, on the other hand, usually align with broader bear markets and extended underperformance.
At the time of writing, the balance of this cohort has dropped. This implies that ETH’s price might still be in a consolidation phase for a while.
However, accumulation will likely surge after a multi-year drawdown preceding major breakouts. If this pattern holds, it suggests long-term conviction is returning among large holders.
ETH: Number of Addresses with Balance ≥ 10k | Credit: Glassnode
While short-term volatility is likely to persist, the re-expansion of large ETH balances points to a structurally constructive long-term outlook.
Given the trend over the past years, Ethereum’s price is more likely to rise over the coming years.
ETH Price Short-Term Prediction
In the short term, it does not seem like ETH’s price will break out soon. At the time of writing, Ethereum’s price is still consolidating after its pullback.
Also, the daily chart shows price compressing just above the $2,900 support zone, which aligns with the local range low and the lower boundary of the current rounded consolidation structure.
Repeated rejections below the $3,250 Supertrend and the 0.236 Fibonacci level around $3,170 confirm that sellers remain active on rallies
Furthermore, the inability to break down suggests demand is still absorbing supply at these levels.
Momentum remains soft, as reflected by the Moving Average Convergence Divergence (MACD) rolling over below the zero line.
However, downward pressure is no longer accelerating, hinting at stabilization rather than continuation.
Disclaimer:
The information provided in this article is for informational purposes only. It is not intended to be, nor should it be construed as, financial advice. We do not make any warranties regarding the completeness, reliability, or accuracy of this information. All investments involve risk, and past performance does not guarantee future results. We recommend consulting a financial advisor before making any investment decisions.
Victor Olanrewaju is a crypto analyst and reporter at CCN with deep roots in on-chain research and technical analysis. His crypto journey began in 2017, but it was the 2020 Uniswap airdrop that sparked a full-time pivot into the space.
With a foundation in copywriting, Victor honed his craft creating high-converting content for leading crypto brokers — most notably an XRP price prediction that ranked #1 on Google during the 2021 bull run.
He later joined AMBCrypto in 2022, where he combined storytelling with technical and on-chain analysis to cover key market narratives.
In 2024, he expanded his expertise at BeInCrypto, collaborating with analysts and using tools like Glassnode, Santiment, and IntoTheBlock to break down Bitcoin and altcoin trends.
At CCN, Victor covers the top cryptocurrencies, memecoins, macro shifts, blending real-time insights with deep-dive metrics.
He holds a Bachelor’s degree in Physics from the University of Ibadan, equipping him to simplify complex data for a wide audience. Follow his work or connect on LinkedIn or X.