Ethereum slides 10% to $2,193 as ETF outflows and bearish on-chain signals threaten a sub-$2,000 breakdown. Credit: CCN
Share
Key Takeaways
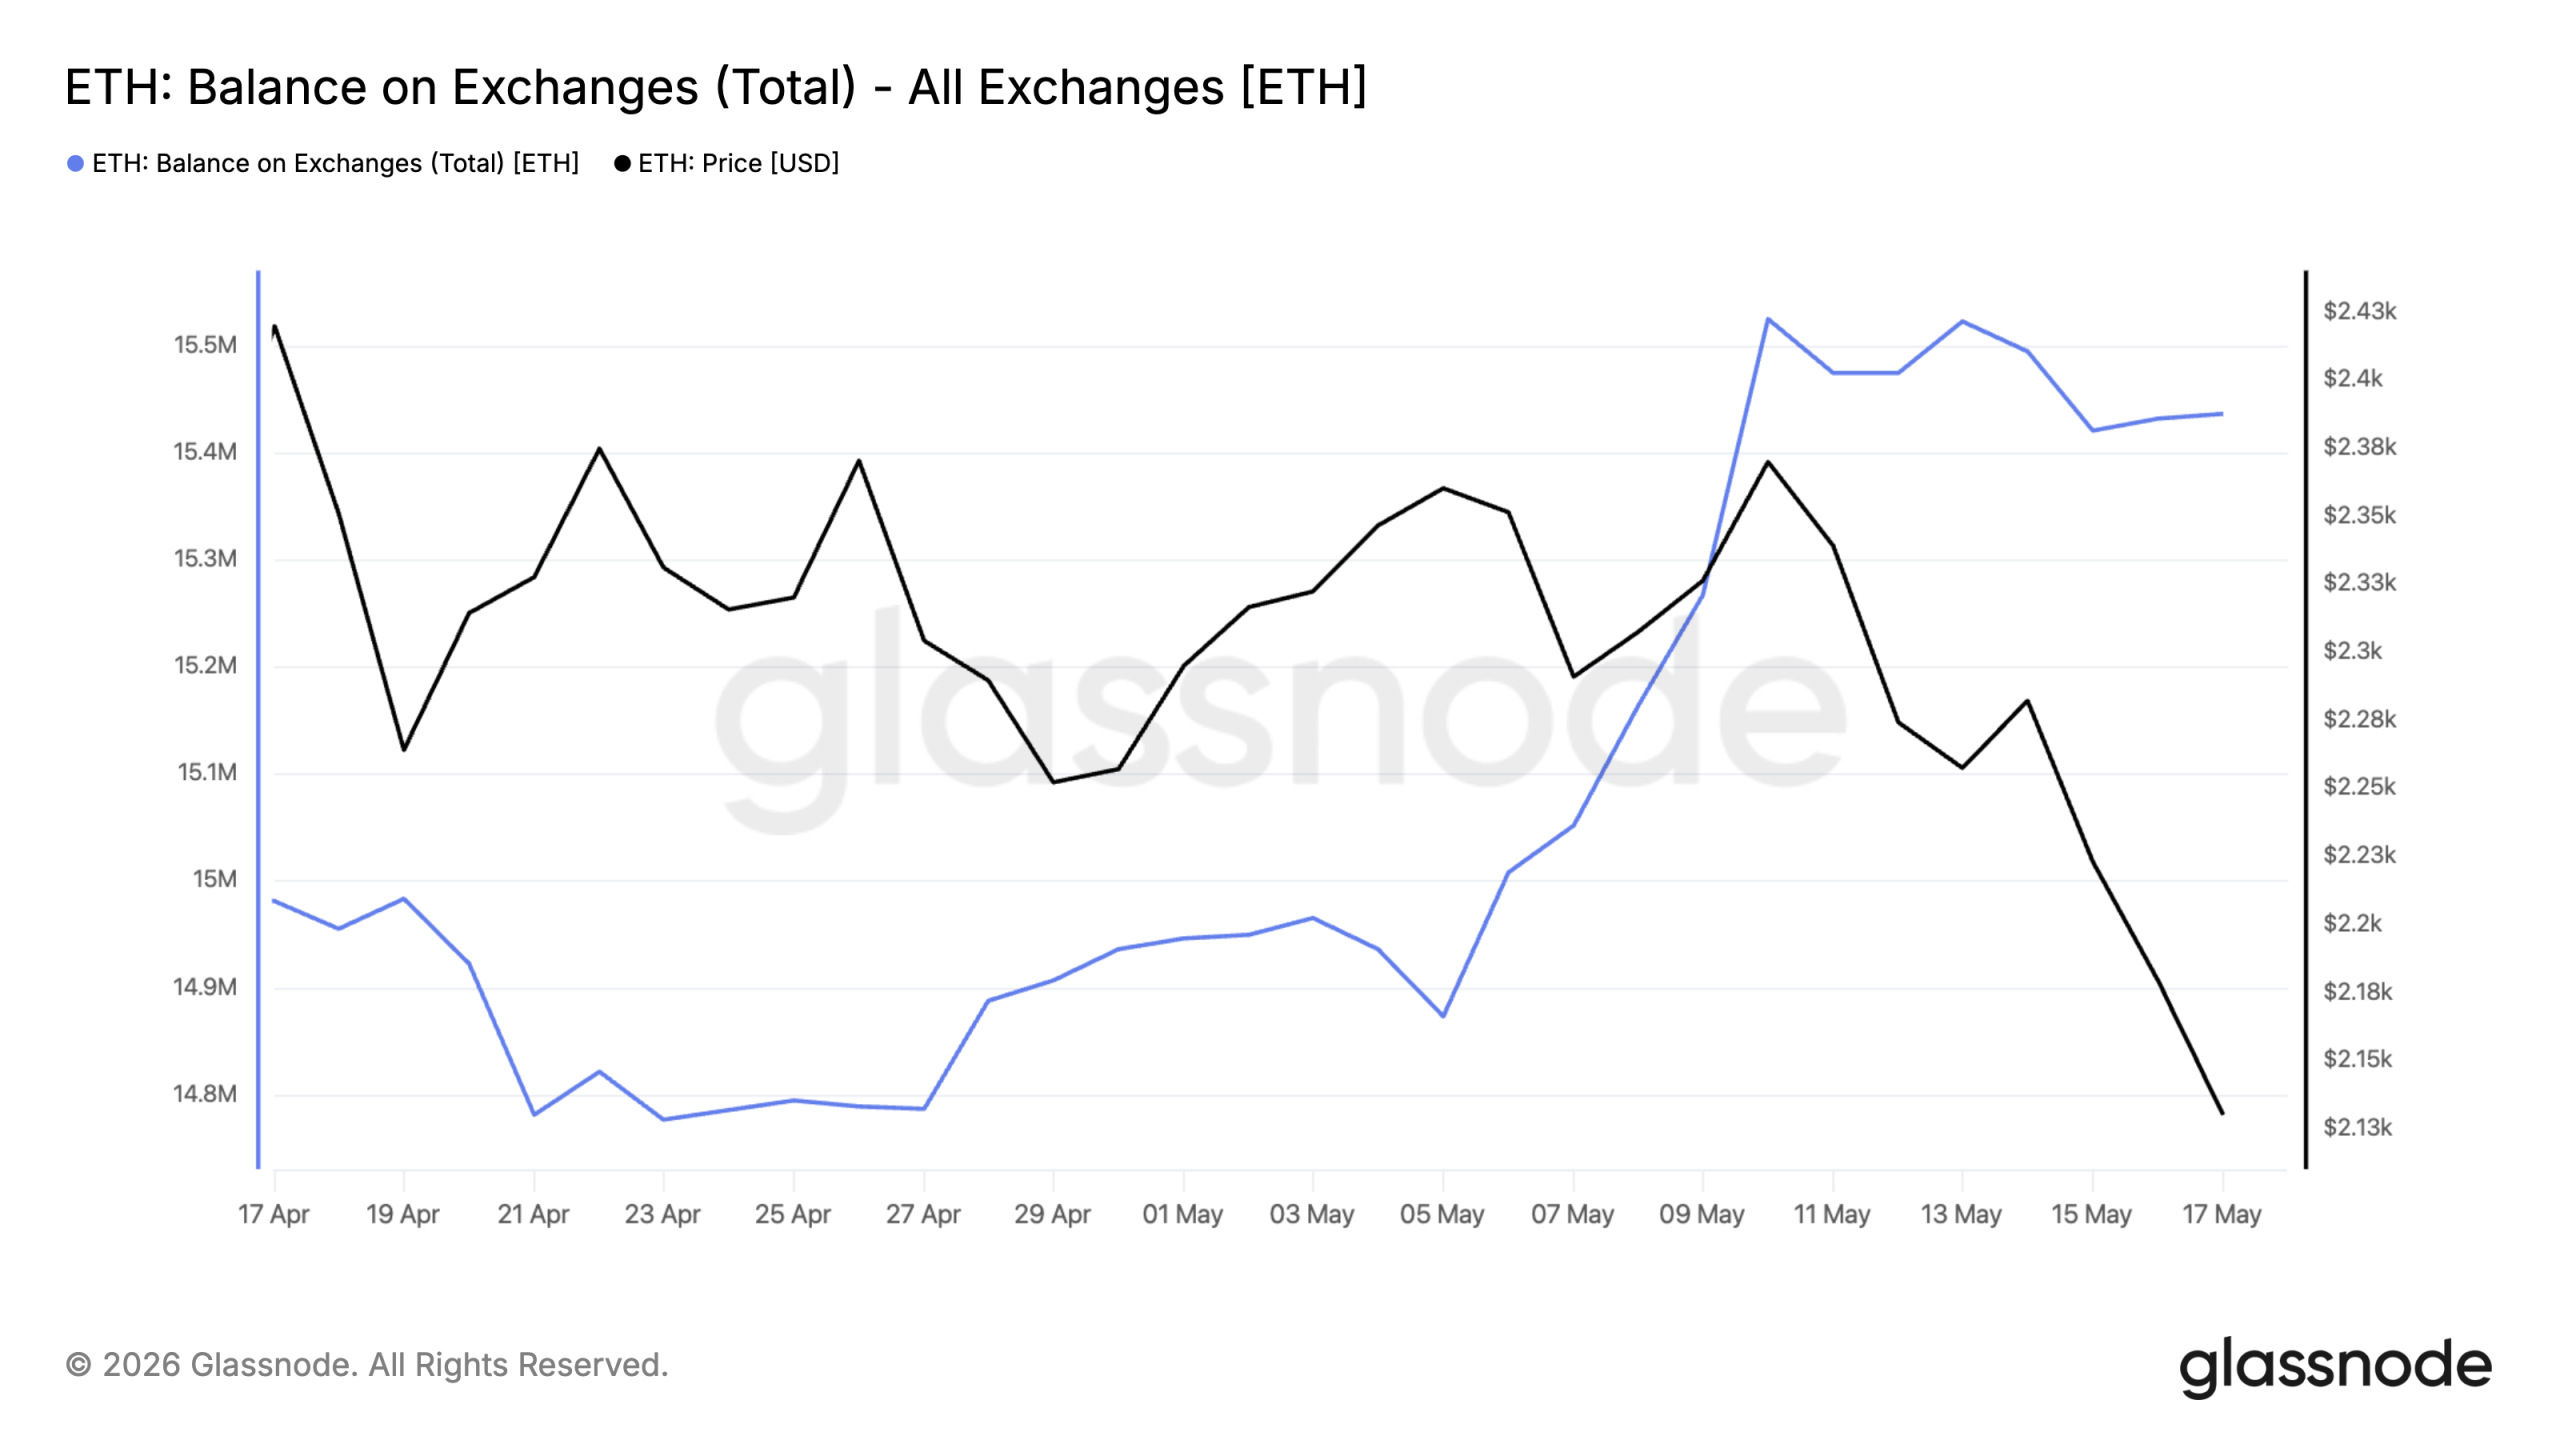
Ethereum has tumbled 10% over the past week to $2,115, with on-chain data from Glassnode showing exchange balances up 4% to 15.43 million ETH — a classic distribution signal as holders move tokens to sell.
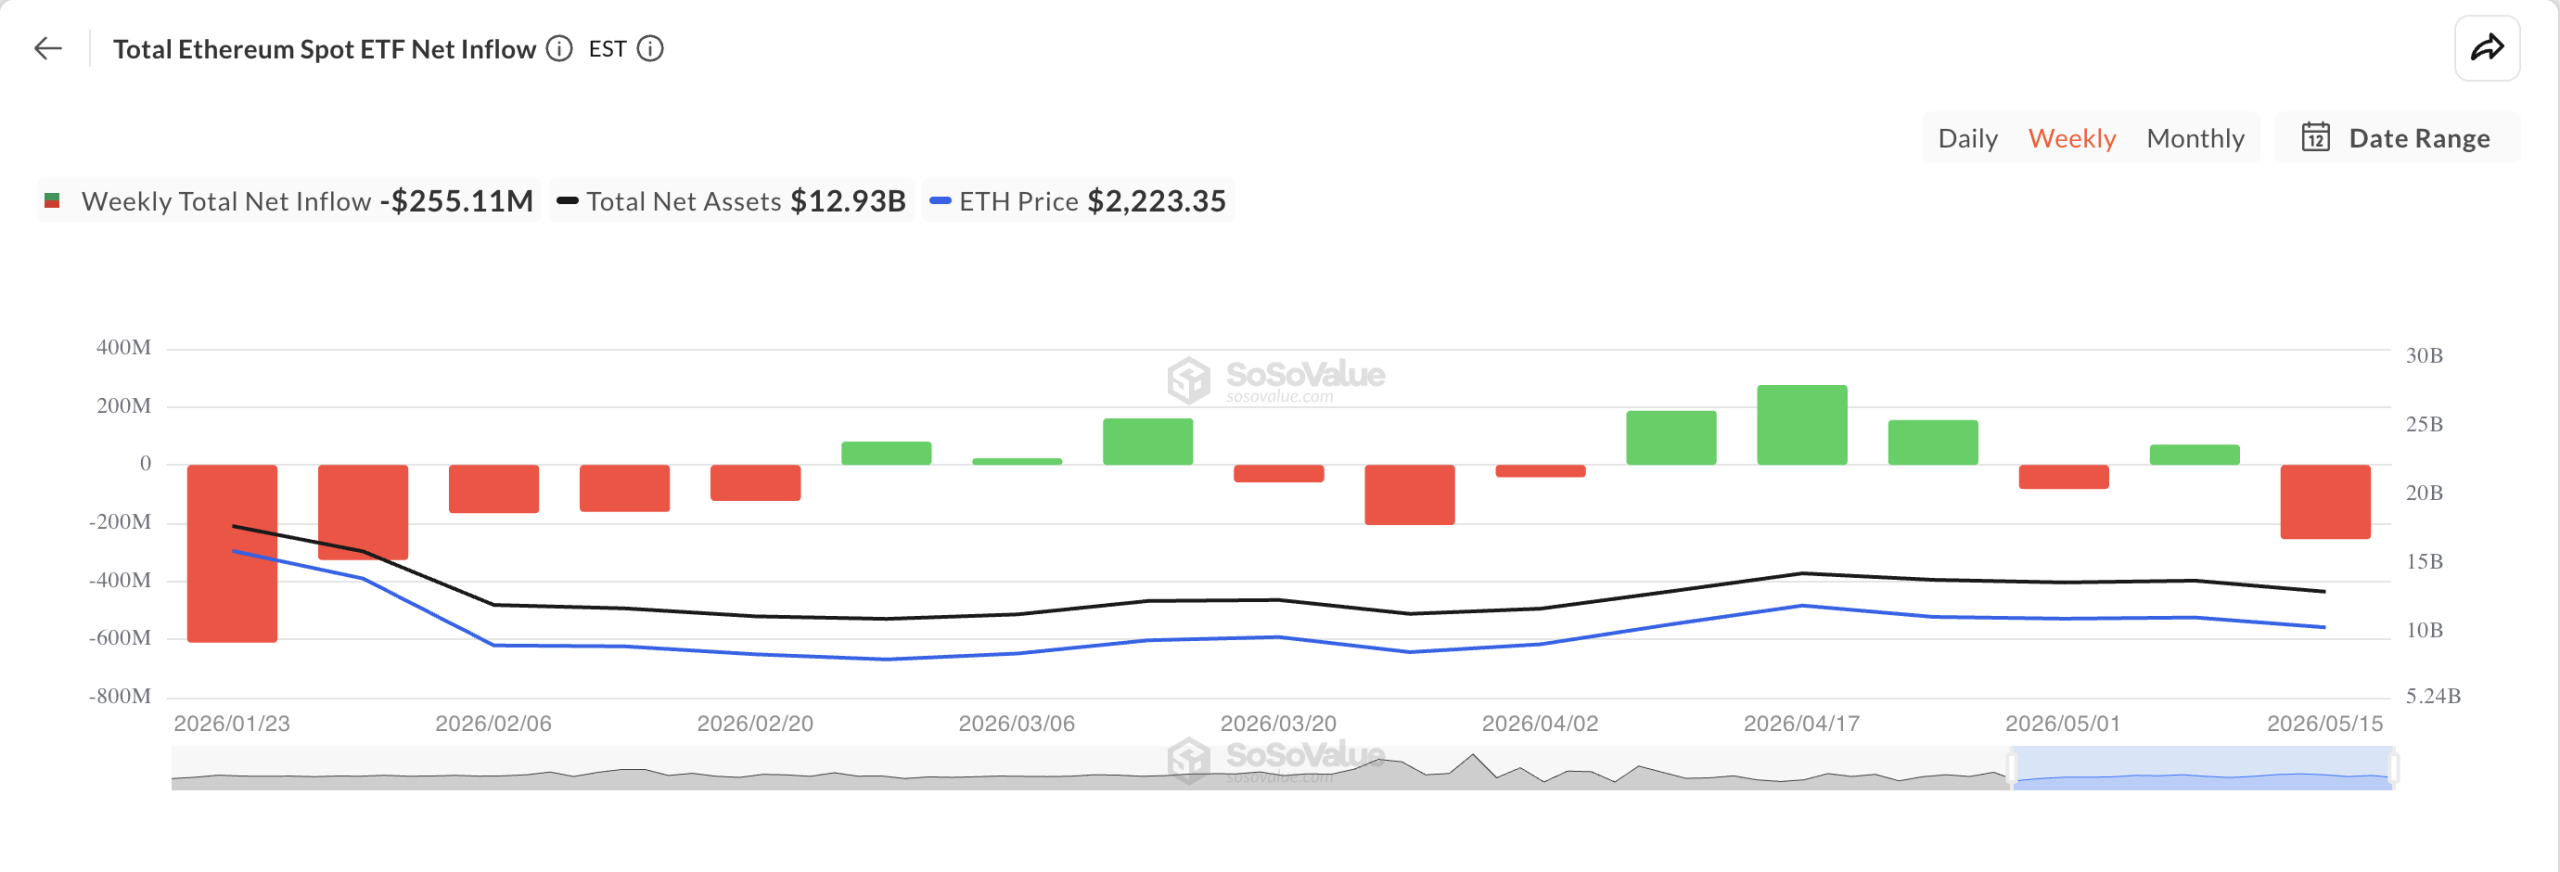
US spot ETH ETFs recorded $255.11 million in net outflows for the week ending May 15, the largest weekly bleed in two months, confirming institutional investors are not buying the dip.
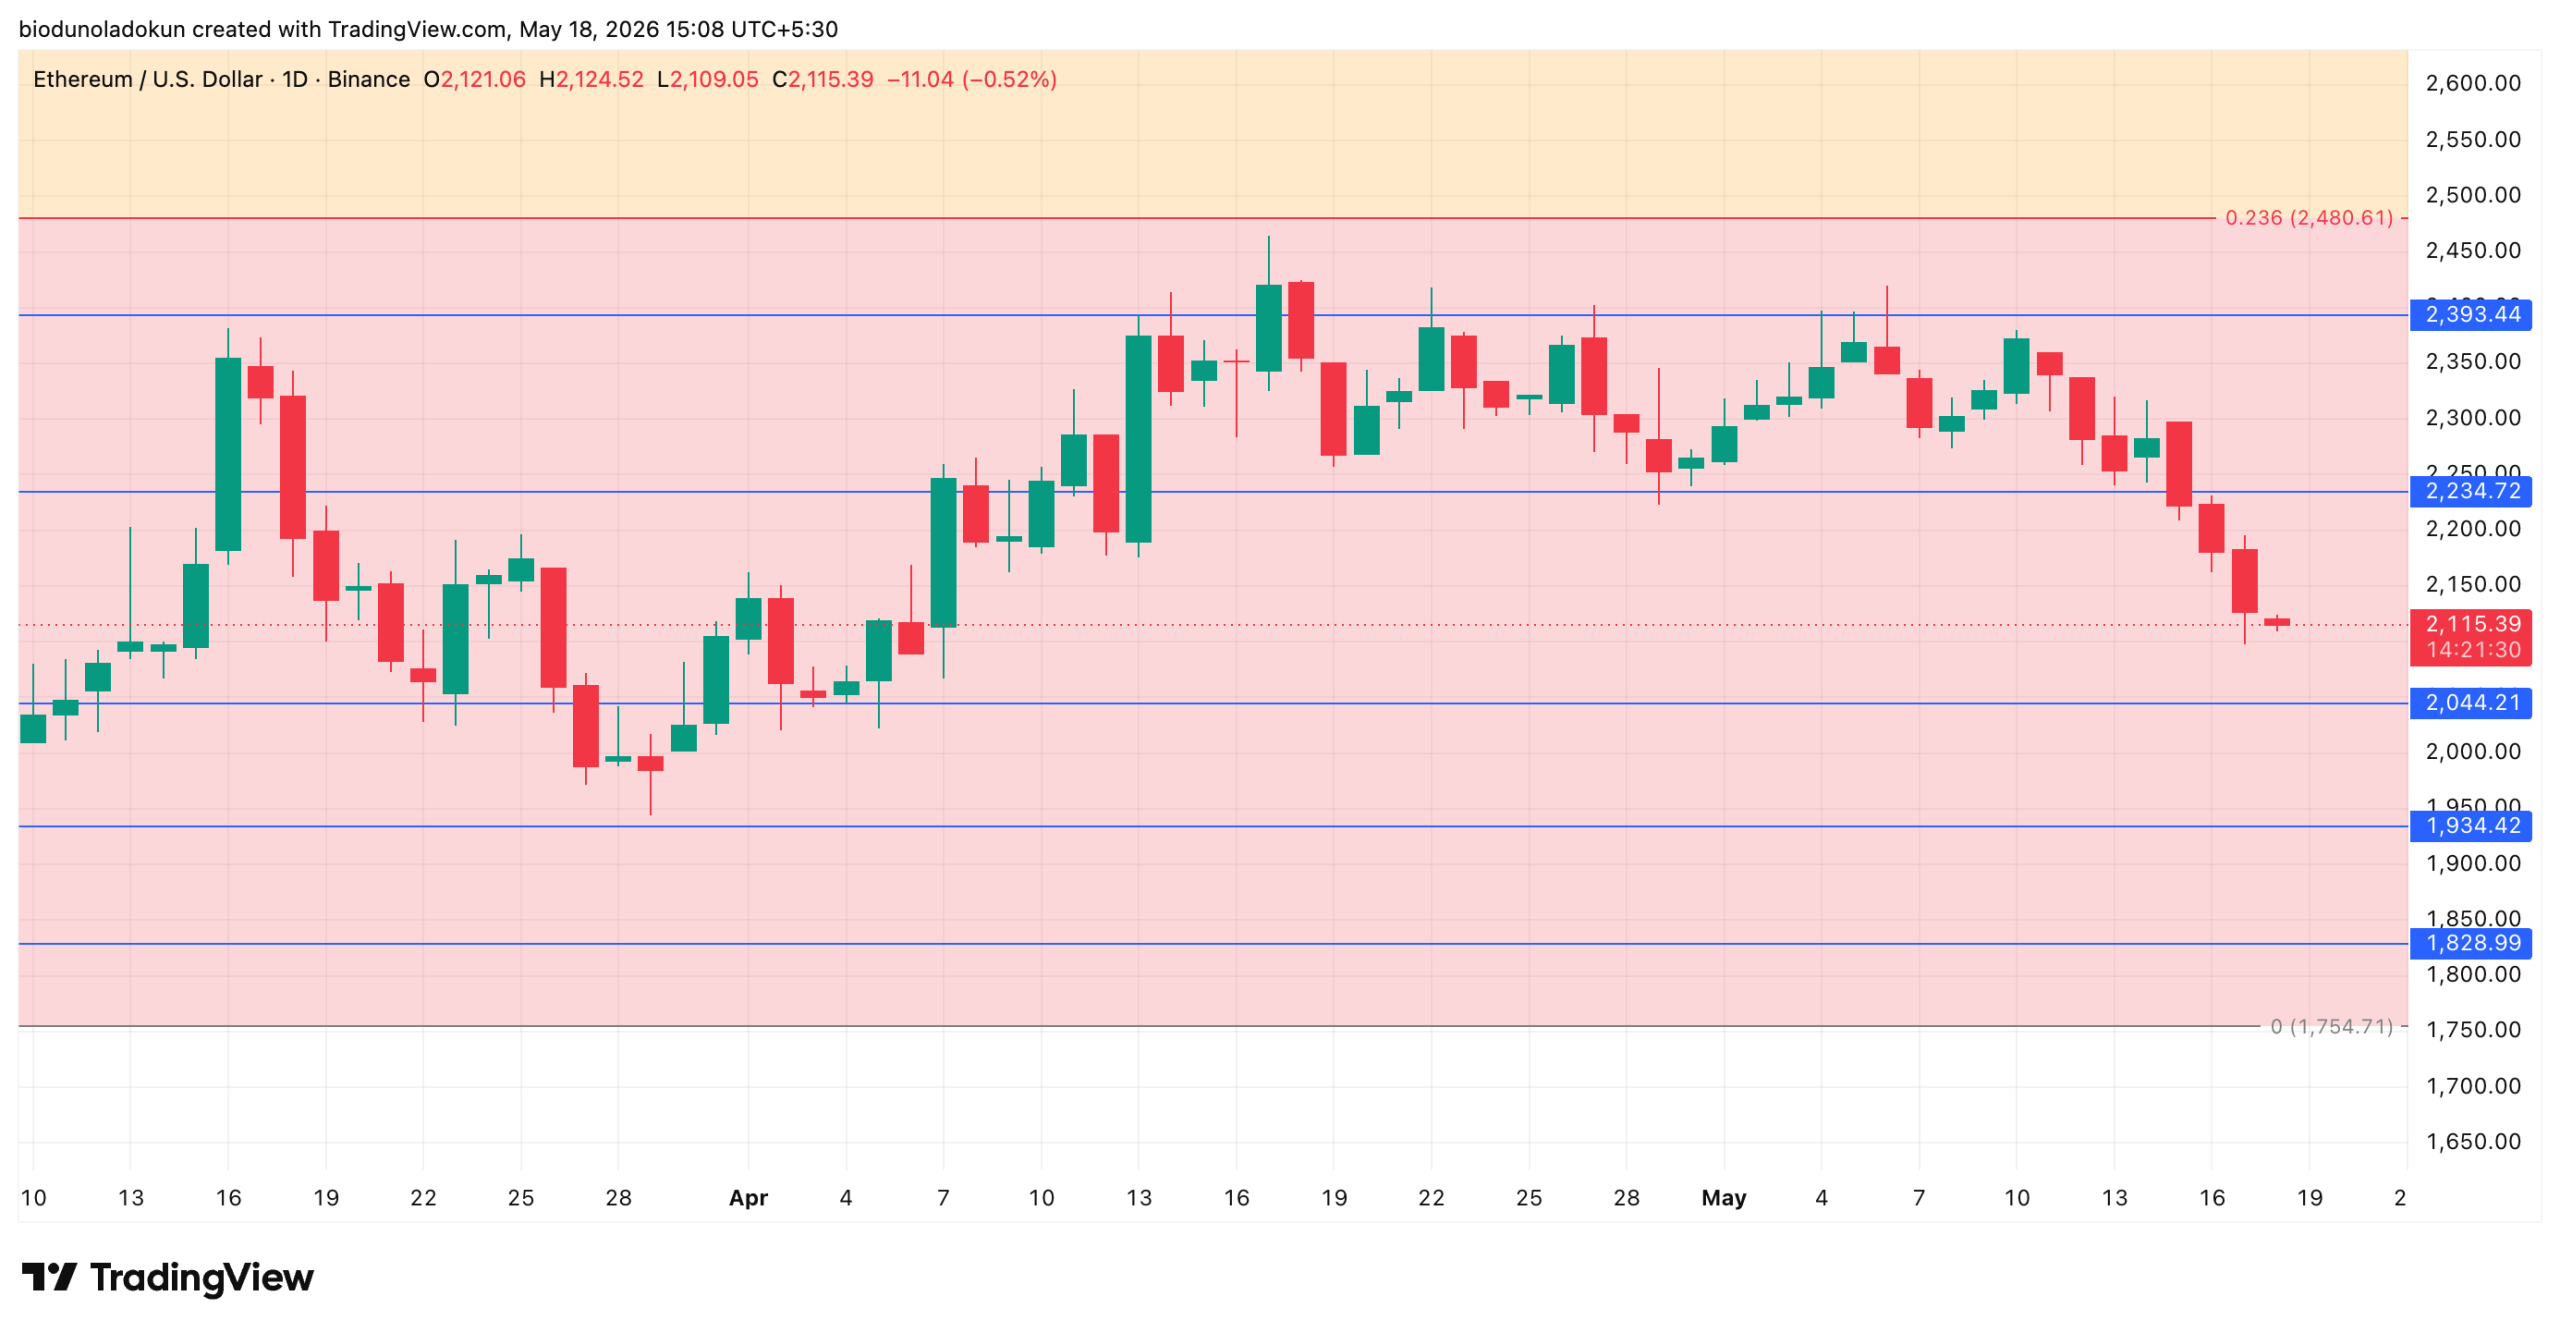
ETH must defend the $2,044 support floor to avoid a deeper drop toward $1,934.
Ethereum’s price has plunged 10% over the past seven days. It currently trades at $2,115 at press time after failing to hold the $2,400 during last week’s session.
The selloff has been worsened by ETH’s tight correlation with Bitcoin, whose price has tumbled back below $80,000, dragging the broader crypto market lower with it.
On-chain and technical data suggest ETH’s problems run deeper than the broader market drawdown, with several signals pointing to further losses ahead.
ETHExchange Activity Signal Distribution
According to Glassnode, ETH balances on centralized exchanges have spiked over the past few weeks, a classic bearish signal.
Per the data provider, the total amount of ETH held across all exchanges stands at 15.43 million at press time, up 4% from 14.78 million ETH recorded on April 21.
When an asset’s exchange balance rockets, especially during periods of price weakness, it signals that holders are moving their tokens from self-custody wallets onto trading platforms, almost always with the intent to sell.
This adds fresh supply to the market, and with demand failing to absorb the inflow, the imbalance could continue to compress ETH lower.
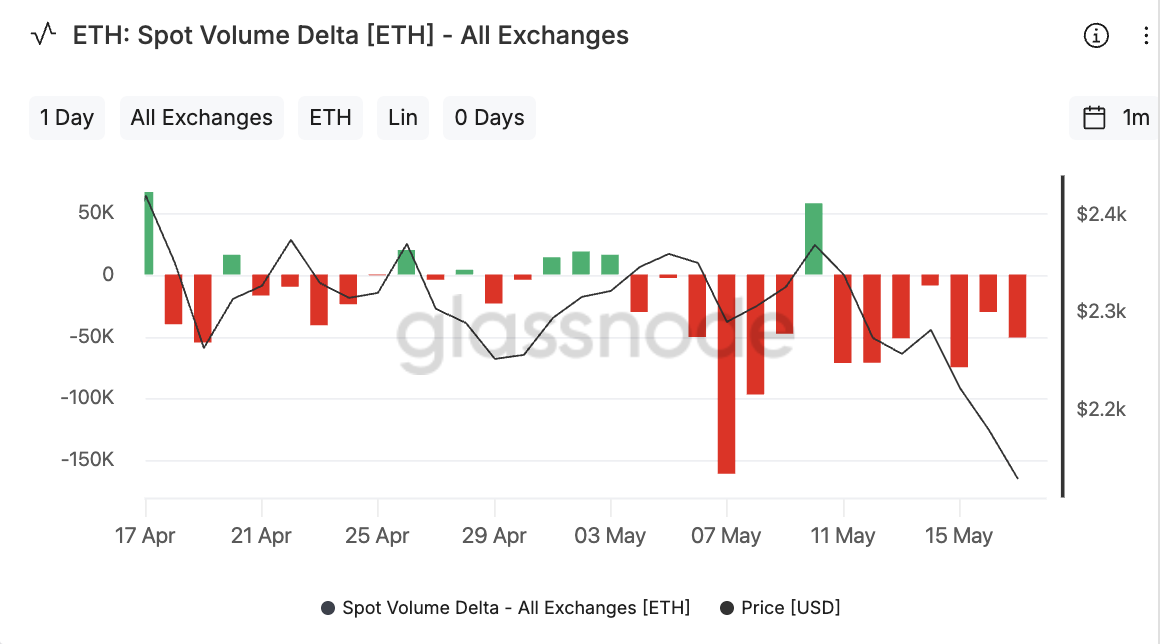
Also, the negative readings from ETH’s Spot Volume Delta confirm the surge in selloffs among spot traders. According to Glassnode data, this metric — which measures the difference between aggressive buying and selling on spot exchanges — has been net negative for most of the past month, with red bars dominating the chart and green bars appearing in only 7 sessions.
When this metric stays negative, it confirms that the daily fight between buyers and sellers continues to favor sellers.
The persistence of red bars even as ETH’S price plummets signals that lower prices are not yet attracting meaningful buy-side interest.
ETH Holders are Underwater
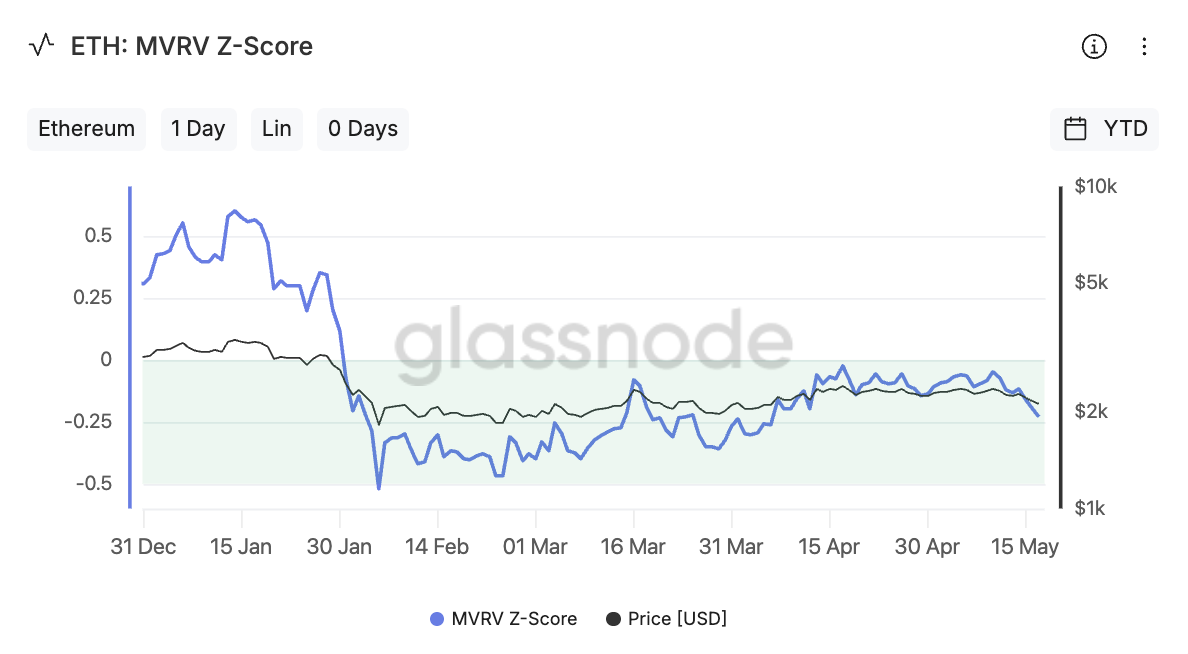
The reason for this decline in buying pressure is not far-fetched. Many ETH holders are currently underwater, sitting on unrealized losses. Readings from the coin’s MVRV Z-Score confirm this.
Per Glassnode, ETH’s MVRV Z-Score has remained below zero since January 30. It currently sits at -0.22, facing downward, after a failed attempt to reclaim positive territory in mid-April.
This metric compares an asset’s market value to its realized value to determine whether the average holder is in profit or at a loss.
A reading below zero means the network is collectively underwater, with the average ETH holder paying more for their tokens than the asset is currently worth.
Spot ETH ETF Outflows Hit Four-Month High
Last week, US spot ETH ETFs recorded their largest weekly net outflows in two months, signaling a sharp drop in institutional appetite.
Per SoSoValue data, capital flight from these products totaled $255.11 million for the week ending May 15, reversing the previous week’s $70.49 million inflow.
Total Ethereum Spot ETF Net Inflow | Credit: SoSoValue
This sharp reversal, combined with ETH’s double-digit price decline over the past week, suggests institutional investors are not buying the dip, a trend that may worsen market sentiment and push the coin’s price lower.
ETH Daily Chart Flashes Red
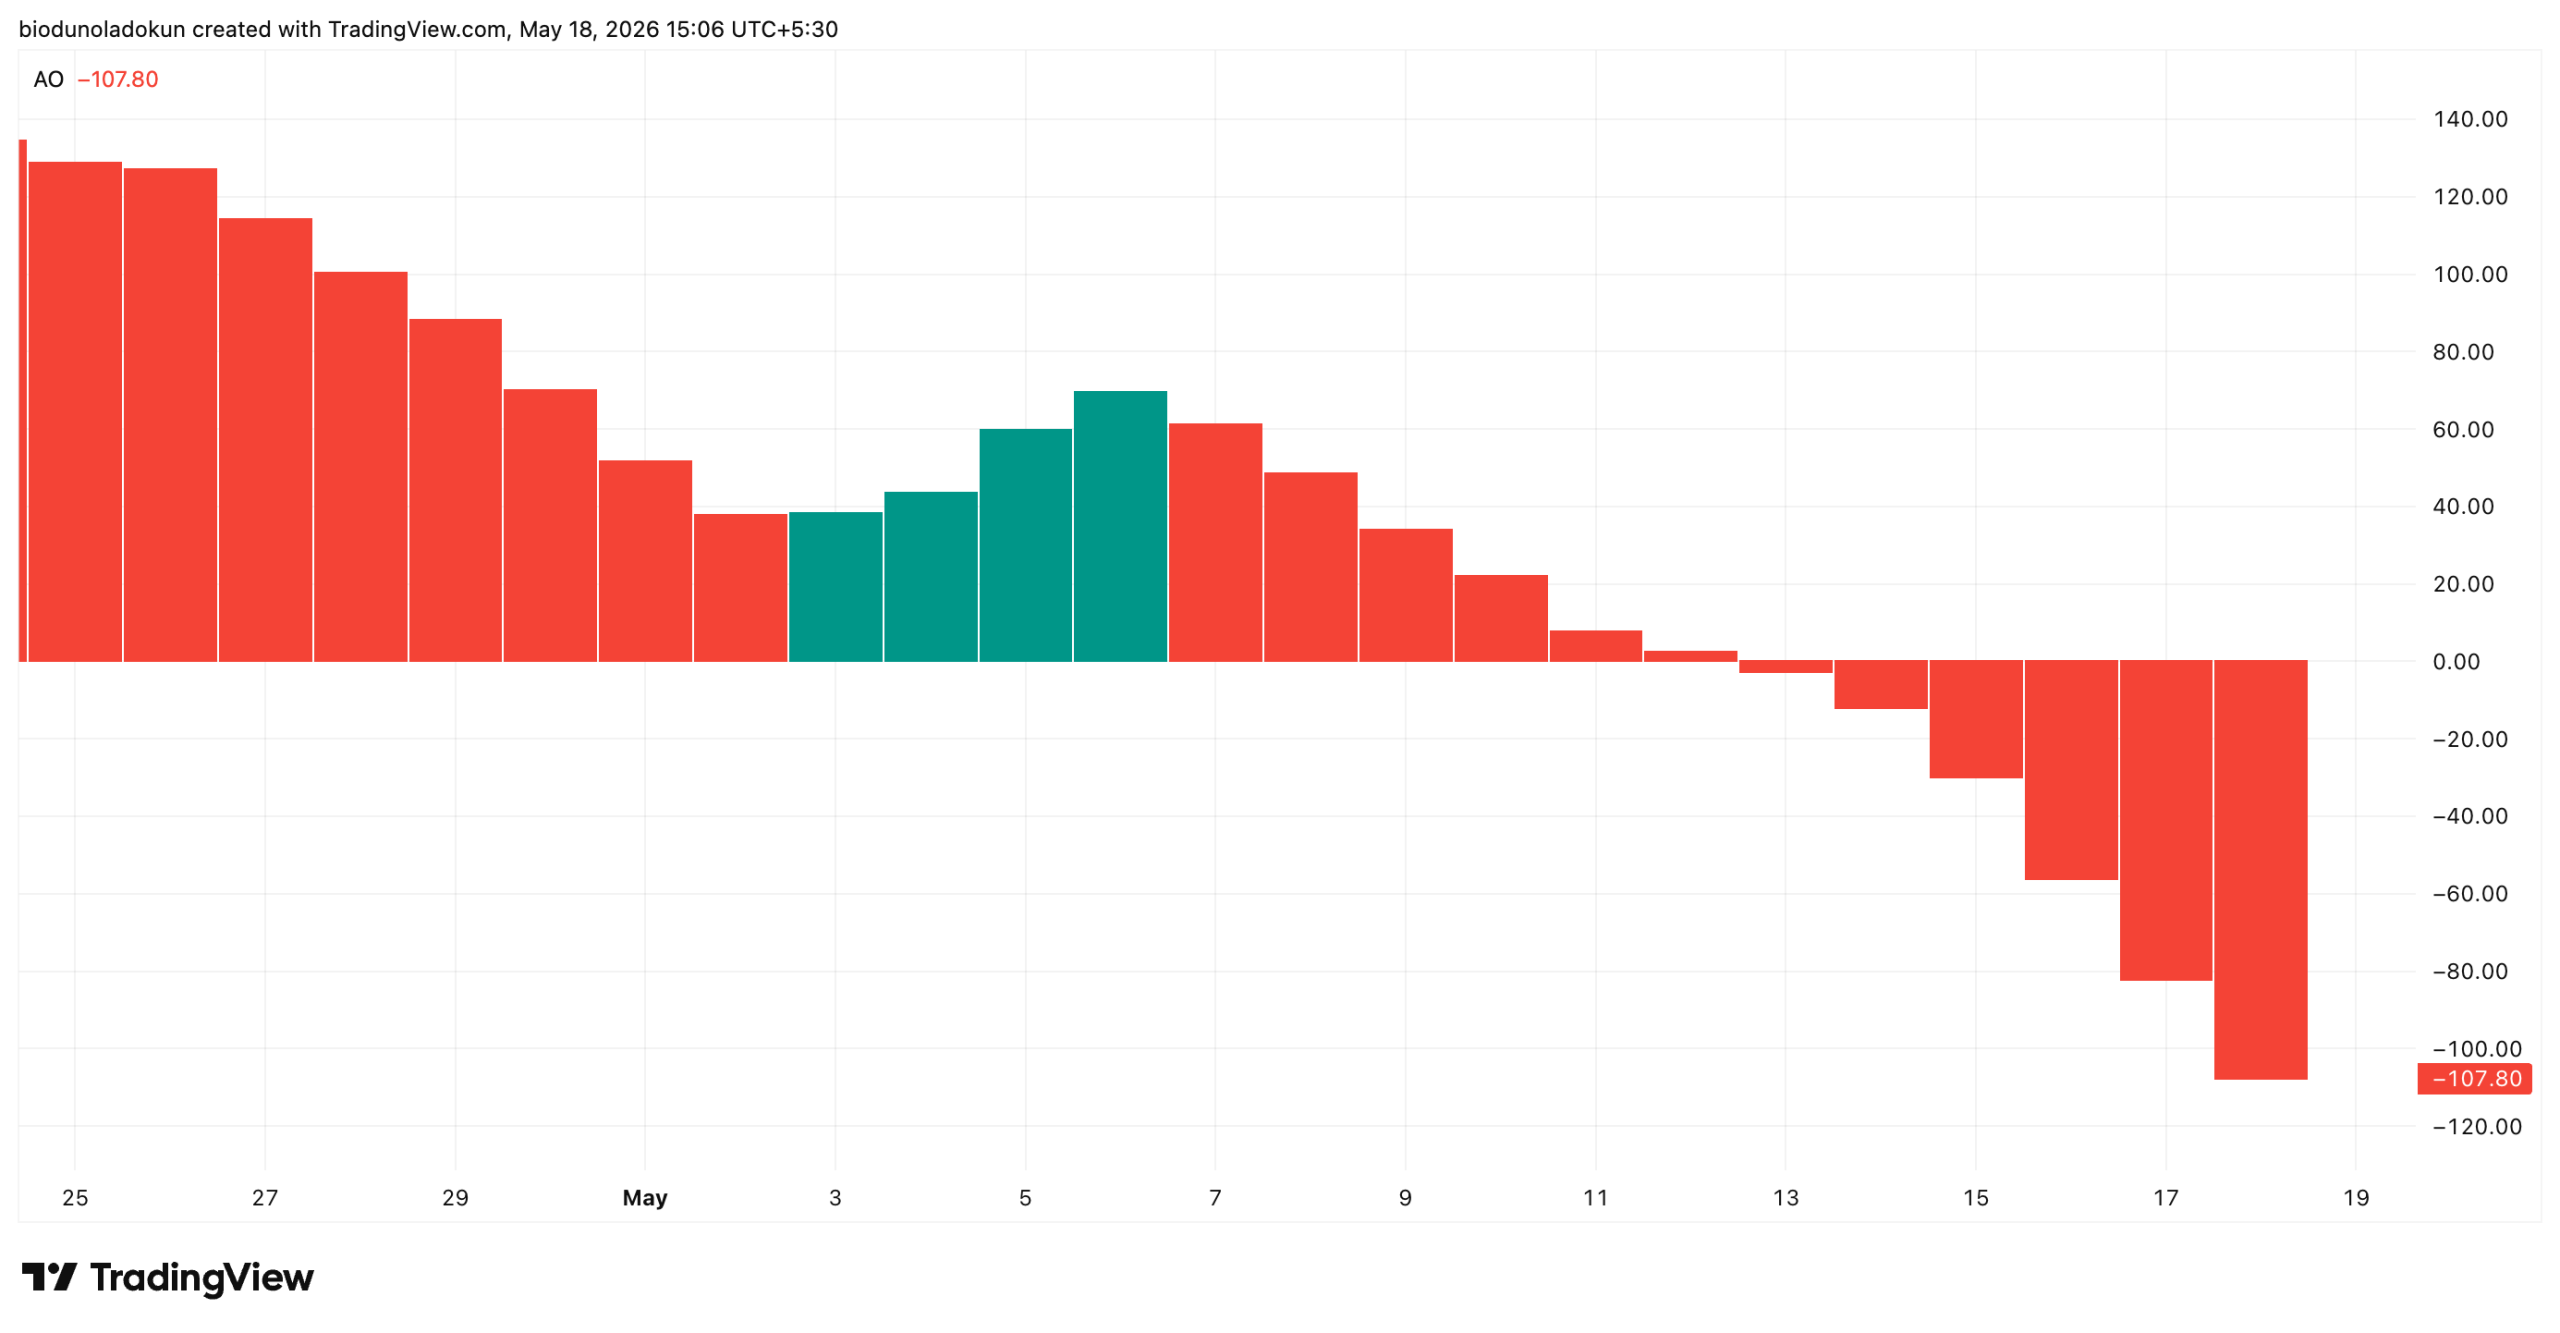
ETH’s technical setup on the 1-day chart reflects the falling demand for the altcoin. Its Awesome Oscillator has printed only red bars whose sizes have expanded to the downside over the past six sessions. At press time, this momentum indicator stands at -107.80.
The Awesome Oscillator compares an asset’s current market momentum with its longer-term momentum, helping identify potential trend shifts. When it shows green histogram bars and positive values, it indicates strong momentum and increasing bullish sentiment.
On the other hand, red bars and negative values signal that short-term momentum has slipped below the long-term trend. Usually, the deeper the negative reading and the larger the bars, the stronger the downward momentum.
For ETH, this setup means that selling pressure is increasing daily among its spot traders, limiting the potential for an uptrend.
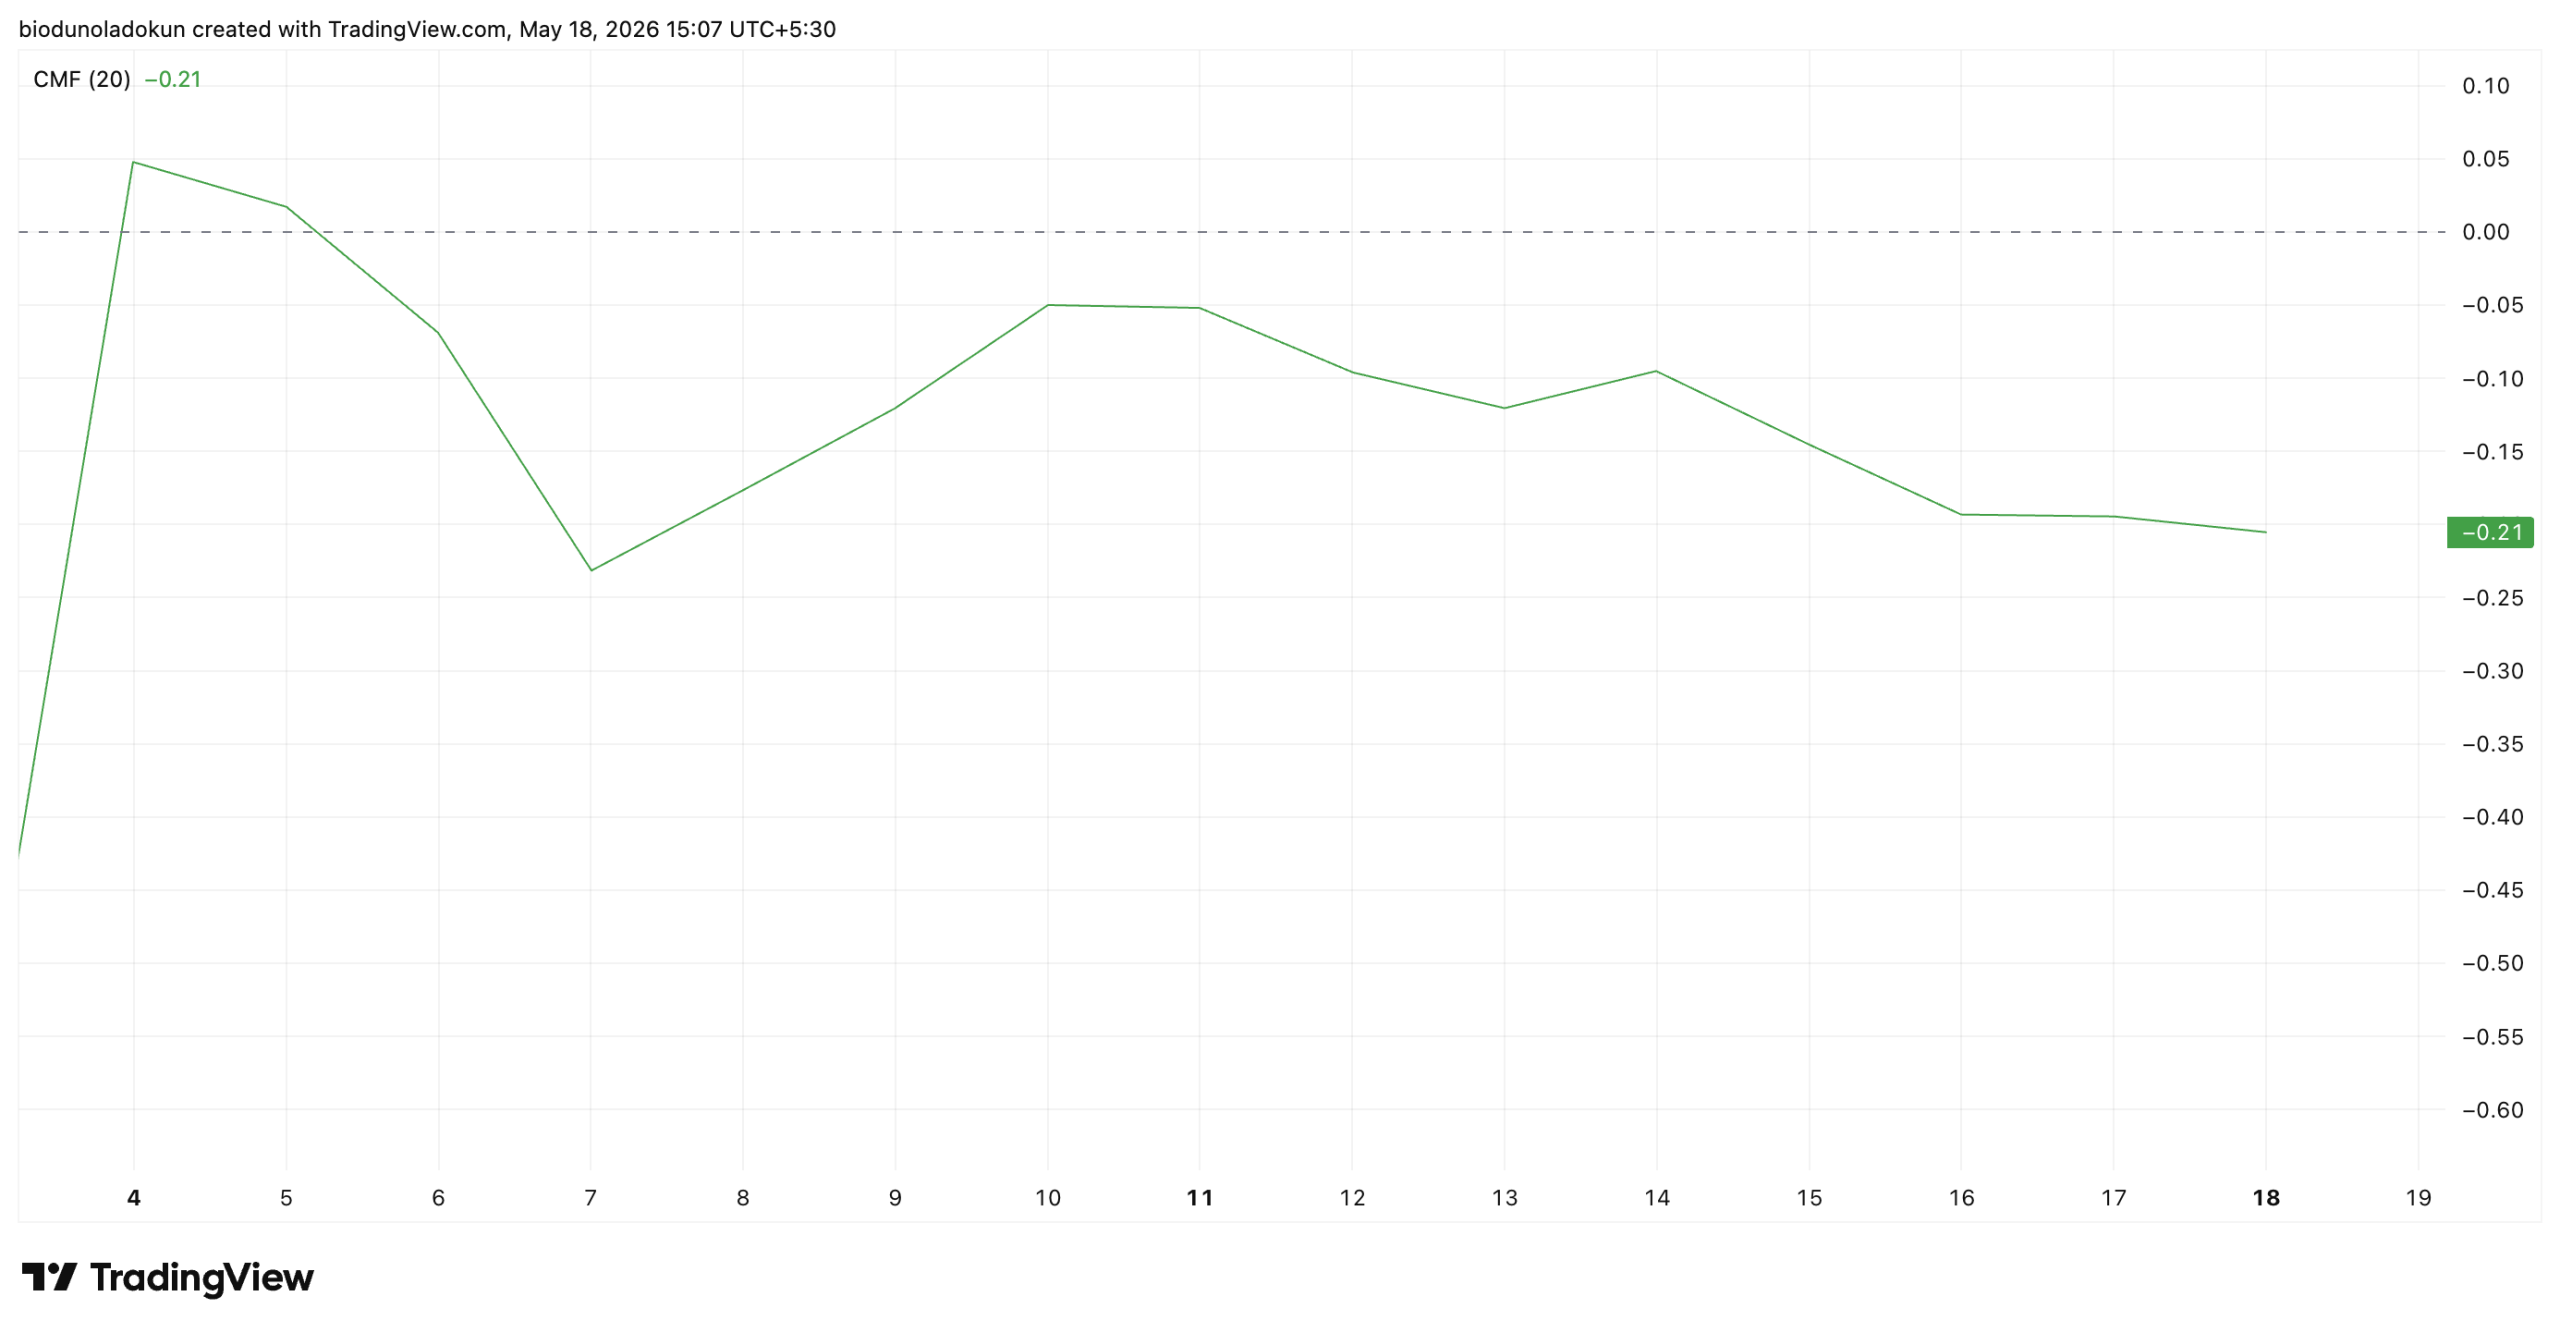
In addition, the altcoin’s Chaikin Money Flow (CMF) has remained below the zero line since May 5, reflecting the capital exit from ETH’s spot markets.
This momentum indicator, which tracks how money flows into and out of an asset, is at -0.20 at press time and trends downward.
This reading shows that distribution has been dominant for nearly two weeks, with no meaningful interruption to the selling pressure.
ETH Price Prediction
Ethereum is currently trading above the critical support floor at $2,044. If new demand remains poor and the coin breaks below this level, it might lead to a deeper correction toward $1,934.
On the flip side, if profit-taking stalls and general sentiment improves, ETH could reclaim the $2,234 level on rising volume and hold above it.
Disclaimer:
The information provided in this article is for informational purposes only. It is not intended to be, nor should it be construed as, financial advice. We do not make any warranties regarding the completeness, reliability, or accuracy of this information. All investments involve risk, and past performance does not guarantee future results. We recommend consulting a financial advisor before making any investment decisions.
Abiodun Oladokun is a Research Analyst at CCN, where he covers cryptocurrency markets with a focus on on-chain analysis, technical assessments, and emerging trends across decentralized finance (DeFi), real-world assets (RWA), artificial intelligence (AI), decentralized physical infrastructure networks (DePIN), Layer 2s, and meme coins.
Prior to CCN, he served as a Senior On-Chain Analyst at BeInCrypto, producing market reports spanning diverse crypto sectors.
Before that, he conducted technical analysis and market assessments of various altcoins at AMBCrypto, where he also contributed long-form quarterly research papers on DeFi, NFTs, DAOs, and scaling architectures, leveraging on-chain platforms including Messari, Santiment, DefiLlama, and Dune Analytics.
He began his crypto career as a research analyst at SixthSense DAO, developing blockchain forensic tools to trace the history of stolen assets.
Abiodun is a lawyer called to the Nigerian Bar and the founder of Ilé Ijó, a Lagos-based electronic dance music collective.