Ethereum breaks out of consolidation to a new ATH | Credit: Veronica Cestari
Share
Key Takeaways
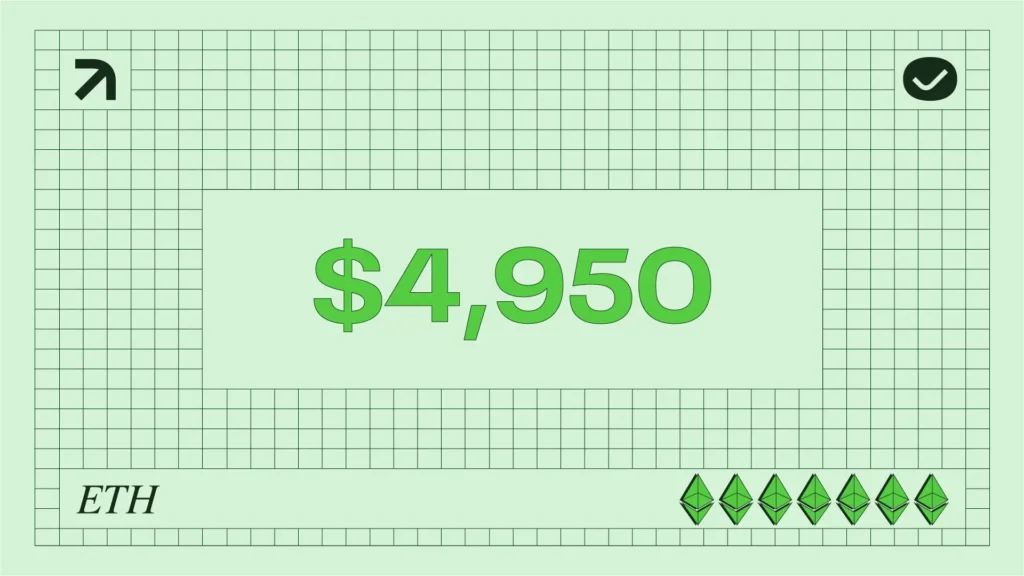
Ethereum’s price set a new all-time high of $4,953, its first since 2021, before retreating.
Data shows substantial exchange outflows and accumulation, which supports further upside.
ETH could target $6,708 if momentum holds, but fading demand may drag the price back.
Ethereum (ETH) finally broke into uncharted territory on Sunday, Aug. 23, hitting a new all-time high of $4,953—its first since 2021.
The surge sparked calls across the market for ETH to smash through the psychological $5,000 level. However, momentum cooled quickly, and the price has since slipped back below $4,700.
At first glance, the pullback might look like a stumble. To seasoned traders, it looks more like a setup.
Ethereum’s retreat from $4,950 resembles a pause rather than a breakdown—an intermission before the next push through resistance, just as it has done many times before.
Ethereum Sees Explosive Rally
Looking at the weekly chart, the Ethereum ATH came after it broke out of a symmetrical triangle. This pattern forms when price action squeezes between a series of lower highs and higher lows, creating a converging triangle.
The setup indicates a period of consolidation where buyers and sellers battle for control, with pressure building as the range tightens.
A breakout above the upper trendline typically signals that bulls have seized momentum, leading to explosive rallies — exactly what played out for ETH.
Get These Top Crypto Casino Offers Now!
Sponsored
Disclosure
We sometimes use affiliate links in our content, when clicking on those we might receive a commission at no extra cost to you. By using this website you agree to our terms and conditions and privacy policy.
From an on-chain perspective, rising ETH exchange outflows also drove Ethereum to its all-time high.
Data from Glassnode shows that yesterday, the net transfer volume of ETH from/to exchanges stood at -138,656.
A negative exchange flow indicates that more ETH leaves exchanges than enters, which typically signals reduced sell pressure. As of this writing, the number of ETH flowing into exchanges has yet to increase.
As long as this continues, Ethereum’s price might breach the overhead resistance and rally above $5,000.
ETH Net Exchange Transfer Volume | Credit: Glassnode
Adding to the bullish outlook, whales on Binance have been actively accumulating ETH, a move that strengthens the case for continued upside.
Large-scale buying by whales not only reduces available supply but also signals strong confidence in Ethereum’s long-term trajectory.
This accumulation has fueled speculation that a rally beyond $5,000 is possible.
Supporting this view, pseudonymous crypto analyst Darkfost noted that Ethereum’s price may continue climbing as whale activity aligns with the bullish technical setup.
“Whales act differently and often prefer to enter positions after a positive trend has been well validated, which is clearly observable here as these orders only started after the trend reversal. However, this does not make them immune to panic or sometimes arriving too late. This strong accumulation thus supports the upward movement and will likely provide enough momentum to push ETH toward the $5 000 level,” The analyst posted via CryptoQuant.
ETH Price Prediction: Uptrend Intact
Looking at the 4-hour chart, Ethereum’s price will likely hit another ATH soon. The recent pullback has carved out a bull flag pattern, a bullish continuation setup that often precedes another leg upward.
Reinforcing this outlook, the Supertrend indicator’s green line has flipped below the price, confirming ongoing buy signals. At the same time, the Chaikin Money Flow (CMF) has climbed above the zero line, signaling strong capital inflows and growing buy-side momentum.
Should this trend remain the same, ETH’s price might break the resistance at $4,950, forcing the cryptocurrency above $5,000.
In the long run, institutions like BlackRock and SharpLink Gaming might continue to buy ETH. If that happens, the next ATH could be $6,708 before this cycle ends.
On the contrary, if selling pressure increases and demand fades, this might not happen. If that is the case, Ethereum’s price might drop to $4,321.
Disclaimer:
The information provided in this article is for informational purposes only. It is not intended to be, nor should it be construed as, financial advice. We do not make any warranties regarding the completeness, reliability, or accuracy of this information. All investments involve risk, and past performance does not guarantee future results. We recommend consulting a financial advisor before making any investment decisions.
Victor Olanrewaju is a crypto analyst and reporter at CCN with deep roots in on-chain research and technical analysis. His crypto journey began in 2017, but it was the 2020 Uniswap airdrop that sparked a full-time pivot into the space.
With a foundation in copywriting, Victor honed his craft creating high-converting content for leading crypto brokers — most notably an XRP price prediction that ranked #1 on Google during the 2021 bull run.
He later joined AMBCrypto in 2022, where he combined storytelling with technical and on-chain analysis to cover key market narratives.
In 2024, he expanded his expertise at BeInCrypto, collaborating with analysts and using tools like Glassnode, Santiment, and IntoTheBlock to break down Bitcoin and altcoin trends.
At CCN, Victor covers the top cryptocurrencies, memecoins, macro shifts, blending real-time insights with deep-dive metrics.
He holds a Bachelor’s degree in Physics from the University of Ibadan, equipping him to simplify complex data for a wide audience. Follow his work or connect on LinkedIn or X.