How Decentralized Is XRP, Really? The Facts Explained
Share
Key Takeaways
XRP has lost its $3 support for the first time since Aug. 2 as sellers dominate.
Whale activity has fueled the decline, with large wallets offloading 470 million XRP.
A failed bullish pennant breakout points to an XRP correction to $2.45 or below $2.
XRP’s price has lost its grip on the $3 support for the first time since Aug. 2, as a broader market sell-off dragged nearly all of the top 10 cryptocurrencies lower in the past 24 hours.
Over the last seven days, XRP — the third-largest cryptocurrency by market cap — has dropped 10%, extending its recent correction.
In this analysis, CCN explains the key factors behind XRP’s pullback and explores the cryptocurrency’s short-term outlook.
XRP Triangle Breakdown Confirmed
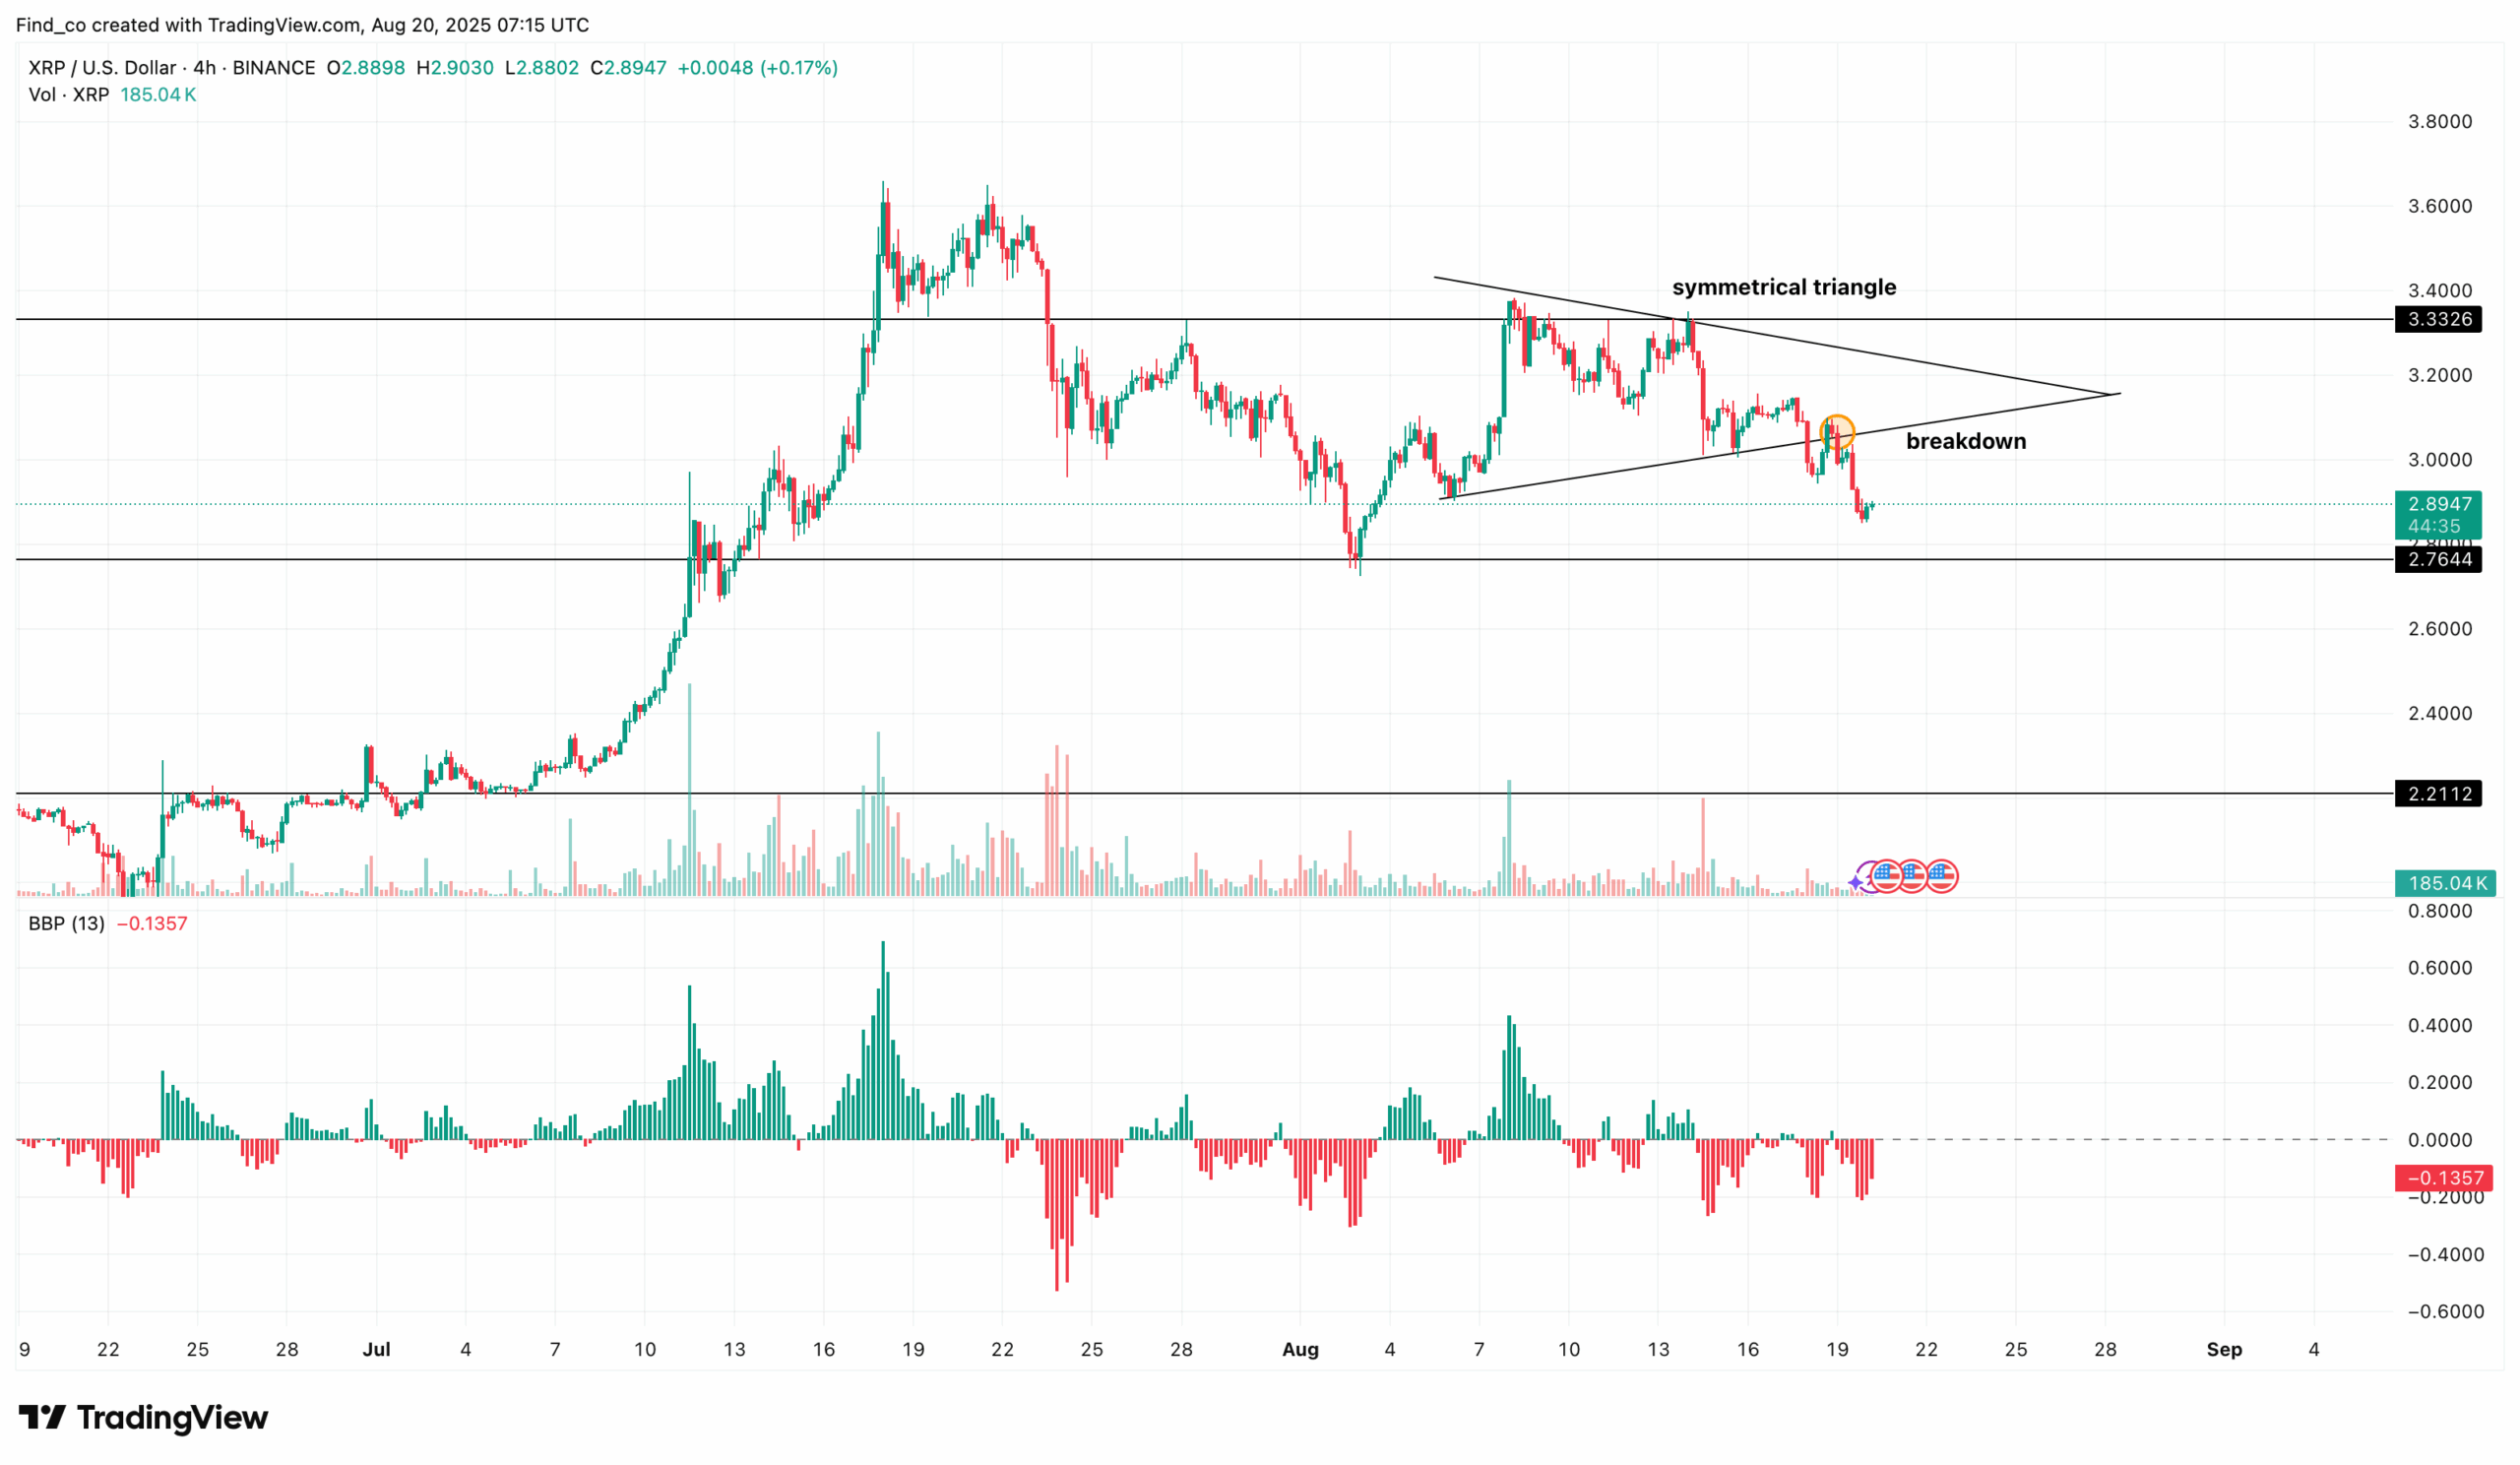
The 4-hour chart shows that XRP’s price has been consolidating within a symmetrical triangle since the start of the month.
However, on Tuesday, Aug. 19, the token broke below the triangle’s lower trendline, surrendering its grip on the crucial $3 support level.
CCN’s findings suggest that XRP failed to breach the upper resistance trendline due to insufficient buying pressure.
Try Our Recommended Crypto Exchanges
Sponsored
Disclosure
We sometimes use affiliate links in our content, when clicking on those we might receive a commission at no extra cost to you. By using this website you agree to our terms and conditions and privacy policy.
This weakness is confirmed by the Bull Bear Power (BBP), which slipped into negative territory on Monday, Aug. 18.
The decline signals that sellers currently dominate, leaving buyers on the defensive.
If this trend persists, XRP’s drop may not stop at $2.89. The token also risks sliding below additional support zones at $2.76 and even $2.21, especially as the $3.33 resistance has proven to be a stubborn ceiling.
Beyond weak buying power, XRP whales have also fueled the recent decline.
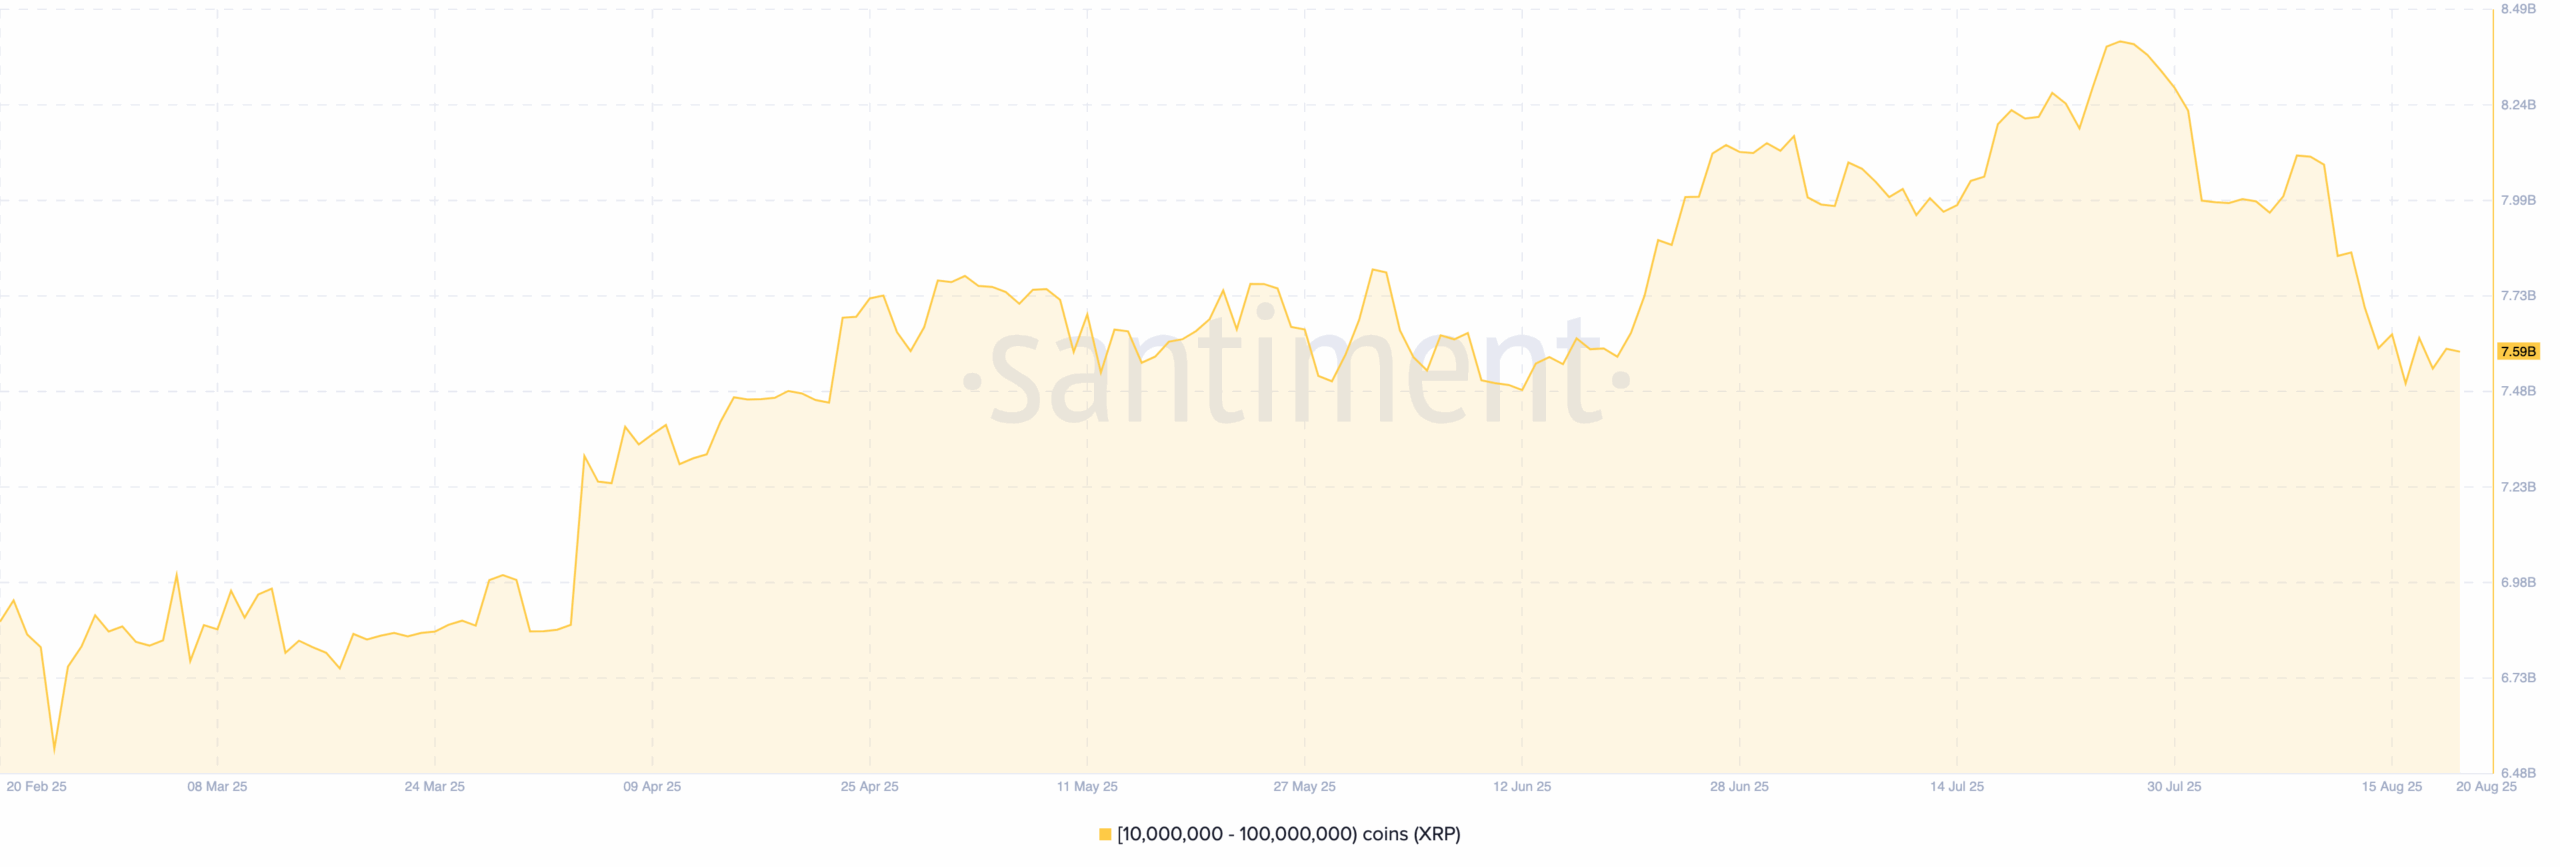
Data from Santiment shows that wallets holding between 10 million and 100 million XRP have trimmed their positions from over 8 billion tokens to 7.59 billion.
This drop means whales have offloaded roughly 470 million XRP in just a few days — a sell-off worth around $1.35 billion.
Such heavy distribution can weigh significantly on price since large holders mostly set the tone for market sentiment.
Therefore, if this trend continues, XRP’s price could face sustained downside as liquidity absorbs the excess supply.
However, buyers are not stepping in with strong volume.
Therefore, this setup might not provide the momentum needed for XRP to reclaim higher levels.
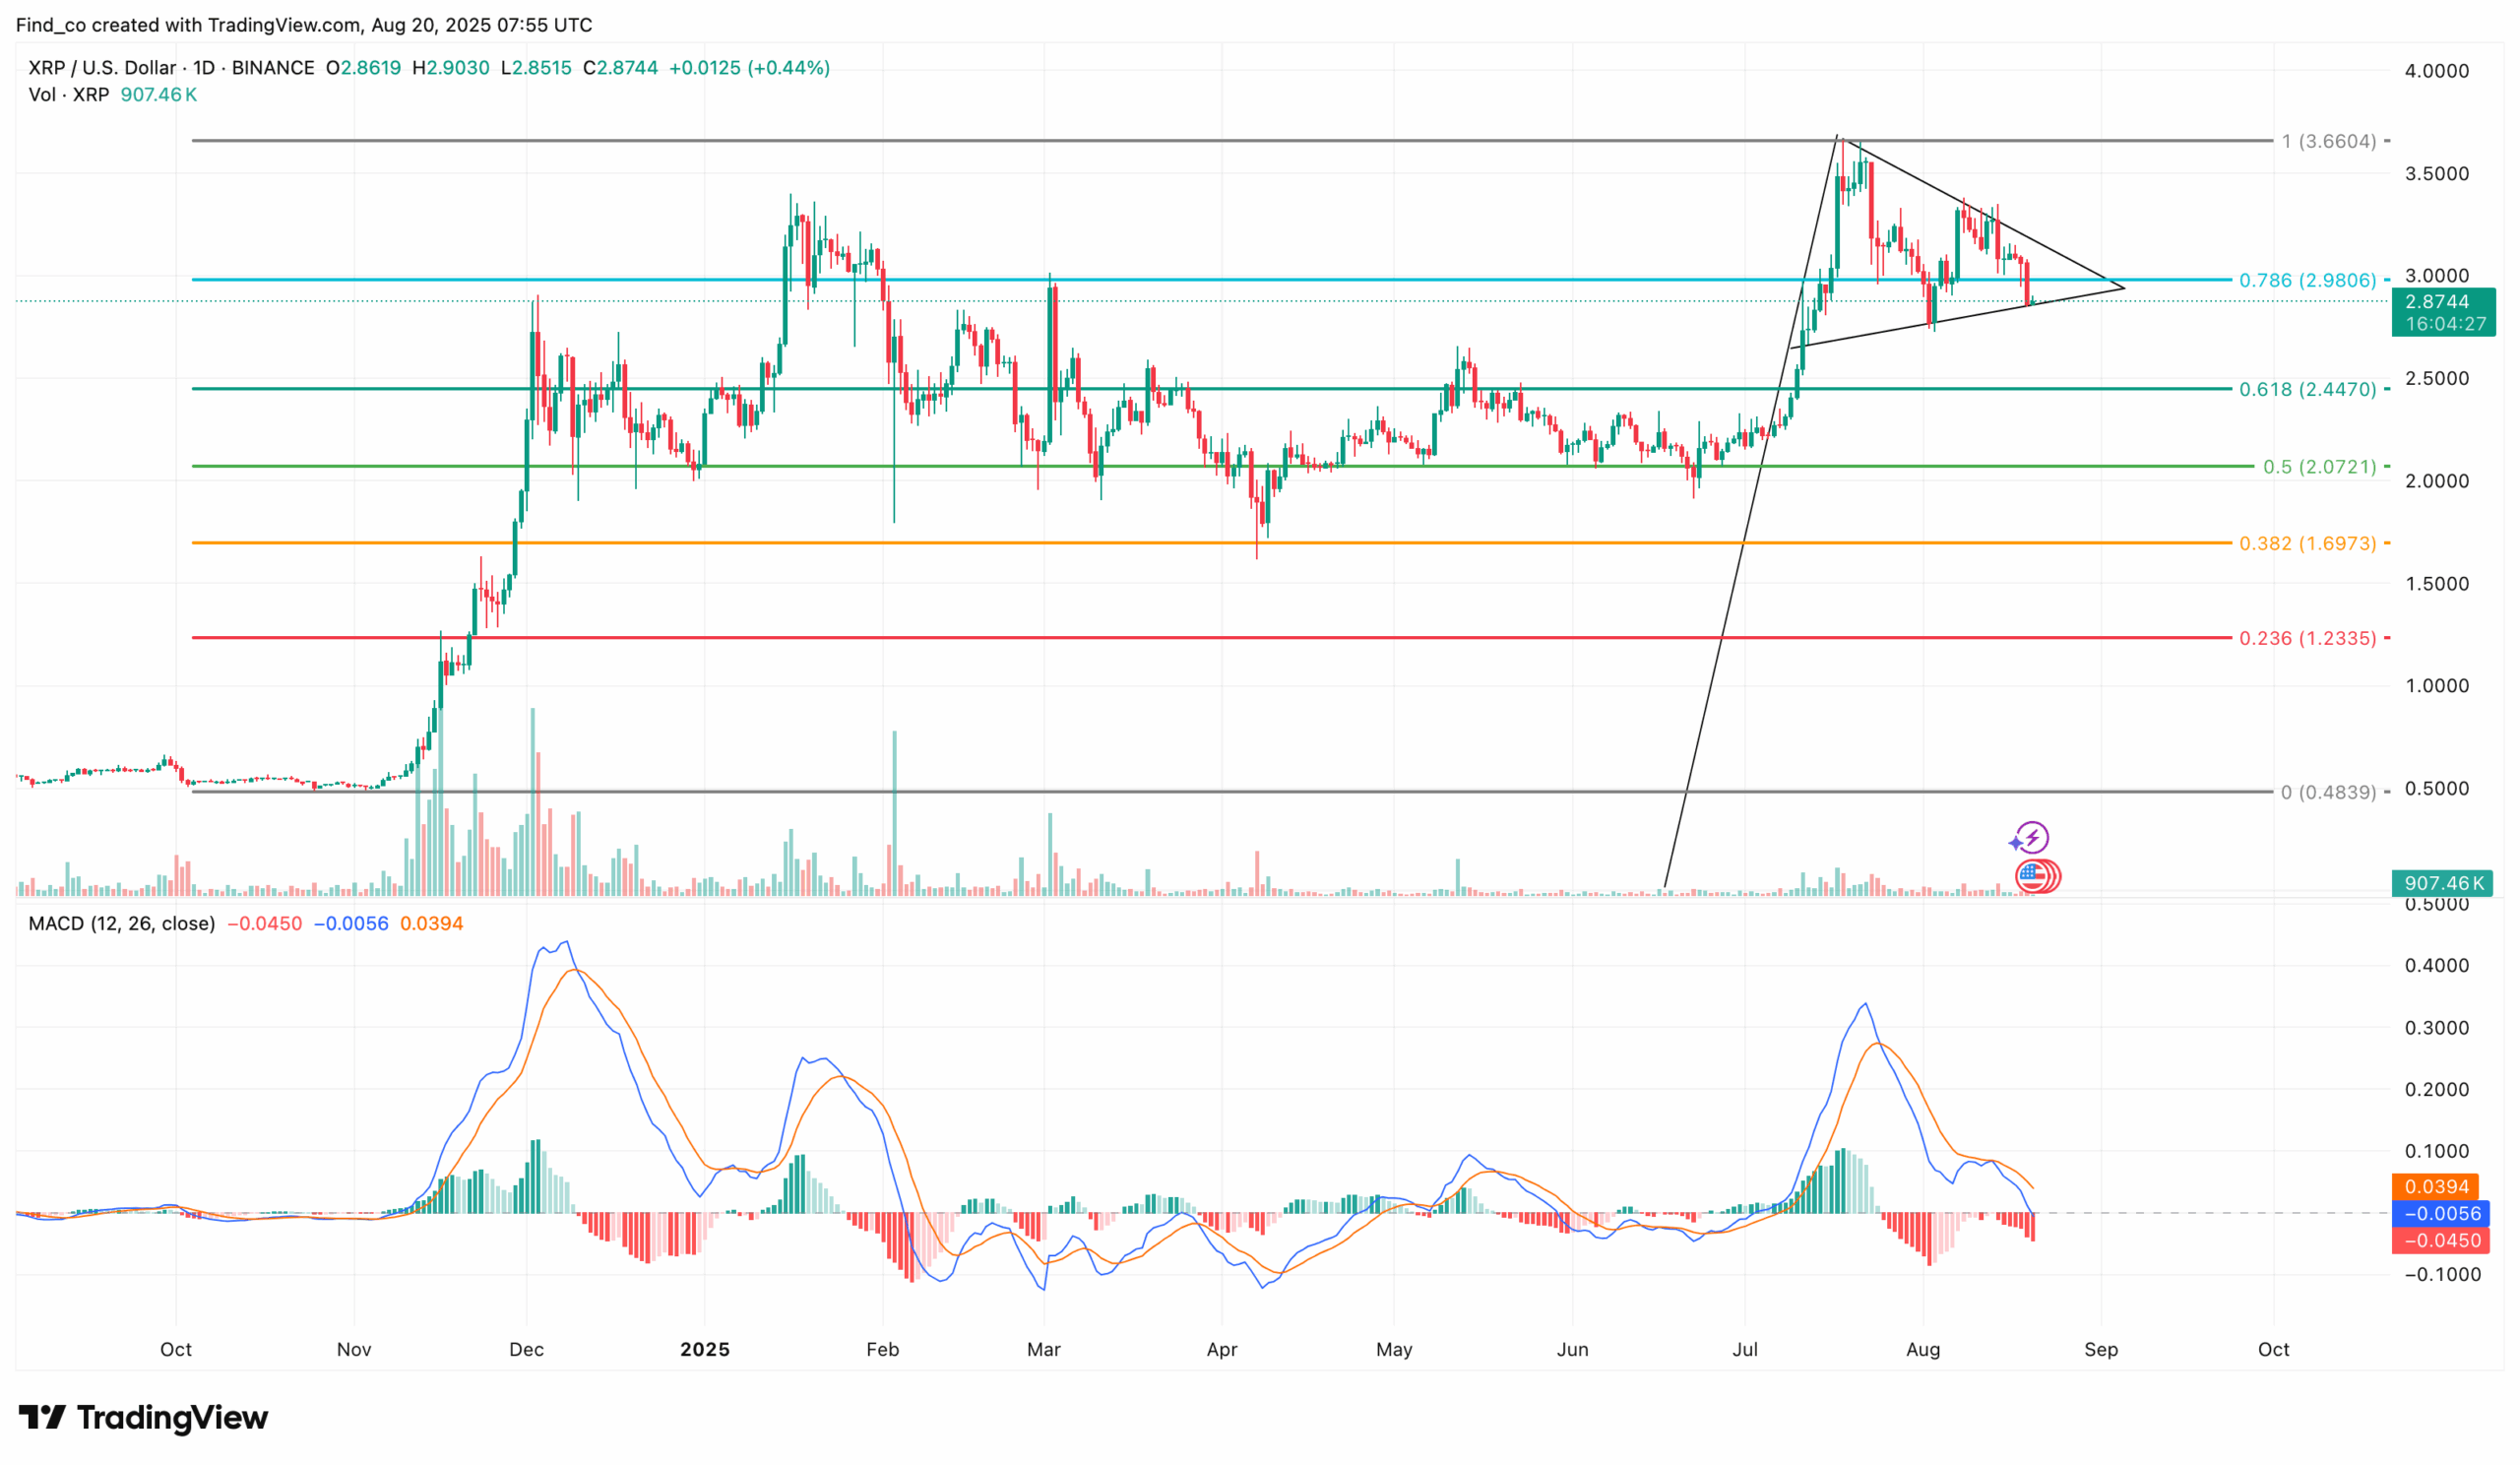
Amid this setup, the Moving Average Convergence Divergence (MACD) has flashed a bearish crossover, with the 12-day EMA crossing below the 26-day EMA.
Should this trend remain the same, XRP’s price might drop to $2.45 at the 0.618 golden ratio. Failure to hold this point could also accelerate the downtrend.
In that scenario, XRP’s price might decline below $2. However, this prediction might be invalidated if buying pressure increases and whales intensify accumulation.
Disclaimer:
The information provided in this article is for informational purposes only. It is not intended to be, nor should it be construed as, financial advice. We do not make any warranties regarding the completeness, reliability, or accuracy of this information. All investments involve risk, and past performance does not guarantee future results. We recommend consulting a financial advisor before making any investment decisions.
Victor Olanrewaju is a crypto analyst and reporter at CCN with deep roots in on-chain research and technical analysis. His crypto journey began in 2017, but it was the 2020 Uniswap airdrop that sparked a full-time pivot into the space.
With a foundation in copywriting, Victor honed his craft creating high-converting content for leading crypto brokers — most notably an XRP price prediction that ranked #1 on Google during the 2021 bull run.
He later joined AMBCrypto in 2022, where he combined storytelling with technical and on-chain analysis to cover key market narratives.
In 2024, he expanded his expertise at BeInCrypto, collaborating with analysts and using tools like Glassnode, Santiment, and IntoTheBlock to break down Bitcoin and altcoin trends.
At CCN, Victor covers the top cryptocurrencies, memecoins, macro shifts, blending real-time insights with deep-dive metrics.
He holds a Bachelor’s degree in Physics from the University of Ibadan, equipping him to simplify complex data for a wide audience. Follow his work or connect on LinkedIn or X.