LINK consolidates under $13 as sellers control overhead supply | Credit: Hameem Sarwar
Share
Key Takeaways
LINK remains weak because the MFI and RSI are below 50, indicating fading demand.
The token remains under the $13.00 resistance, with indicators predicting a drawdown.
LINK will likely stay bearish inside its descending channel unless it reclaims $15.47.
Chainlink (LINK) remains under significant pressure after losing roughly 40% of its value this year.
This one-year decline has reshaped LINK’s broader market structure, leaving the altcoin struggling to regain bullish momentum.
Despite occasional relief rallies, Chainlink’s price remains reflective of a market dominated by cautious sentiment and weak buyer follow-through.
Technical indicators across multiple timeframes suggest a fading demand, with LINK still trading well below the key recovery levels necessary for a meaningful trend reversal.
Can LINK’s price see a reversal? Let’s check the charts.
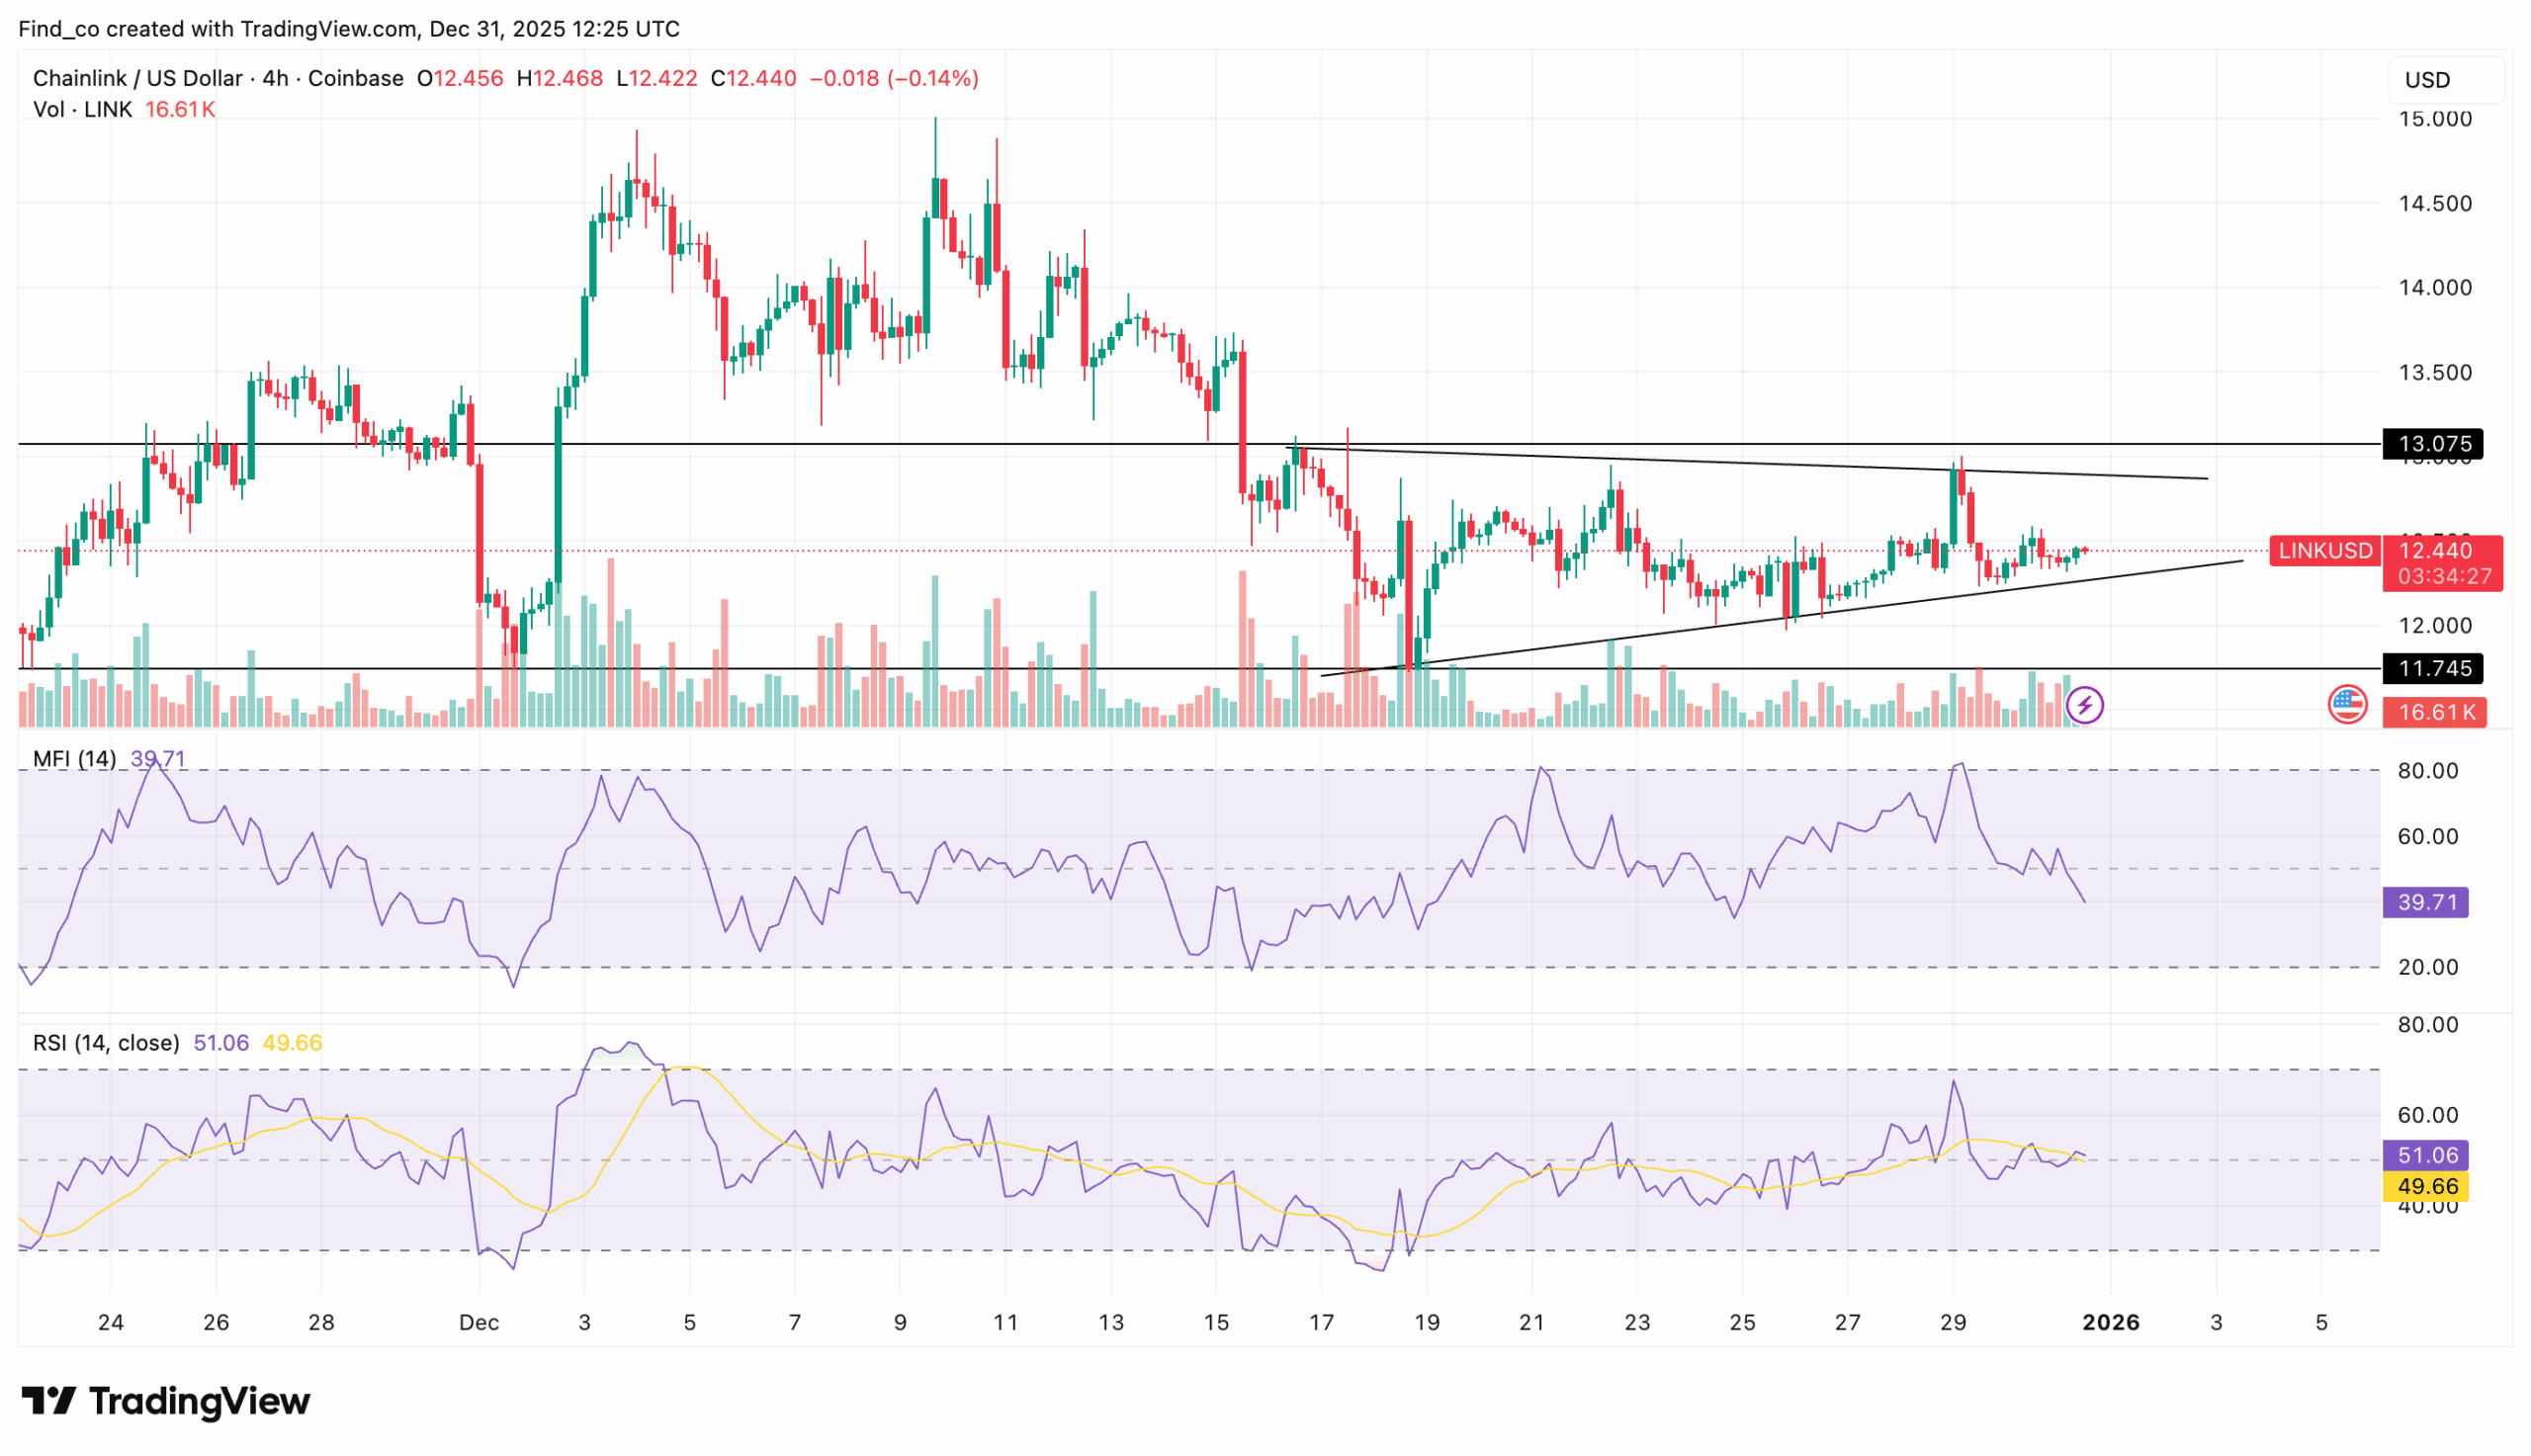
Chainlink Struggles Below Resistance
On the 4-hour chart, the Money Flow Index (MFI) shows a cautious setup. Currently reading 43.82, the indicator sits below the neutral 50 level, signaling persistent capital outflows and weak accumulation.
Furthermore, buyers remain hesitant to step in aggressively, leaving LINK vulnerable to further range compression or renewed selling pressure if sentiment worsens.
The Relative Strength Index (RSI) supports this outlook. With a reading of 48.70, it remains below the neutral threshold, indicating subdued bullish momentum.
Although not yet oversold, its failure to reclaim 50 highlights a market lacking conviction, where rallies appear corrective rather than trend-defining.
Besides that, LINK’s price action reinforces this indecisive tone. The altcoin continues to consolidate below the $12.80–$13.00 resistance zone, a region that previously acted as key support before the breakdown.
Failing to reclaim this zone maintains the short-term bearish bias, as sellers continue to control the overhead supply.
Immediate support sits around $11.80 to $11.60, and a decisive breakdown below this range could push Chainlink’s price toward the $11.00 psychological level.
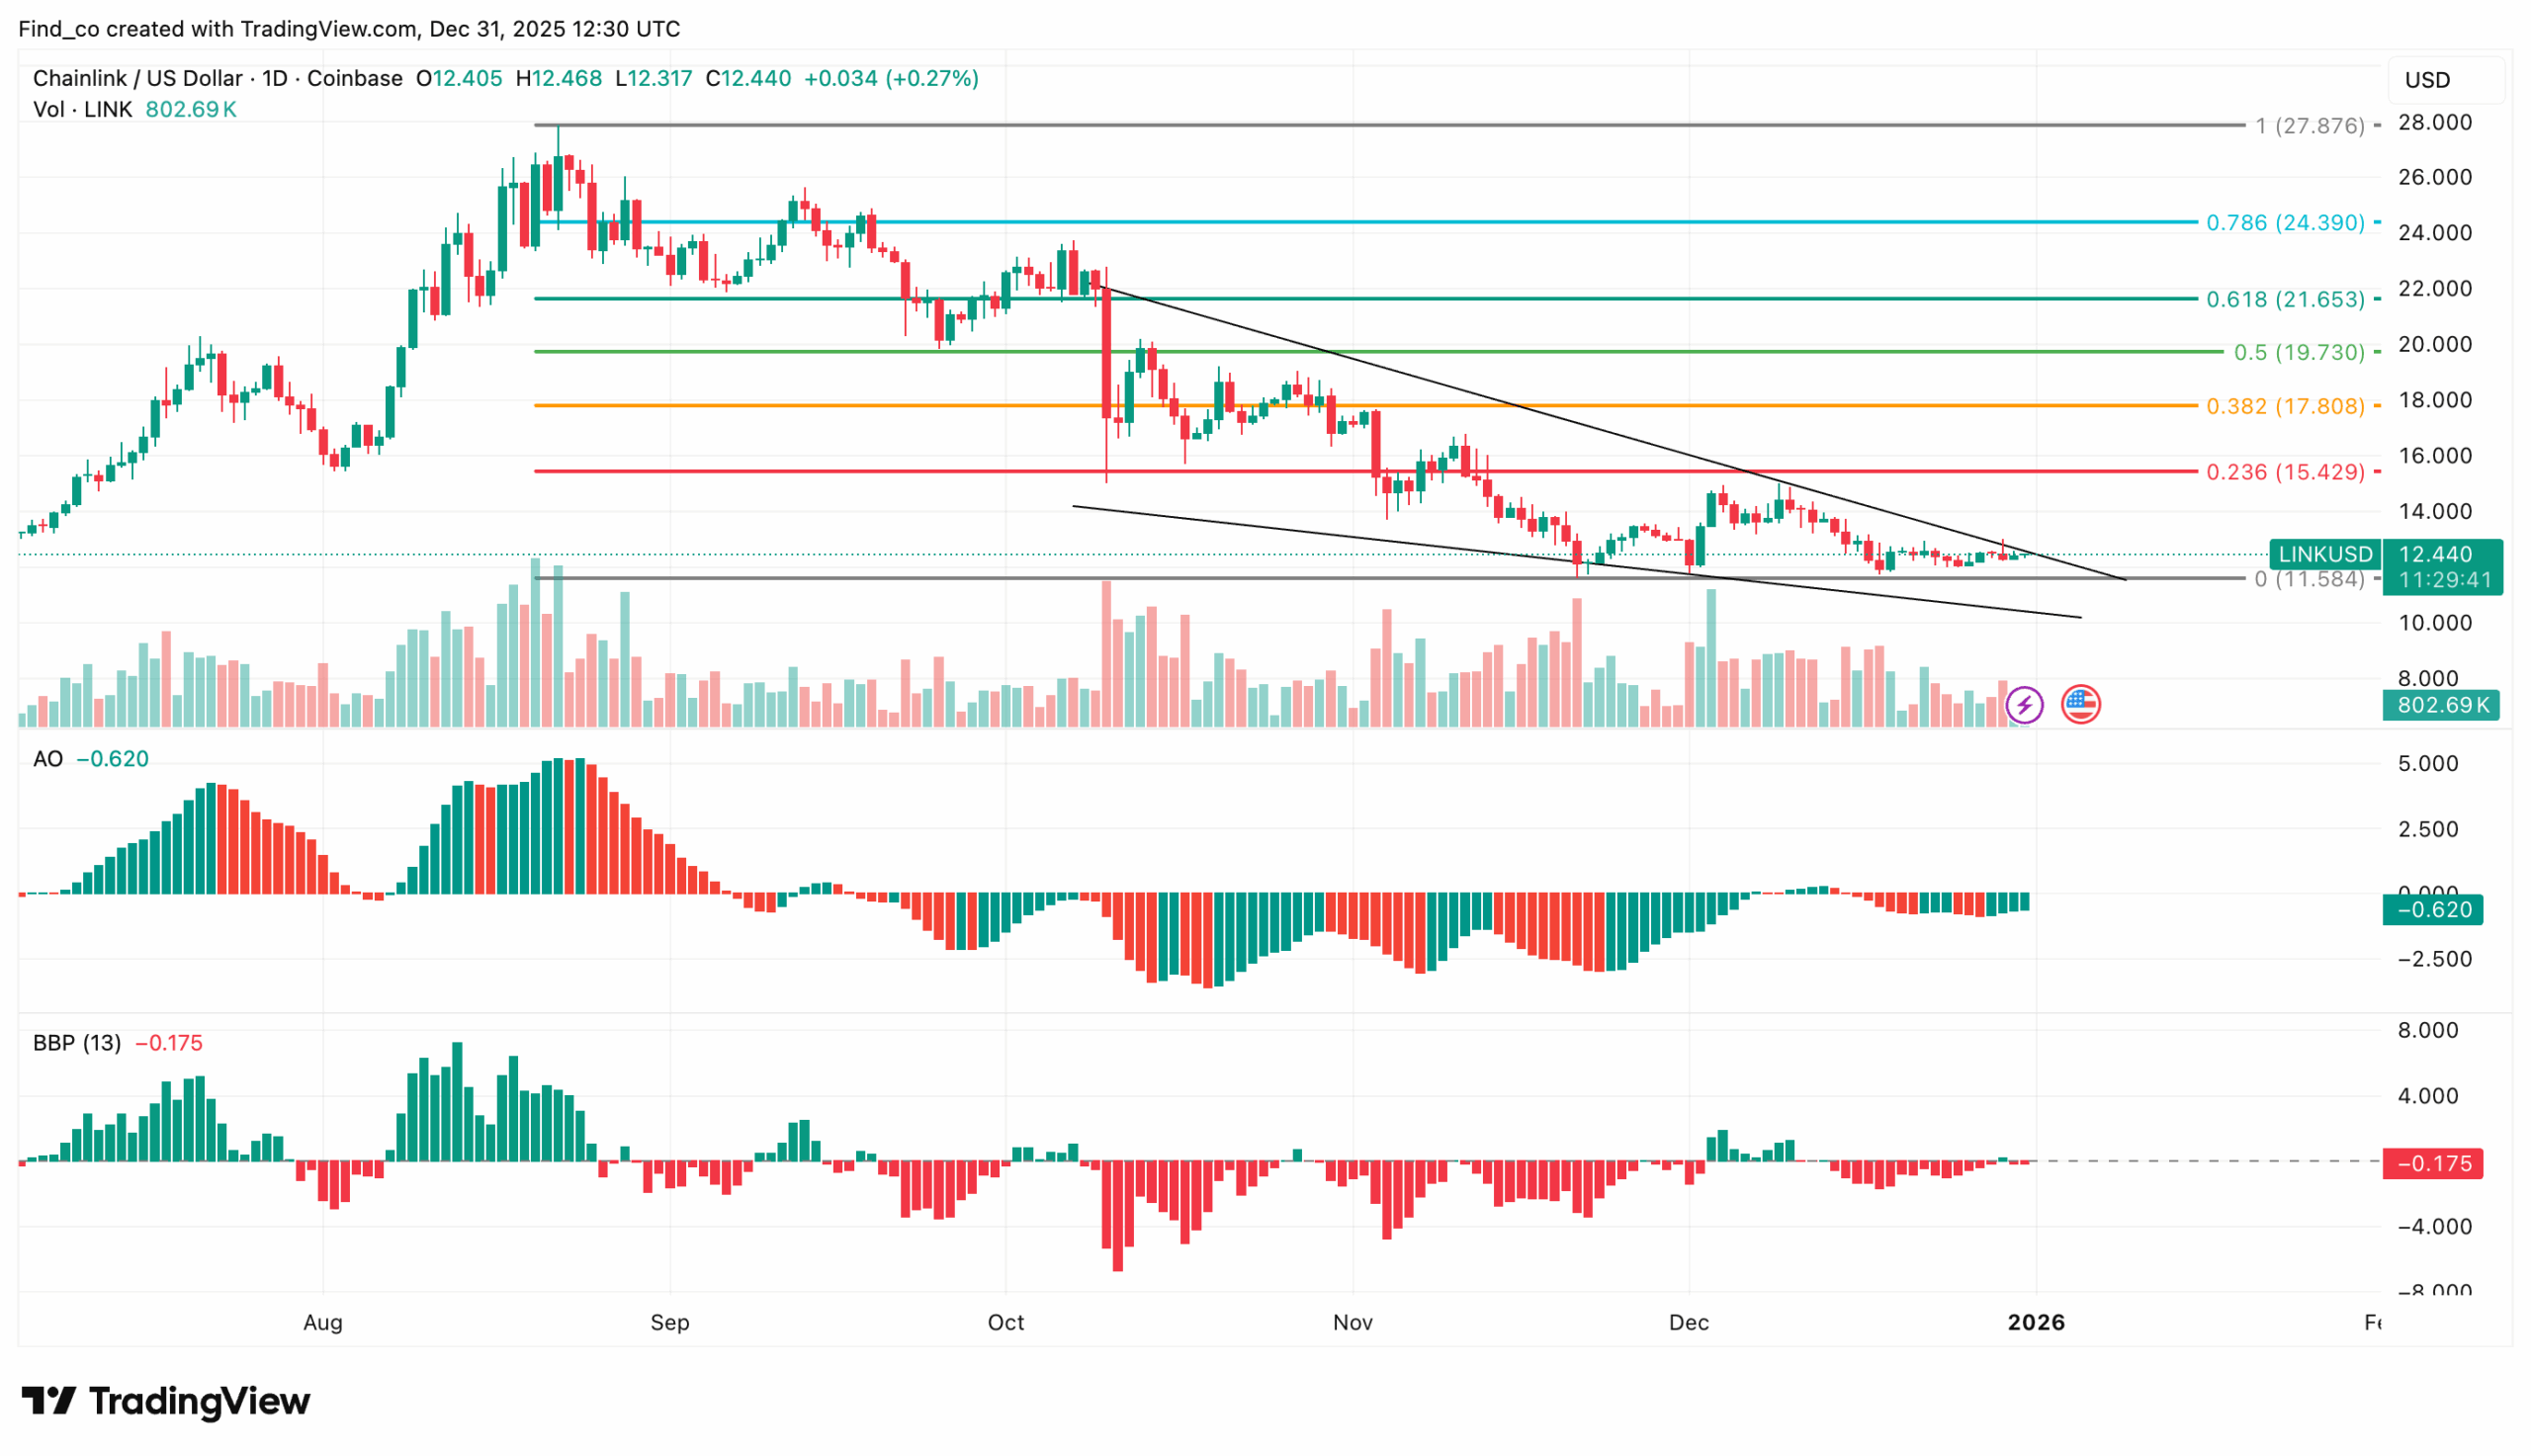
LINK Price Prediction: Bearish
On the daily chart, Chainlink’s price is moving within a descending channel, repeatedly breaking key support levels.
Technical outlooks suggest the token has yet to recover from its 2025 decline. At the time of writing, LINK is priced at $12.39, signaling further downside potential.
Supporting this bearish stance, the Awesome Oscillator (AO) continues to post green histogram bars in negative territory, indicating weak bullish momentum as buyers gradually exit the market.
Meanwhile, the Bull Bear Power (BBP) indicator also prints red bars, confirming sustained seller dominance. Together, these signals suggest LINK could face additional pressure in the near term.
As seen above, the Fibonacci retracement levels offer further insight into Chainlink’s price trajectory.
Trading at $12.44, LINK sits just above the Fib level at $11.58, a critical support zone. A sustained break below this level could pave the way for deeper losses.
On the other hand, if Chainlink’s price manages to reclaim its immediate resistance at $15.47, it could signal the beginning of a bullish reversal.
Disclaimer:
The information provided in this article is for informational purposes only. It is not intended to be, nor should it be construed as, financial advice. We do not make any warranties regarding the completeness, reliability, or accuracy of this information. All investments involve risk, and past performance does not guarantee future results. We recommend consulting a financial advisor before making any investment decisions.
Victor Olanrewaju is a crypto analyst and reporter at CCN with deep roots in on-chain research and technical analysis. His crypto journey began in 2017, but it was the 2020 Uniswap airdrop that sparked a full-time pivot into the space.
With a foundation in copywriting, Victor honed his craft creating high-converting content for leading crypto brokers — most notably an XRP price prediction that ranked #1 on Google during the 2021 bull run.
He later joined AMBCrypto in 2022, where he combined storytelling with technical and on-chain analysis to cover key market narratives.
In 2024, he expanded his expertise at BeInCrypto, collaborating with analysts and using tools like Glassnode, Santiment, and IntoTheBlock to break down Bitcoin and altcoin trends.
At CCN, Victor covers the top cryptocurrencies, memecoins, macro shifts, blending real-time insights with deep-dive metrics.
He holds a Bachelor’s degree in Physics from the University of Ibadan, equipping him to simplify complex data for a wide audience. Follow his work or connect on LinkedIn or X.