Chainlink has launched APAC Equities Streams, providing onchain access to real-time price data for major Japanese and South Korean stocks, including Samsung, SK Hynix, Toyota, Sony, and SoftBank. | Credit: CCN.com
Share
Key Takeaways
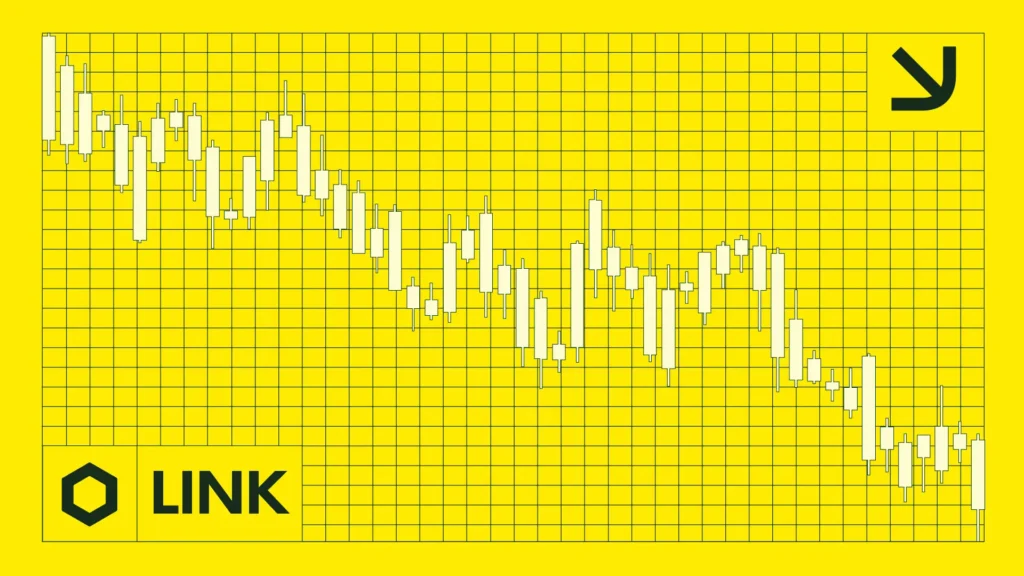
Chainlink’s price is on the verge of breaking the 4-hour chart’s upper resistance line.
On-chain data from Glassnode shows that the Chainlink token price is undervalued.
In the short term, indicators reveal that LINK could breach the 0.382 Fib level.
Chainlink (LINK) is unlikely to fall below $5 in the short term. This could be the case, as it seems that bears have lost control.
Technical analysis indicates that the $5 zone has become a key support area, where demand has consistently increased, and selling pressure has weakened.
As long as this support holds, LINK’s price is expected to remain stable or trade sideways, with a higher likelihood of a gradual recovery.
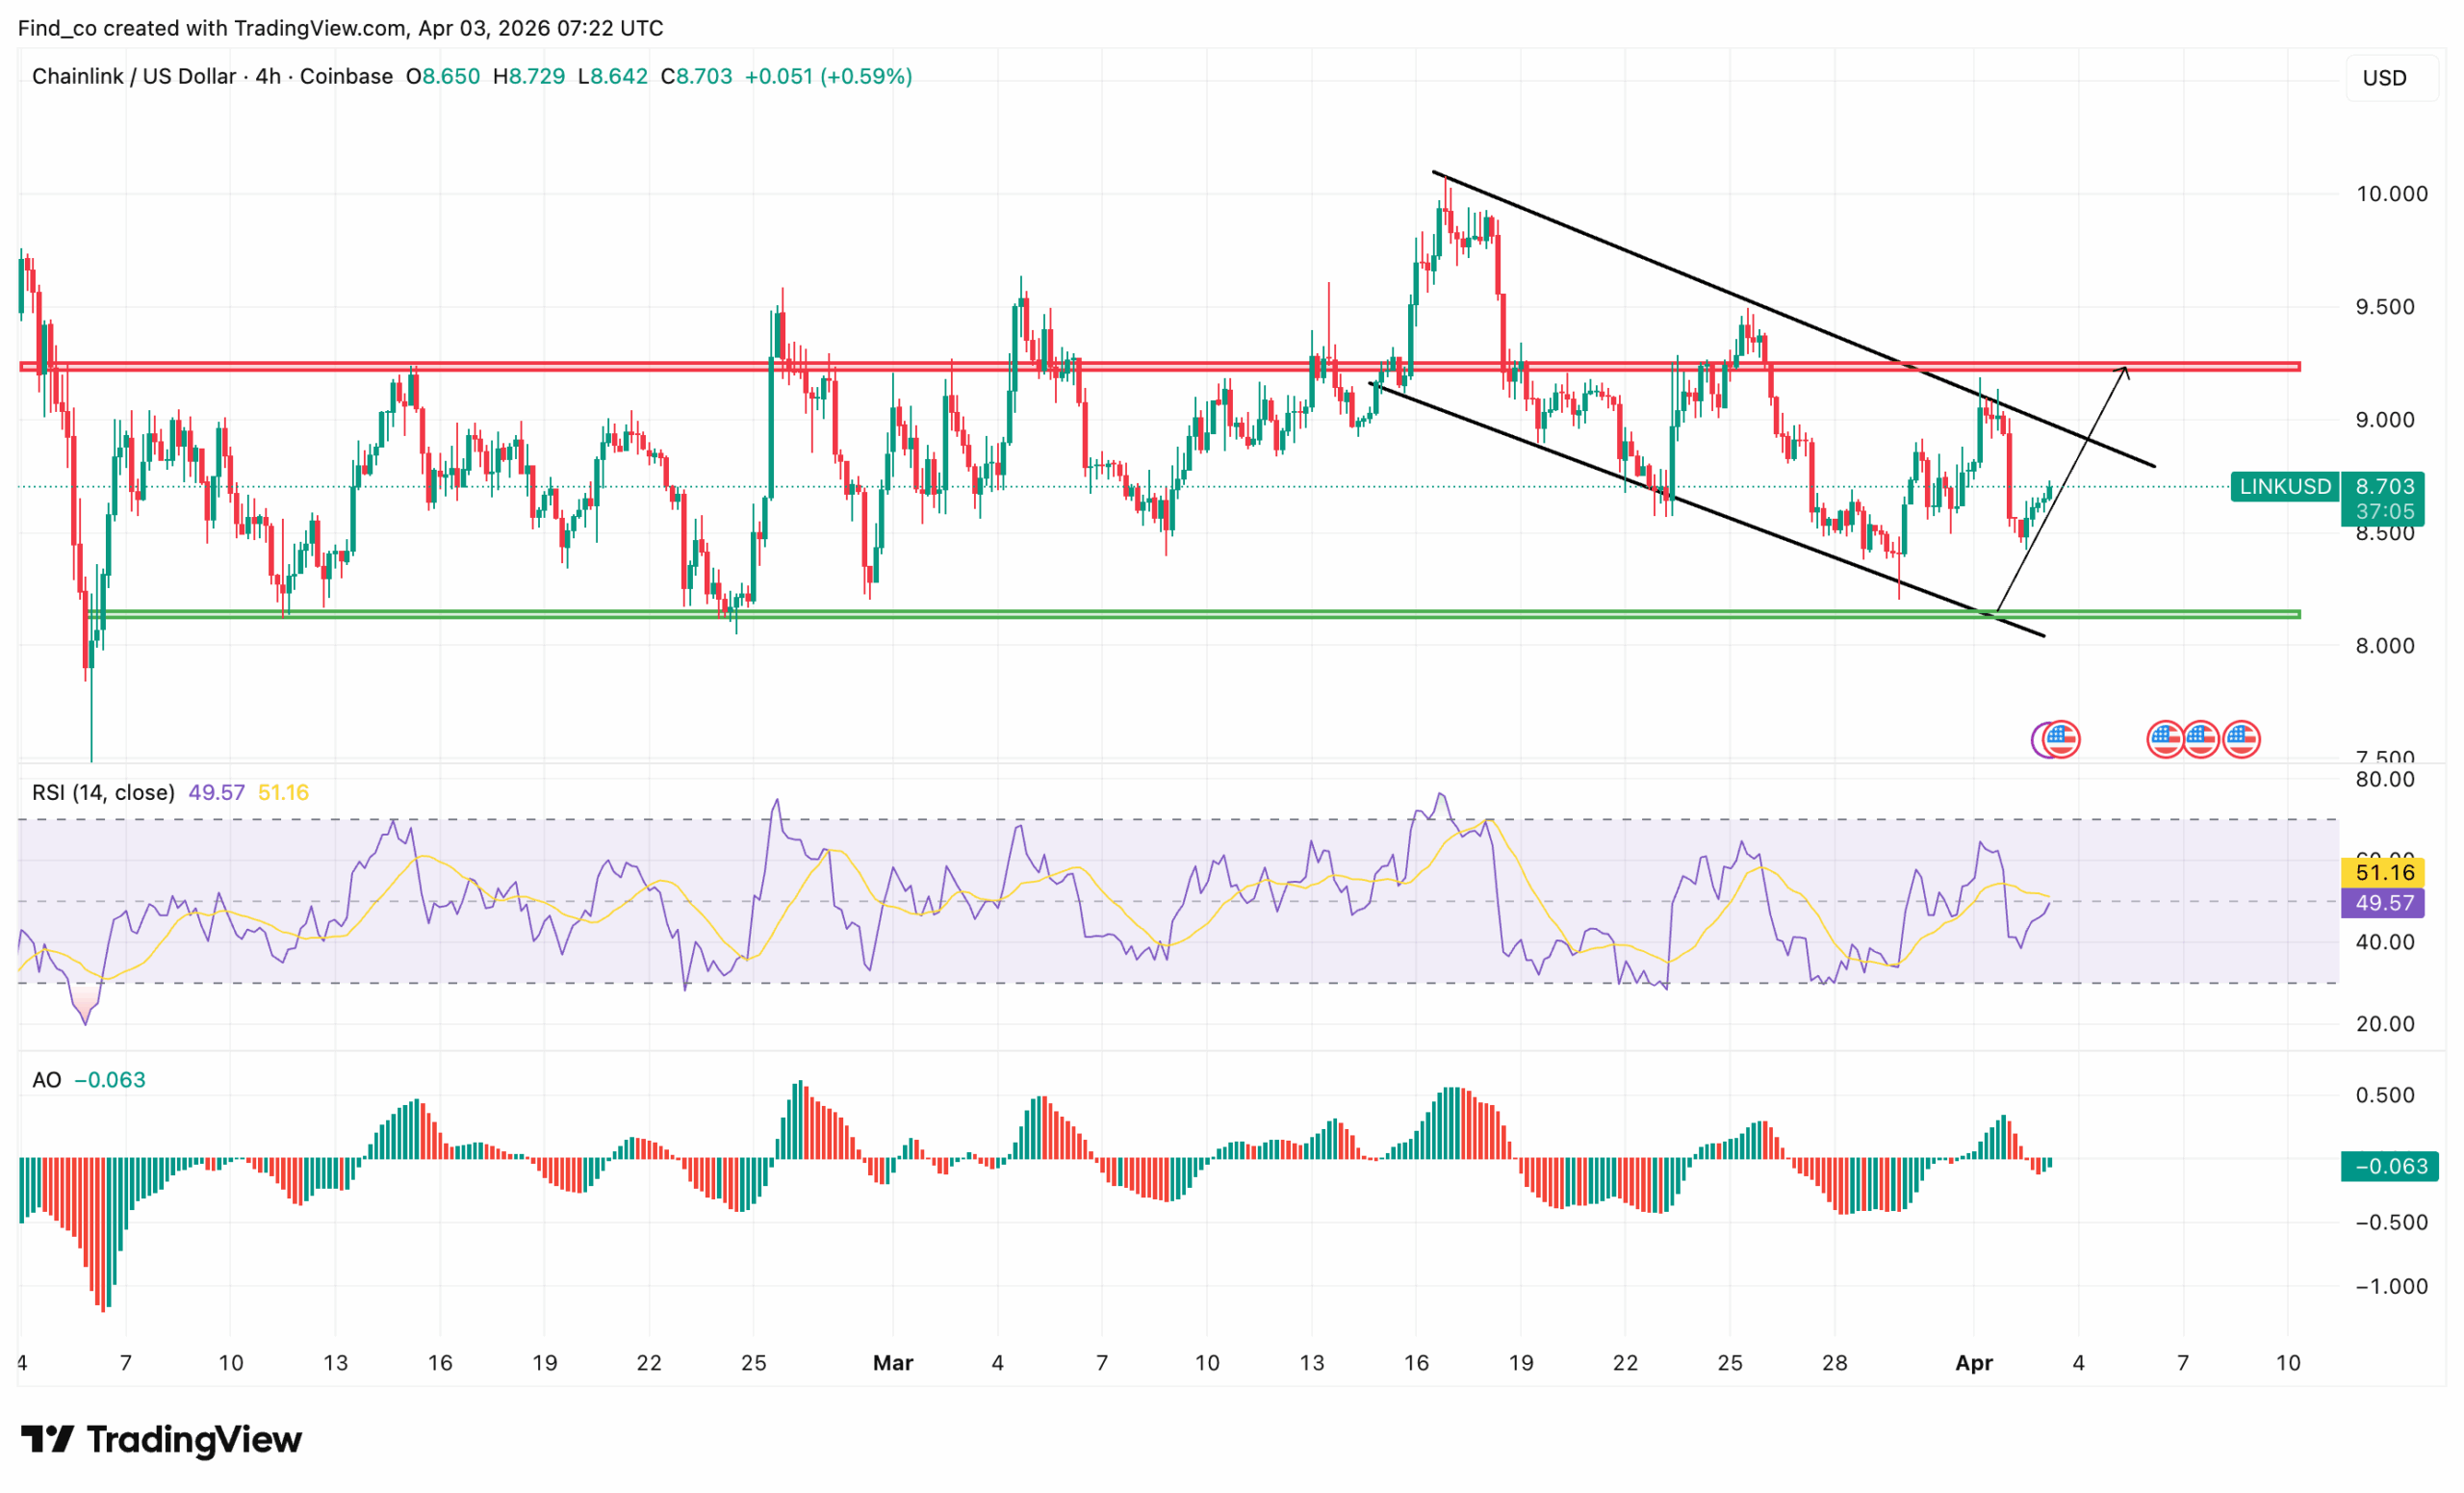
Chainlink Targets Breach Above Resistance
At first glance, the technical setup looks complex. However, Chainlink’s price action on the 4-hour chart tells a different story.
At the time of writing, Chainlink’s price shows early signs of recovery, but resistance still caps upside.
First, price action forms a descending channel. Lower highs and lower lows defined the structure through March.
However, LINK’s price recently bounced from the lower boundary near $8.0. This reaction suggests buyers are defending support.
Then, a potential breakout attempt begins. Moreover, the projected path points toward a retest of the $9.20 resistance zone.
At the same time, this resistance area remains critical. It has rejected the price multiple times in the past. Therefore, any move into this zone is likely to face selling pressure again.
Meanwhile, momentum shows modest improvement. RSI climbs back toward the 50 level.
This indicates neutral conditions rather than strong bullish momentum. In addition, the Awesome Oscillator stabilizes, though it remains slightly negative.
However, the broader structure remains bearish. Price remains below the descending trendline. Until that breaks, the trend cannot fully shift.
Looking at support, the $8 zone remains key. This level has been held multiple times. If Chainlink’s price revisits it, buyers may step in again and prevent a potential drop to $5.
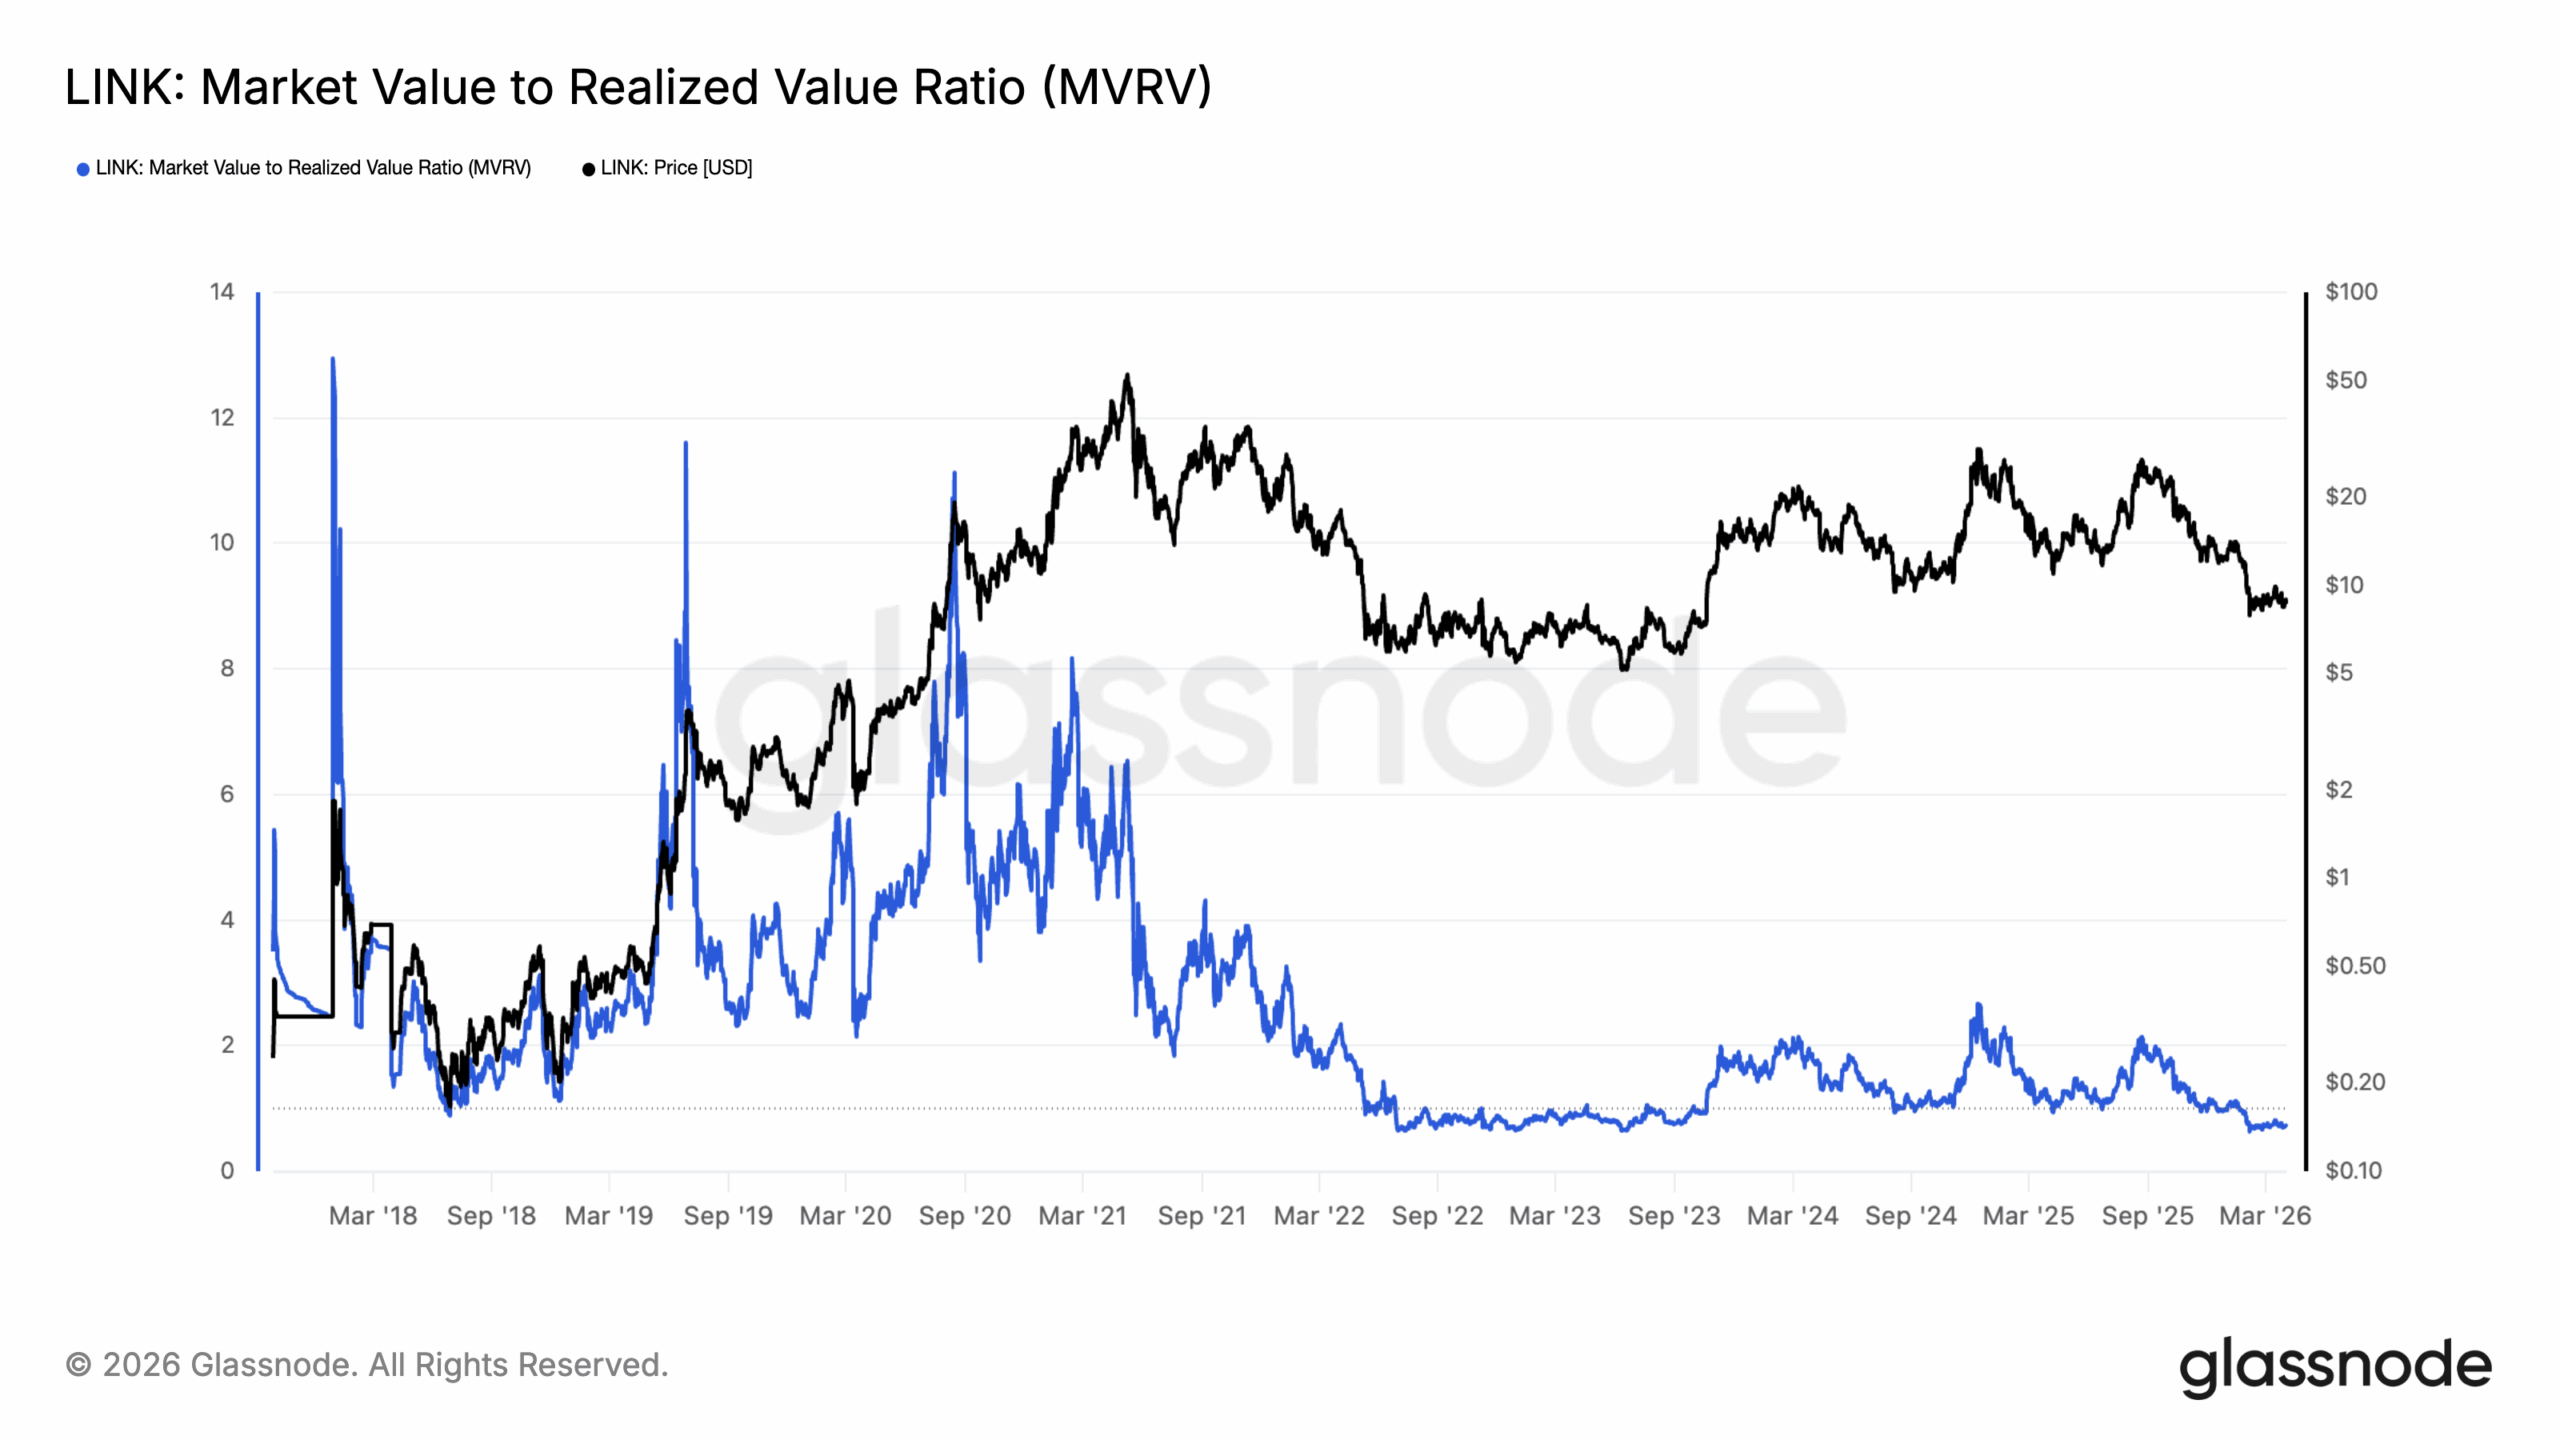
On-Chain Data Show Altcoin Is Underpriced
Besides that, the on-chain condition supports this outlook. According to Glassnode’s data, the Chainlink Market Value to Realized Value (MVRV) ratio is $0.71, which is near historical lows relative to past cycles.
This indicates that holders are holding smaller unrealized profits. In some cases, portions of the market may even be near breakeven.
At the same time, price reflects this compression. Chainlink’s price trades far below its previous cycle highs.
Meanwhile, historical patterns provide context. High MVRV spikes previously aligned with market tops. Conversely, low MVRV zones often formed during accumulation phases.
Therefore, current levels may indicate reduced downside euphoria rather than peak fear.
Looking ahead, a sustained rise in MVRV would be key. That would signal increasing unrealized profits and renewed demand.
Until then, Chainlink’s price might continue consolidating.
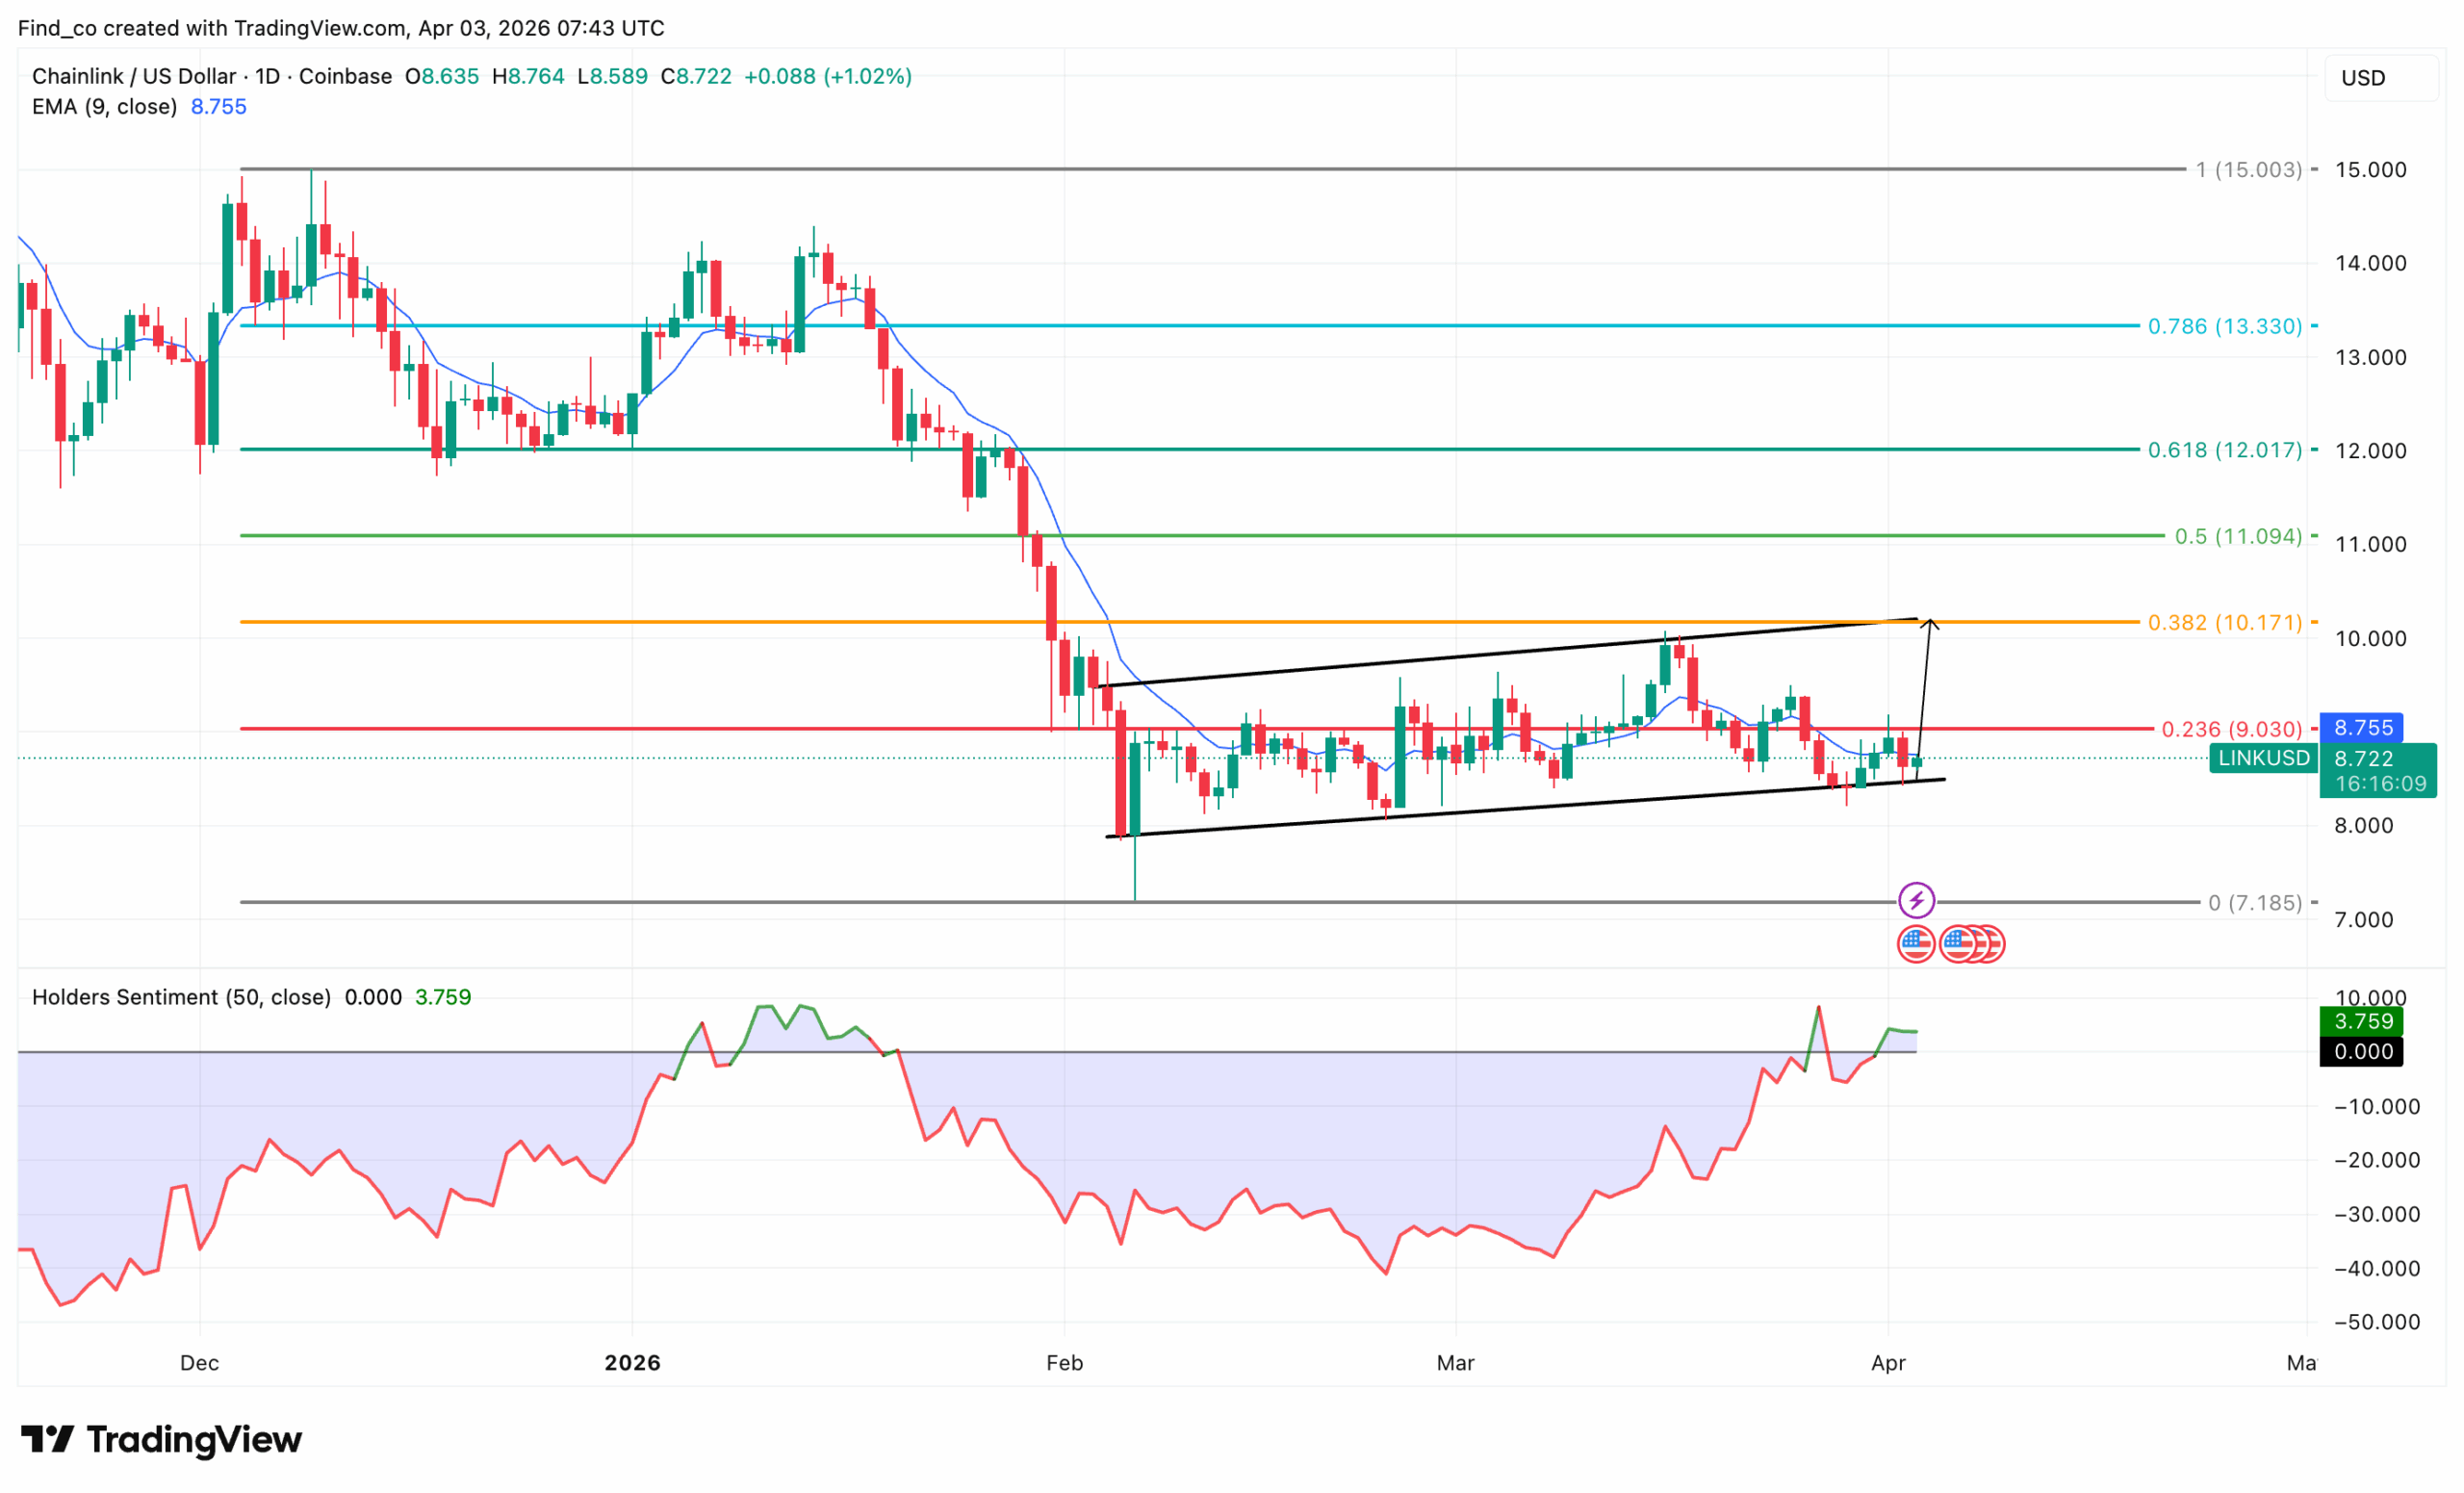
LINK Price Analysis: Consolidation Before Breakout
On the daily chart, Chainlink’s price has stabilized after a sharp decline. In turn, early signs of accumulation begin to emerge.
First, the broader trend shows a clear breakdown. Chainlink’s price dropped from the $15 region.
However, that decline has slowed, as the altcoin now consolidates between roughly $8 and $9.
Then, a structure begins to form. LINK trades within a rising wedge or channel. Higher lows have developed gradually.
At the same time, resistance remains firm. The $9.03 –$10.17. zone, aligned with the 0.236 and 0.382 Fibonacci levels, continues to cap upside. Each push toward this region faces selling pressure.
Meanwhile, short-term momentum is improving, as LINK’s price has reclaimed the 9 EMA and is holding near it.
On the sentiment side, conditions shift notably. Holder sentiment rises from deeply negative levels into positive territory.
This change suggests growing confidence among participants. Importantly, sentiment improves before a confirmed price breakout, which can act as a leading signal.
However, the structure is not yet fully bullish, as Chainlink’s price still trades below key Fibonacci resistance levels. In addition, the wedge pattern could resolve in either direction.
Disclaimer:
The information provided in this article is for informational purposes only. It is not intended to be, nor should it be construed as, financial advice. We do not make any warranties regarding the completeness, reliability, or accuracy of this information. All investments involve risk, and past performance does not guarantee future results. We recommend consulting a financial advisor before making any investment decisions.
Victor Olanrewaju is a crypto analyst and reporter at CCN with deep roots in on-chain research and technical analysis. His crypto journey began in 2017, but it was the 2020 Uniswap airdrop that sparked a full-time pivot into the space.
With a foundation in copywriting, Victor honed his craft creating high-converting content for leading crypto brokers — most notably an XRP price prediction that ranked #1 on Google during the 2021 bull run.
He later joined AMBCrypto in 2022, where he combined storytelling with technical and on-chain analysis to cover key market narratives.
In 2024, he expanded his expertise at BeInCrypto, collaborating with analysts and using tools like Glassnode, Santiment, and IntoTheBlock to break down Bitcoin and altcoin trends.
At CCN, Victor covers the top cryptocurrencies, memecoins, macro shifts, blending real-time insights with deep-dive metrics.
He holds a Bachelor’s degree in Physics from the University of Ibadan, equipping him to simplify complex data for a wide audience. Follow his work or connect on LinkedIn or X.