Is the DRIFT token dead after the exploit? | Credit: Hameem Sarwar
Share
Key Takeaways
DRIFT token plummeted to an all-time low after the protocol suffered a catastrophic security breach.
Trading volume increased, while sentiment collapsed, intensifying the bearish outlook for the altcoin.
Funding rate has remained severely negative, with the technical outlook stuck in a damaged setup.
$0.038. That was how low DRIFT, the native token of the Drift Protocol, went.
This happened only a few hours after the Solana-based protocol experienced the biggest hack since the New Year 2026 began.
This exploit is also one of the most severe security breaches the Solana DeFi ecosystem has ever recorded.
But will DRIFT price recover after this dies down? CCN looks at the potential in this analysis.
DRIFT Price Crashes After Exploit
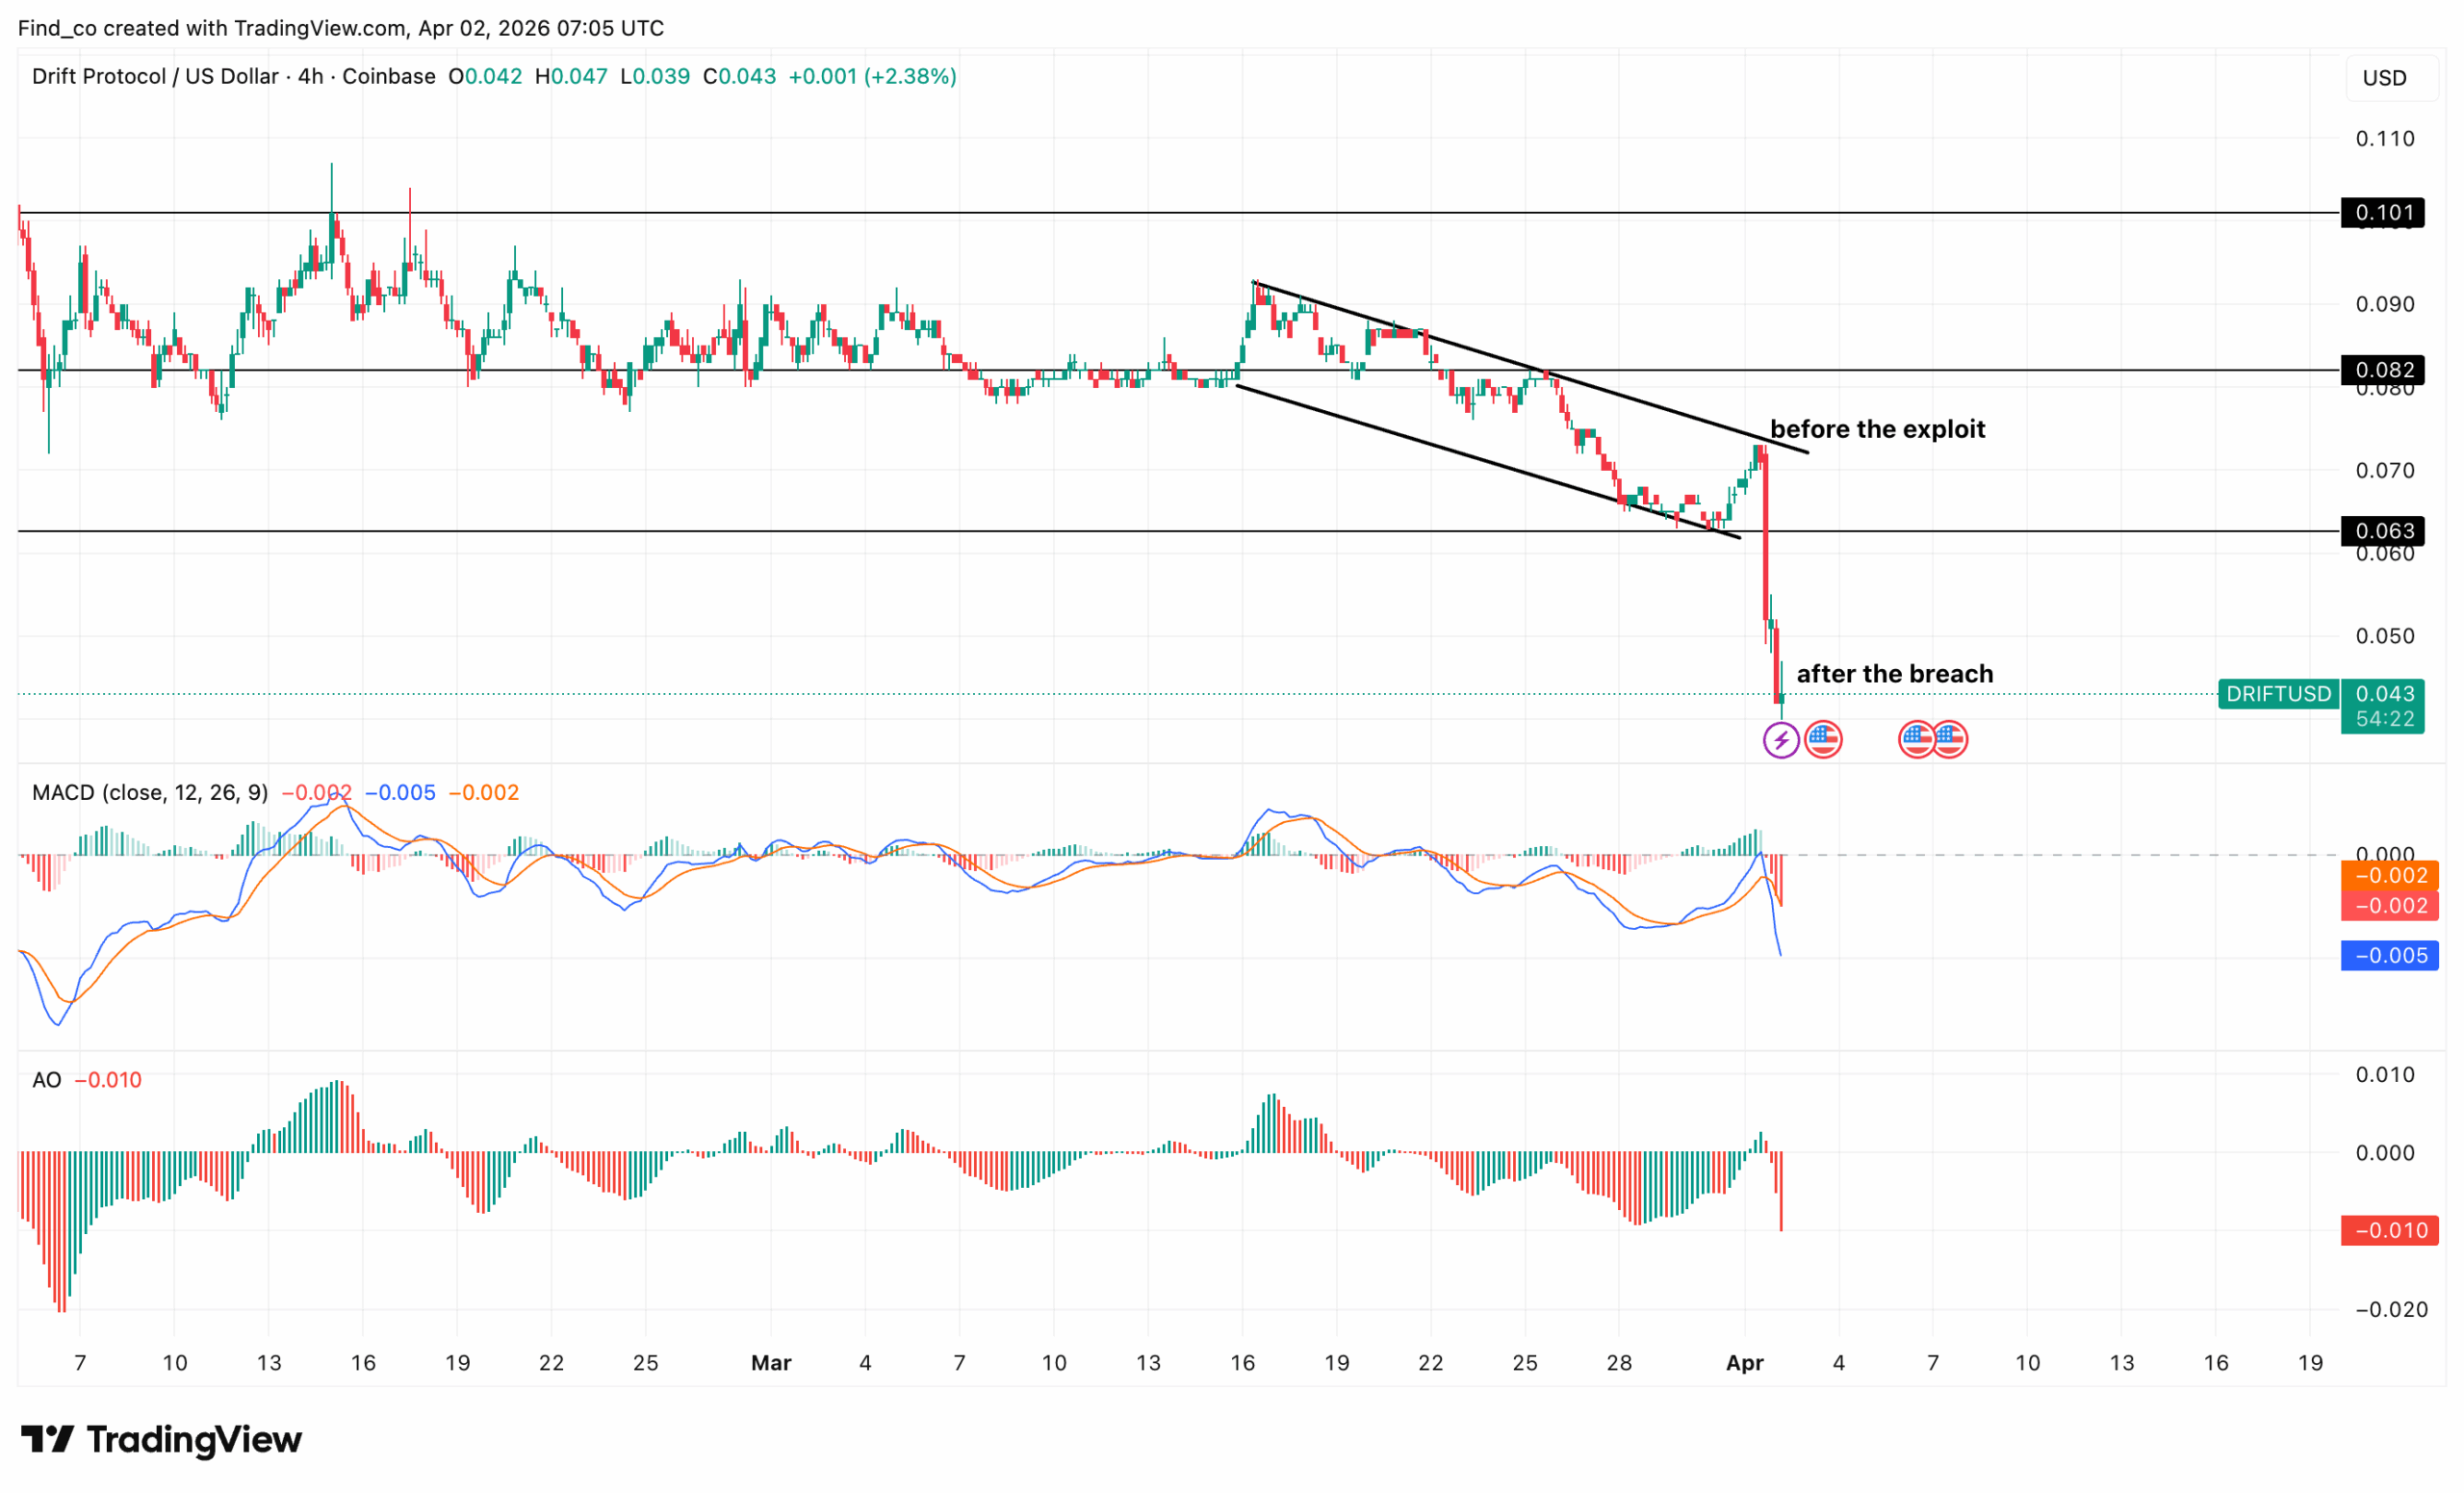
Looking at the 4-hour chart, it tells the story in two brutal phases.
Before the exploit, a descending channel had already been pressuring the DRIFT price from $0.082 toward $0.063.
This indicates that sellers were already in control even before the crisis hit. Then, on April 1, everything collapsed.
Drift Protocol confirmed it was experiencing an active attack, suspending deposits and withdrawals while coordinating with multiple security firms to contain the incident.
Get These Top Crypto Casino Offers Now!
Sponsored
Disclosure
We sometimes use affiliate links in our content, when clicking on those we might receive a commission at no extra cost to you. By using this website you agree to our terms and conditions and privacy policy.
The scale of the damage is staggering. Approximately $285 million in crypto was drained from the protocol, with some stolen assets converted into USDC.
Recovery from an exploit of this magnitude requires not just price stabilization, but a credible security audit, a user compensation plan, and restored community trust.
However, none of these exist yet. So, as it stands, DRIFT might continue to trade sideways until a resolution is reached.
Higher Volume, Bearish Sentiment
Outside the technical outlook, the social data behind DRIFT’s collapse is as devastating as the price action itself.
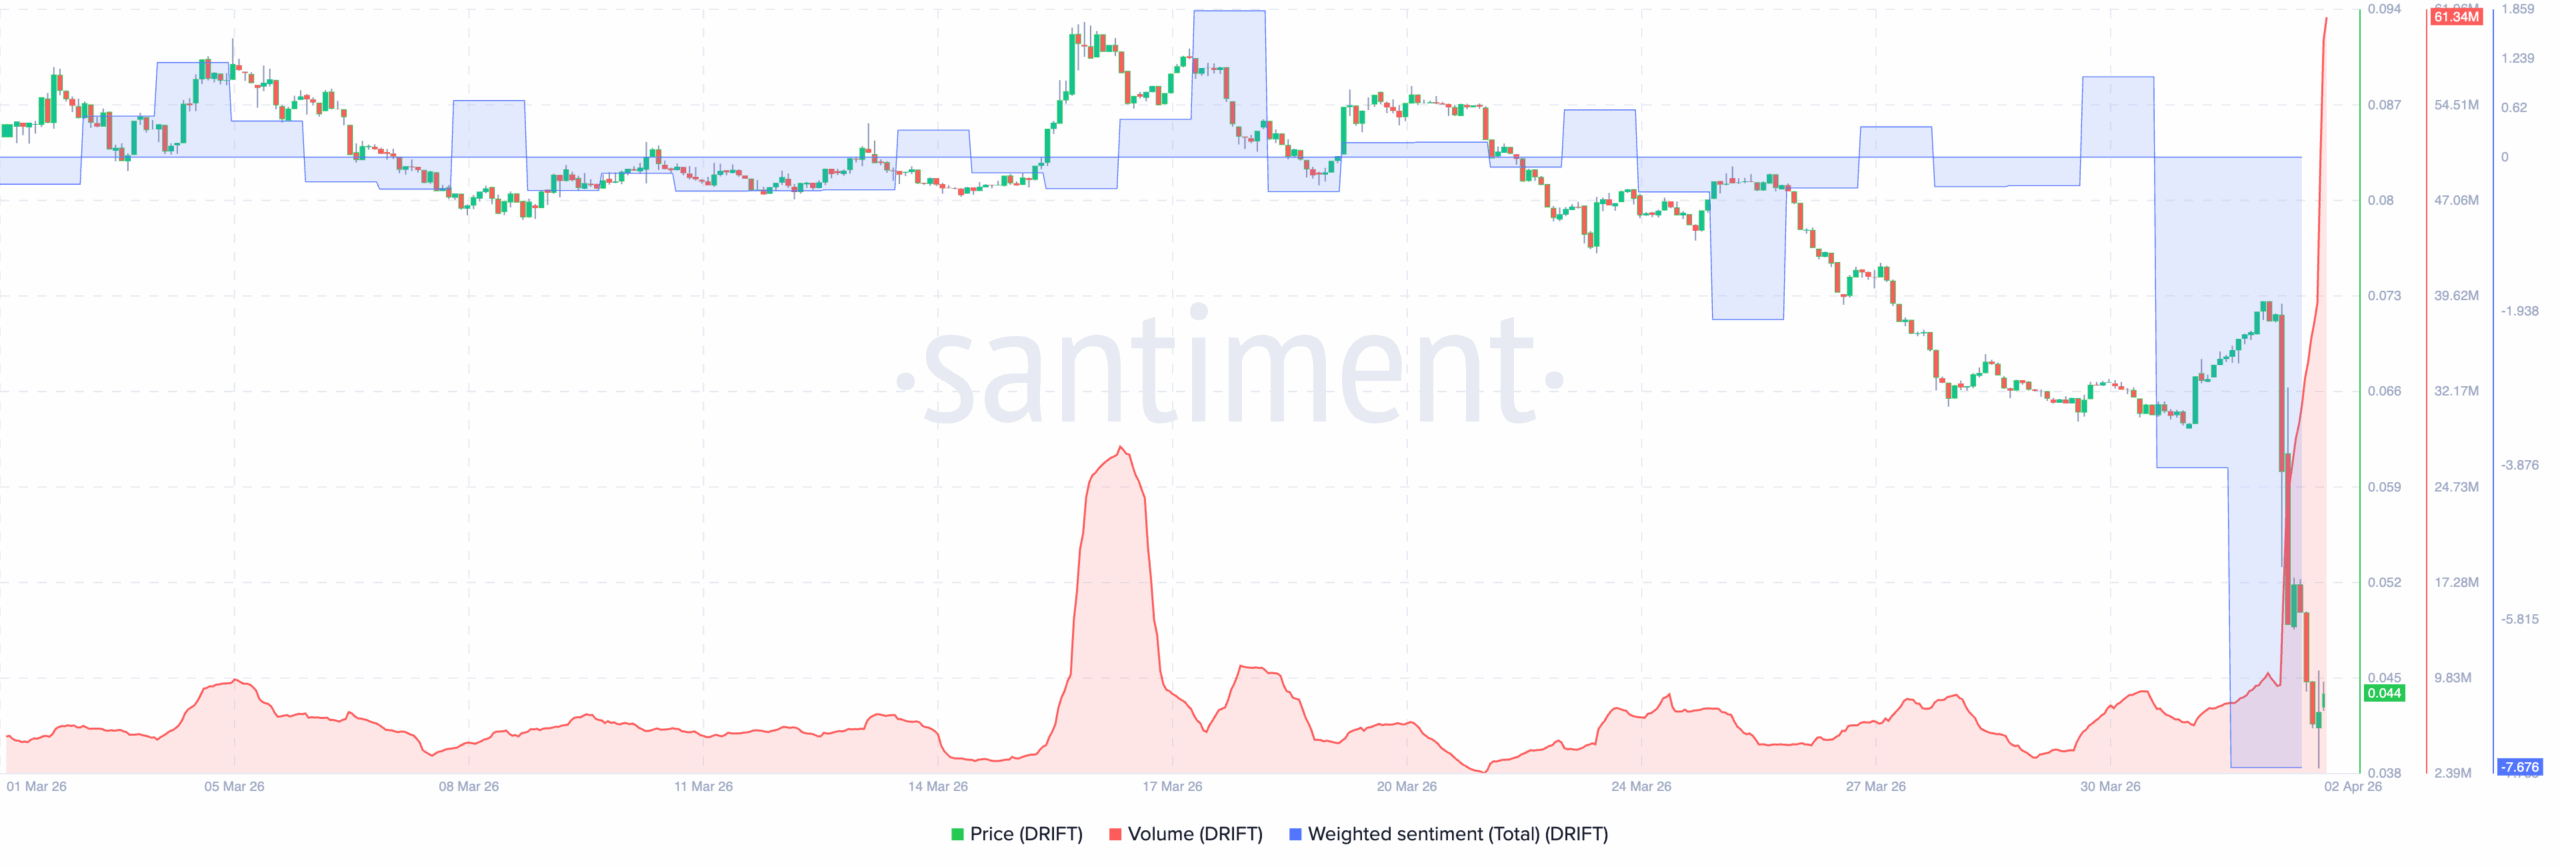
According to the Santiment chart below, March 1 to April 2 captures the precise moment community trust disintegrated
Throughout March, sentiment oscillated in a relatively narrow range, dipping briefly during price weakness but never signalling genuine crisis.
The largest prior volume spike arrived around March 17, coinciding with a brief price recovery to $0.094.
Then April 1 changed everything. DRIFT’s trading volume exploded to a record 61.34 million, dwarfing every prior reading on the chart by an enormous margin.
But unlike typical volume spikes that accompany rallies, this one accompanied a catastrophic collapse.
Simultaneously, weighted sentiment cratered to -7.68. This decline sparked the community’s instantaneous, unanimous reaction: shock, anger, and fear.
That sentiment is significant beyond just reflecting emotion. At -7.676, DRIFT’s social narrative is dominated by negative discussion — exploit coverage, user warnings, loss reports, and protocol criticism.
Historically, sentiment this extreme either marks absolute capitulation before a dead-cat bounce or the beginning of a prolonged correction.
DRIFT Weighted Sentiment and Volume | Credit: Santiment
The critical difference here versus typical oversold sentiment reads is context. By the looks of things, DRIFT’s price might bounce briefly.
However, it is unlikely to erase all of the recent losses anytime soon.
Furthermore, it appears that the derivatives market saw DRIFT’s trouble coming.
No Short Squeeze Soon
Based on the Coinglass funding rate chart from Nov. 28, 2025, through April 2, 2026, the metric remained persistently negative, indicating shorts consistently paid longs.
The one brief exception came around Jan. 23–28, when funding briefly turned positive alongside a price recovery to $0.20.
That optimism evaporated quickly. Since then, funding flipped negative again almost immediately and never recovered.
However, the exploit triggered the most extreme negative funding reading on the entire chart, nearly -1.80%, as panic selling and forced liquidations overwhelmed any remaining buyers.
In the meantime, every indicator on DRIFT’s daily chart is screaming the same thing.
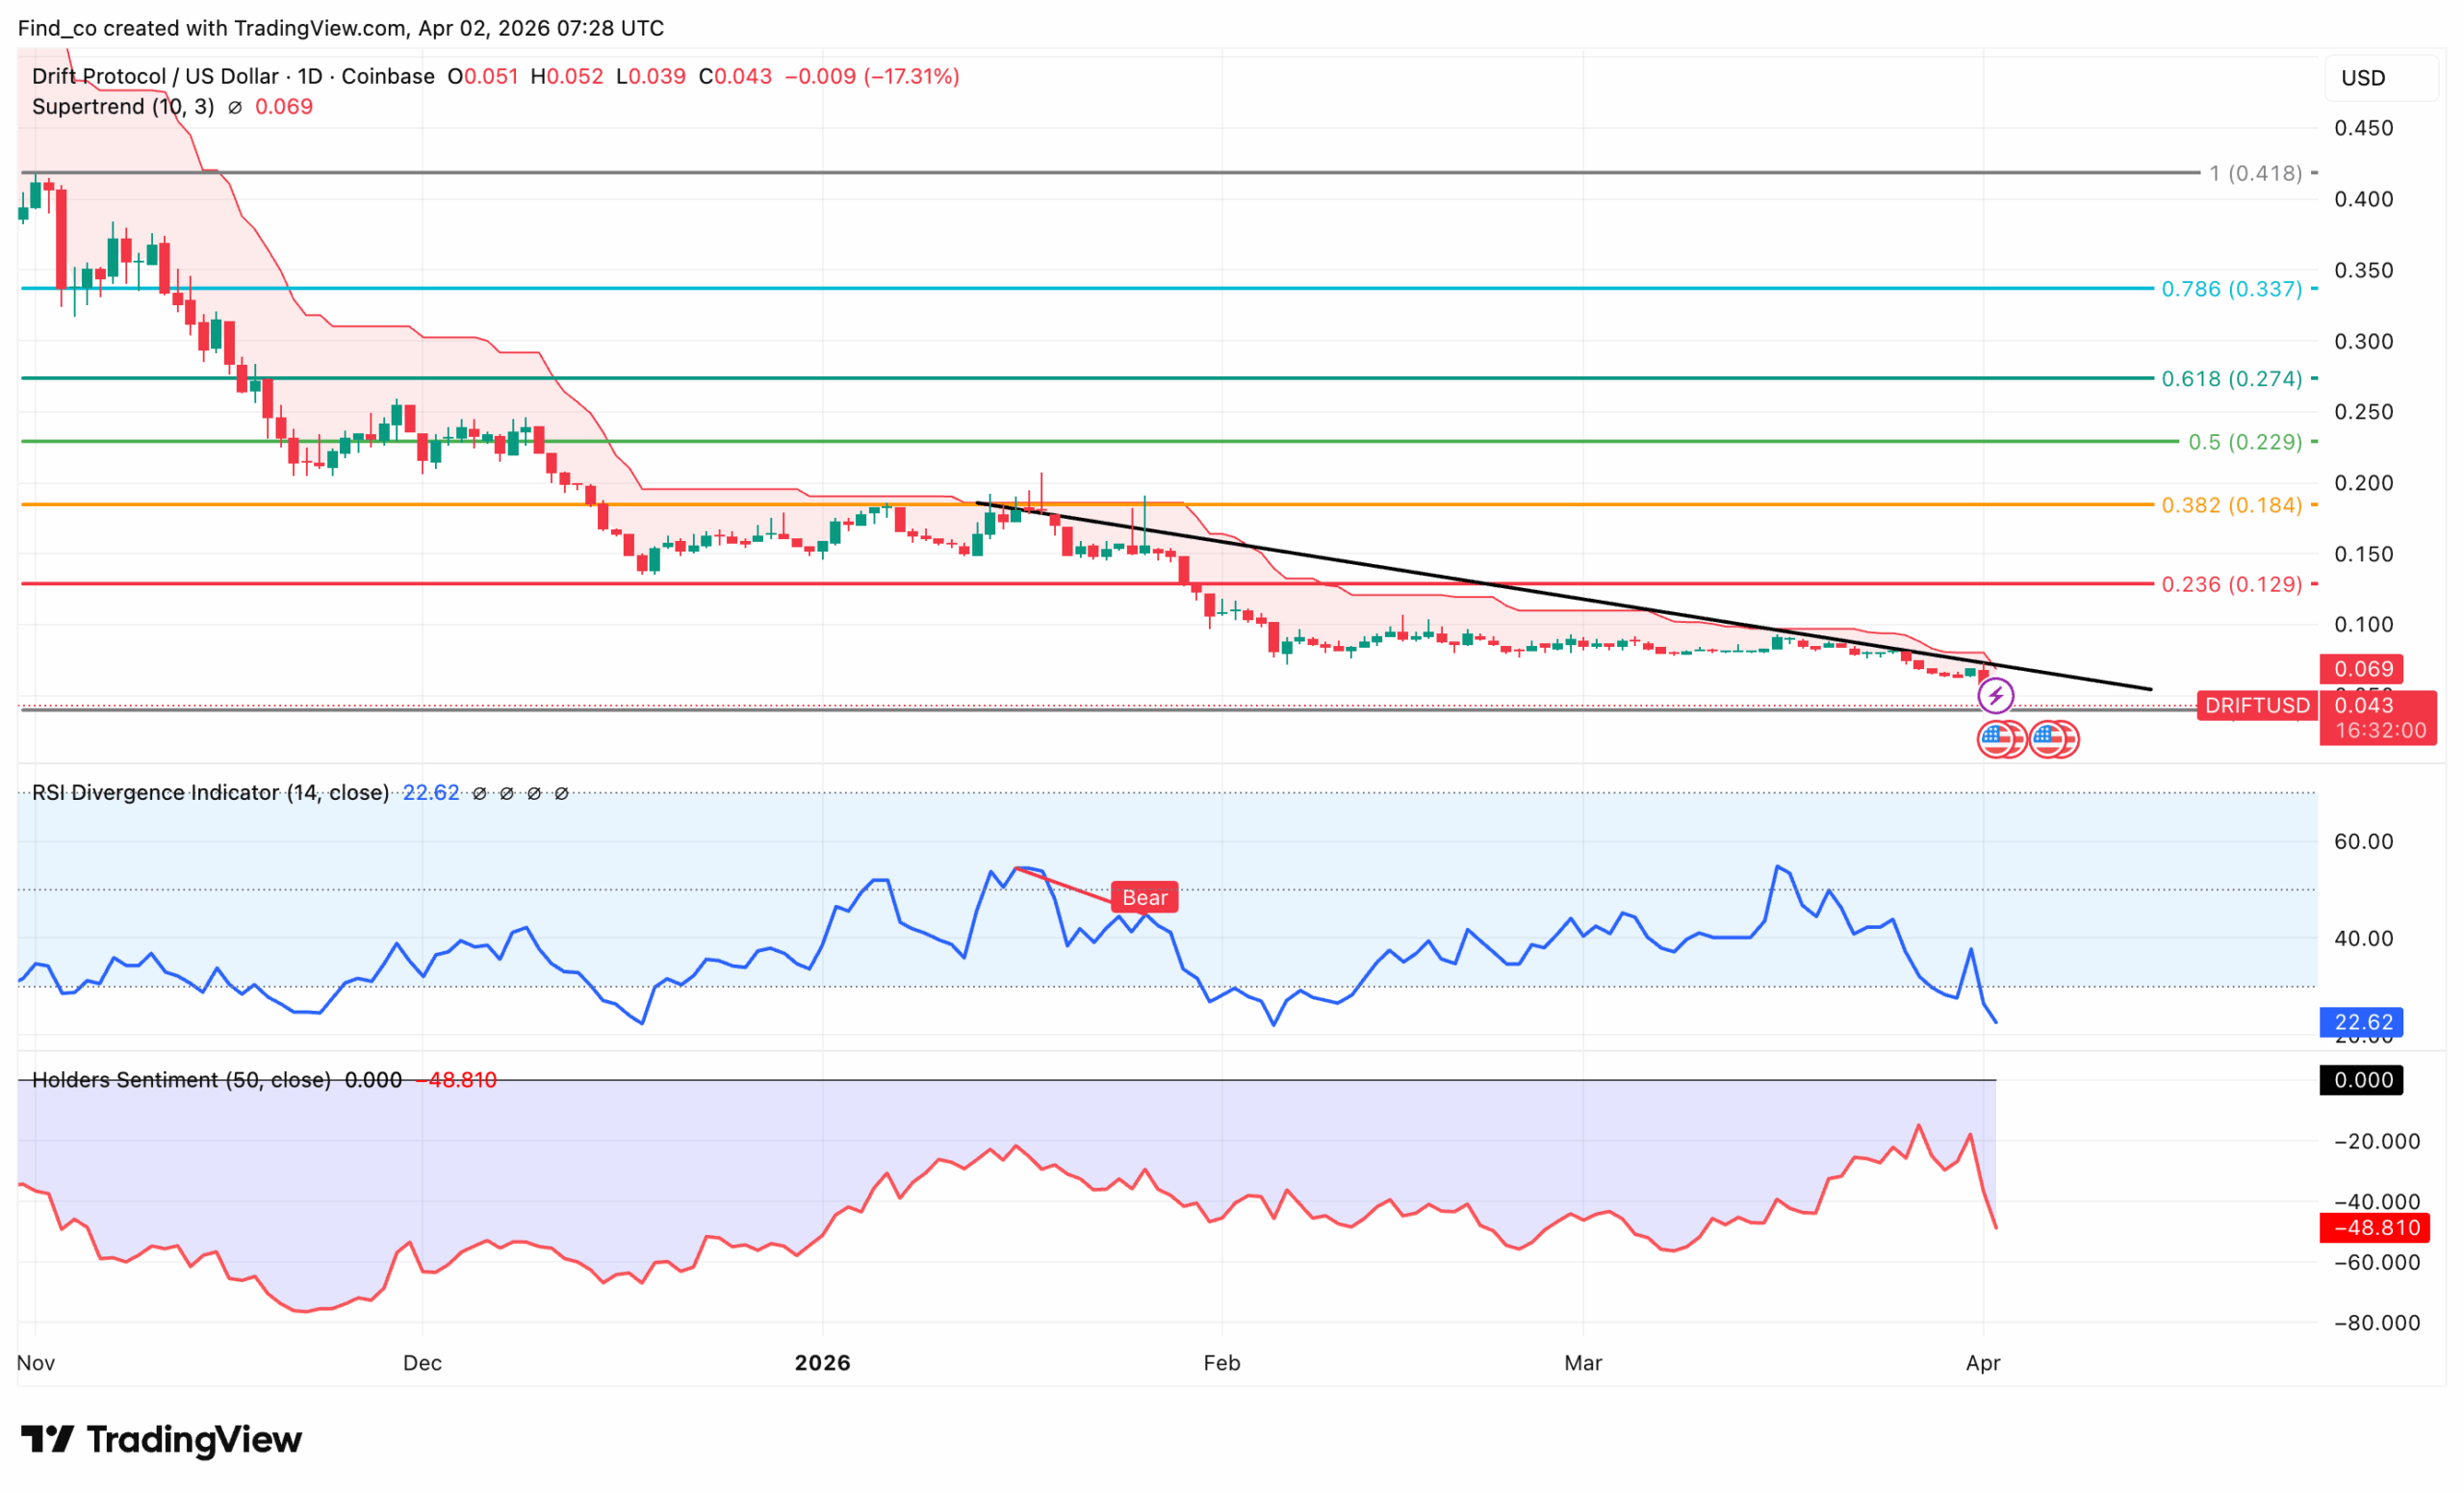
While the altcoin has risen slightly to $0.043, it has lost nearly all its value since its November 2024 listing.
The Fibonacci map reveals the full scale of the destruction.
At the time of writing, DRIFT’s price has sliced through every level (0.786, 0.618, 0.5, 0.382, and 0.236) without meaningful support at any of them.
In addition, the Parabolic SAR at $0.069 is above the price, indicating a confirmed bearish mode, and a descending trendline has capped every recovery since February.
The indicators are at historically extreme levels. The RSI has crashed to 22.62, indicating it is deeply oversold.
Meanwhile, Holders Sentiment has collapsed to -48.810, suggesting near-total loss of confidence among remaining holders.
Under normal circumstances, an RSI of 22 and a sentiment of -48 would represent a contrarian buying opportunity.
However, DRIFT’s situation is categorically different. This isn’t a market cycle issue as it’s a fundamental protocol crisis.
A $285 million exploit, suspended withdrawals, and no confirmed recovery plan mean the usual oversold playbook doesn’t apply here.
Oversold can become more oversold when trust is destroyed. Until Drift publishes a credible compensation framework and resumes normal operations, these extreme readings are warning signs, not buy signals.
Disclaimer:
The information provided in this article is for informational purposes only. It is not intended to be, nor should it be construed as, financial advice. We do not make any warranties regarding the completeness, reliability, or accuracy of this information. All investments involve risk, and past performance does not guarantee future results. We recommend consulting a financial advisor before making any investment decisions.
Victor Olanrewaju is a crypto analyst and reporter at CCN with deep roots in on-chain research and technical analysis. His crypto journey began in 2017, but it was the 2020 Uniswap airdrop that sparked a full-time pivot into the space.
With a foundation in copywriting, Victor honed his craft creating high-converting content for leading crypto brokers — most notably an XRP price prediction that ranked #1 on Google during the 2021 bull run.
He later joined AMBCrypto in 2022, where he combined storytelling with technical and on-chain analysis to cover key market narratives.
In 2024, he expanded his expertise at BeInCrypto, collaborating with analysts and using tools like Glassnode, Santiment, and IntoTheBlock to break down Bitcoin and altcoin trends.
At CCN, Victor covers the top cryptocurrencies, memecoins, macro shifts, blending real-time insights with deep-dive metrics.
He holds a Bachelor’s degree in Physics from the University of Ibadan, equipping him to simplify complex data for a wide audience. Follow his work or connect on LinkedIn or X.