How Long Will Cardano's Bounce Continue? | Credit: Hameem Sarwar
Share
Key Takeaways
Cardano (ADA) trades inside a descending parallel channel.
ADA finally broke down from the $0.60 horizontal support area.
Can ADA reclaim this support level, or is it doomed for new lows?
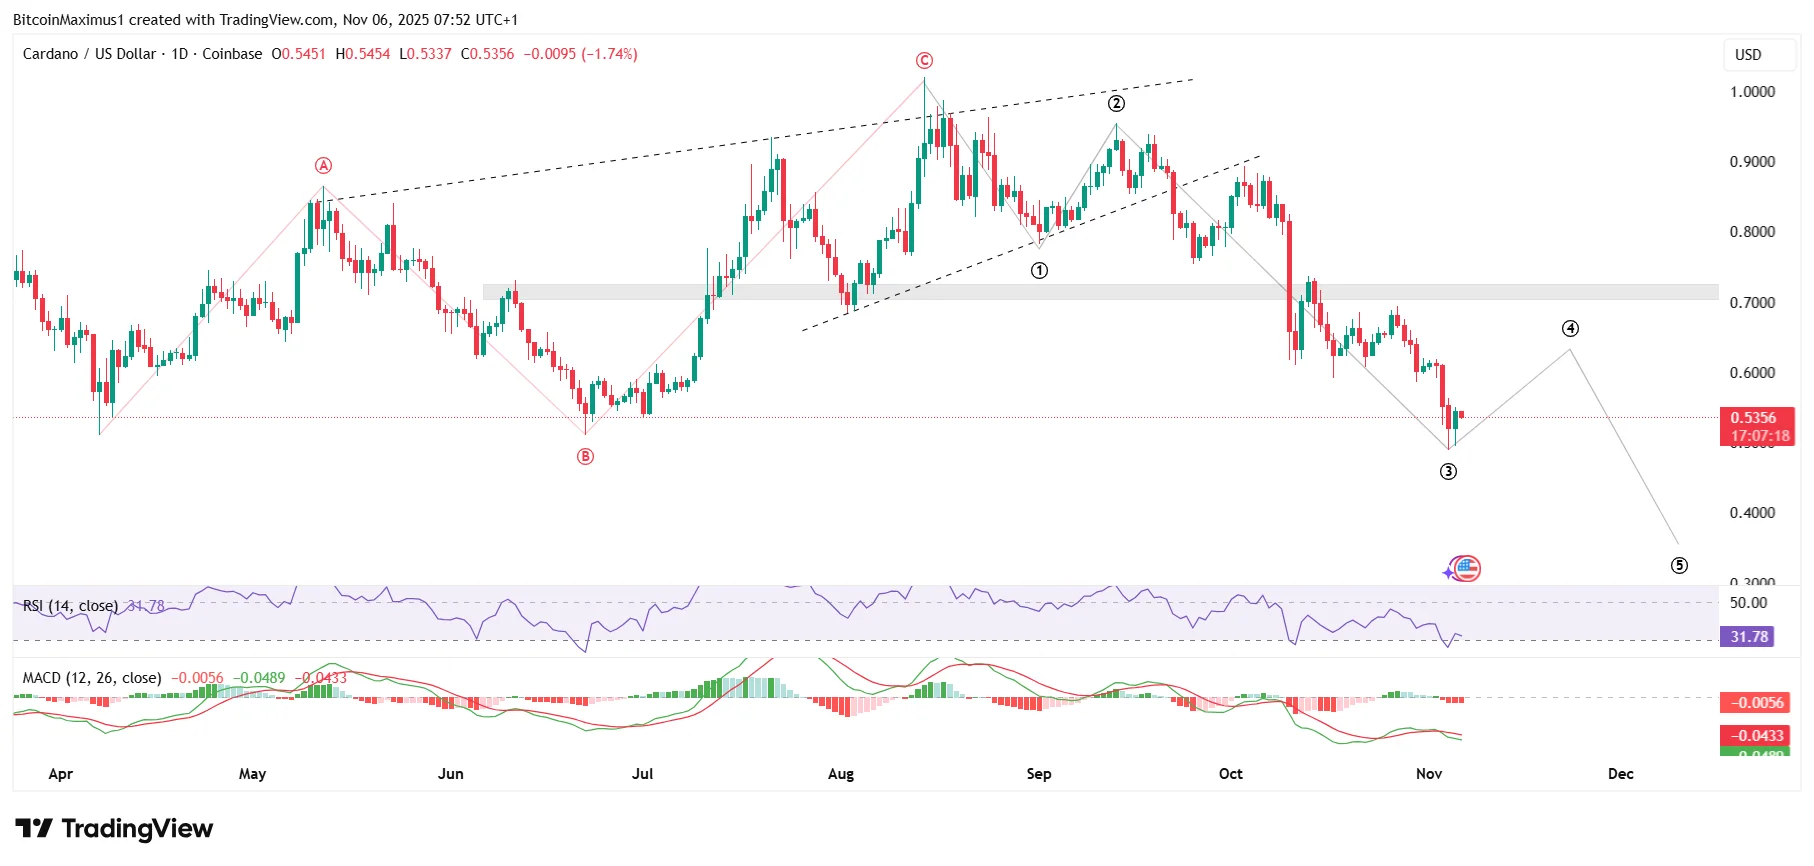
Cardano (ADA) continues to trade downward, falling within the lower portion of a descending parallel channel that has been in place for nearly a year.
While ADA repeatedly prevented a breakdown from the $0.60 level, it finally gave in this week and currently trades below this level.
Unless Cardano reclaims this crucial level, the long-term trend will remain bearish.
Let’s examine the charts and determine if there is any chance of a bullish trend reversal.
Cardano’s Bearish Price Action
The weekly chart shows that Cardano’s ADA has been in a steady decline since December 2024, when it reached its cycle high of $1.33.
Since then, ADA has moved within a descending parallel channel, a corrective pattern that typically ends with an upward breakout — but that hasn’t been the case this time.
Get These Top Crypto Casino Offers Now!
Sponsored
Disclosure
We sometimes use affiliate links in our content, when clicking on those we might receive a commission at no extra cost to you. By using this website you agree to our terms and conditions and privacy policy.
Valdrin Tahiri is a cryptocurrency analyst and reporter at CCN, specializing in technical analysis with a focus on Elliott Wave theory, on-chain metrics, and fundamental research. He brings over seven years of experience in the crypto space as both a trader and writer.
He discovered cryptocurrencies in 2017 while earning his MSc in Financial Markets at the Barcelona School of Economics, which sparked a deep interest in blockchain and market dynamics. Since then, he’s contributed to top crypto outlets like BeInCrypto and CoinGape.
Valdrin also served as Community Manager of BeInCrypto’s Telegram group for three years, helping grow it into one of the largest crypto communities worldwide. His expertise in market structure and price patterns allows him to break down complex trends into clear, actionable insights.
He’s published thousands of articles covering altcoins, Bitcoin cycles, and macro trends.