BNB is gaining support from Binance ecosystem growth, token burns, and network upgrades. Here's why analysts remain bullish. | Credit: CCN.com
Share
Key Takeaways
BNB’s price has dropped 55% from its all-time high, yet bulls are defending this $600 psychological level.
Liquidation data shows limited selling pressure, meaning dips are being flushed by overleveraged bulls.
BNB’s price risk falling to the zero Fib level near $577; if support holds, upside could extend toward $766.
BNB’s price action trend hangs in the balance, as sellers have driven the asset’s price down 55% from its all-time high.
Yet buyers are defending the psychological $600 level.
Now, pressure builds around this same support level. In this analysis, CCN reveals how a move from this level could positively or negatively redefine the chart’s structure.
BNB 4-Hour Chart Signals Inconsistency
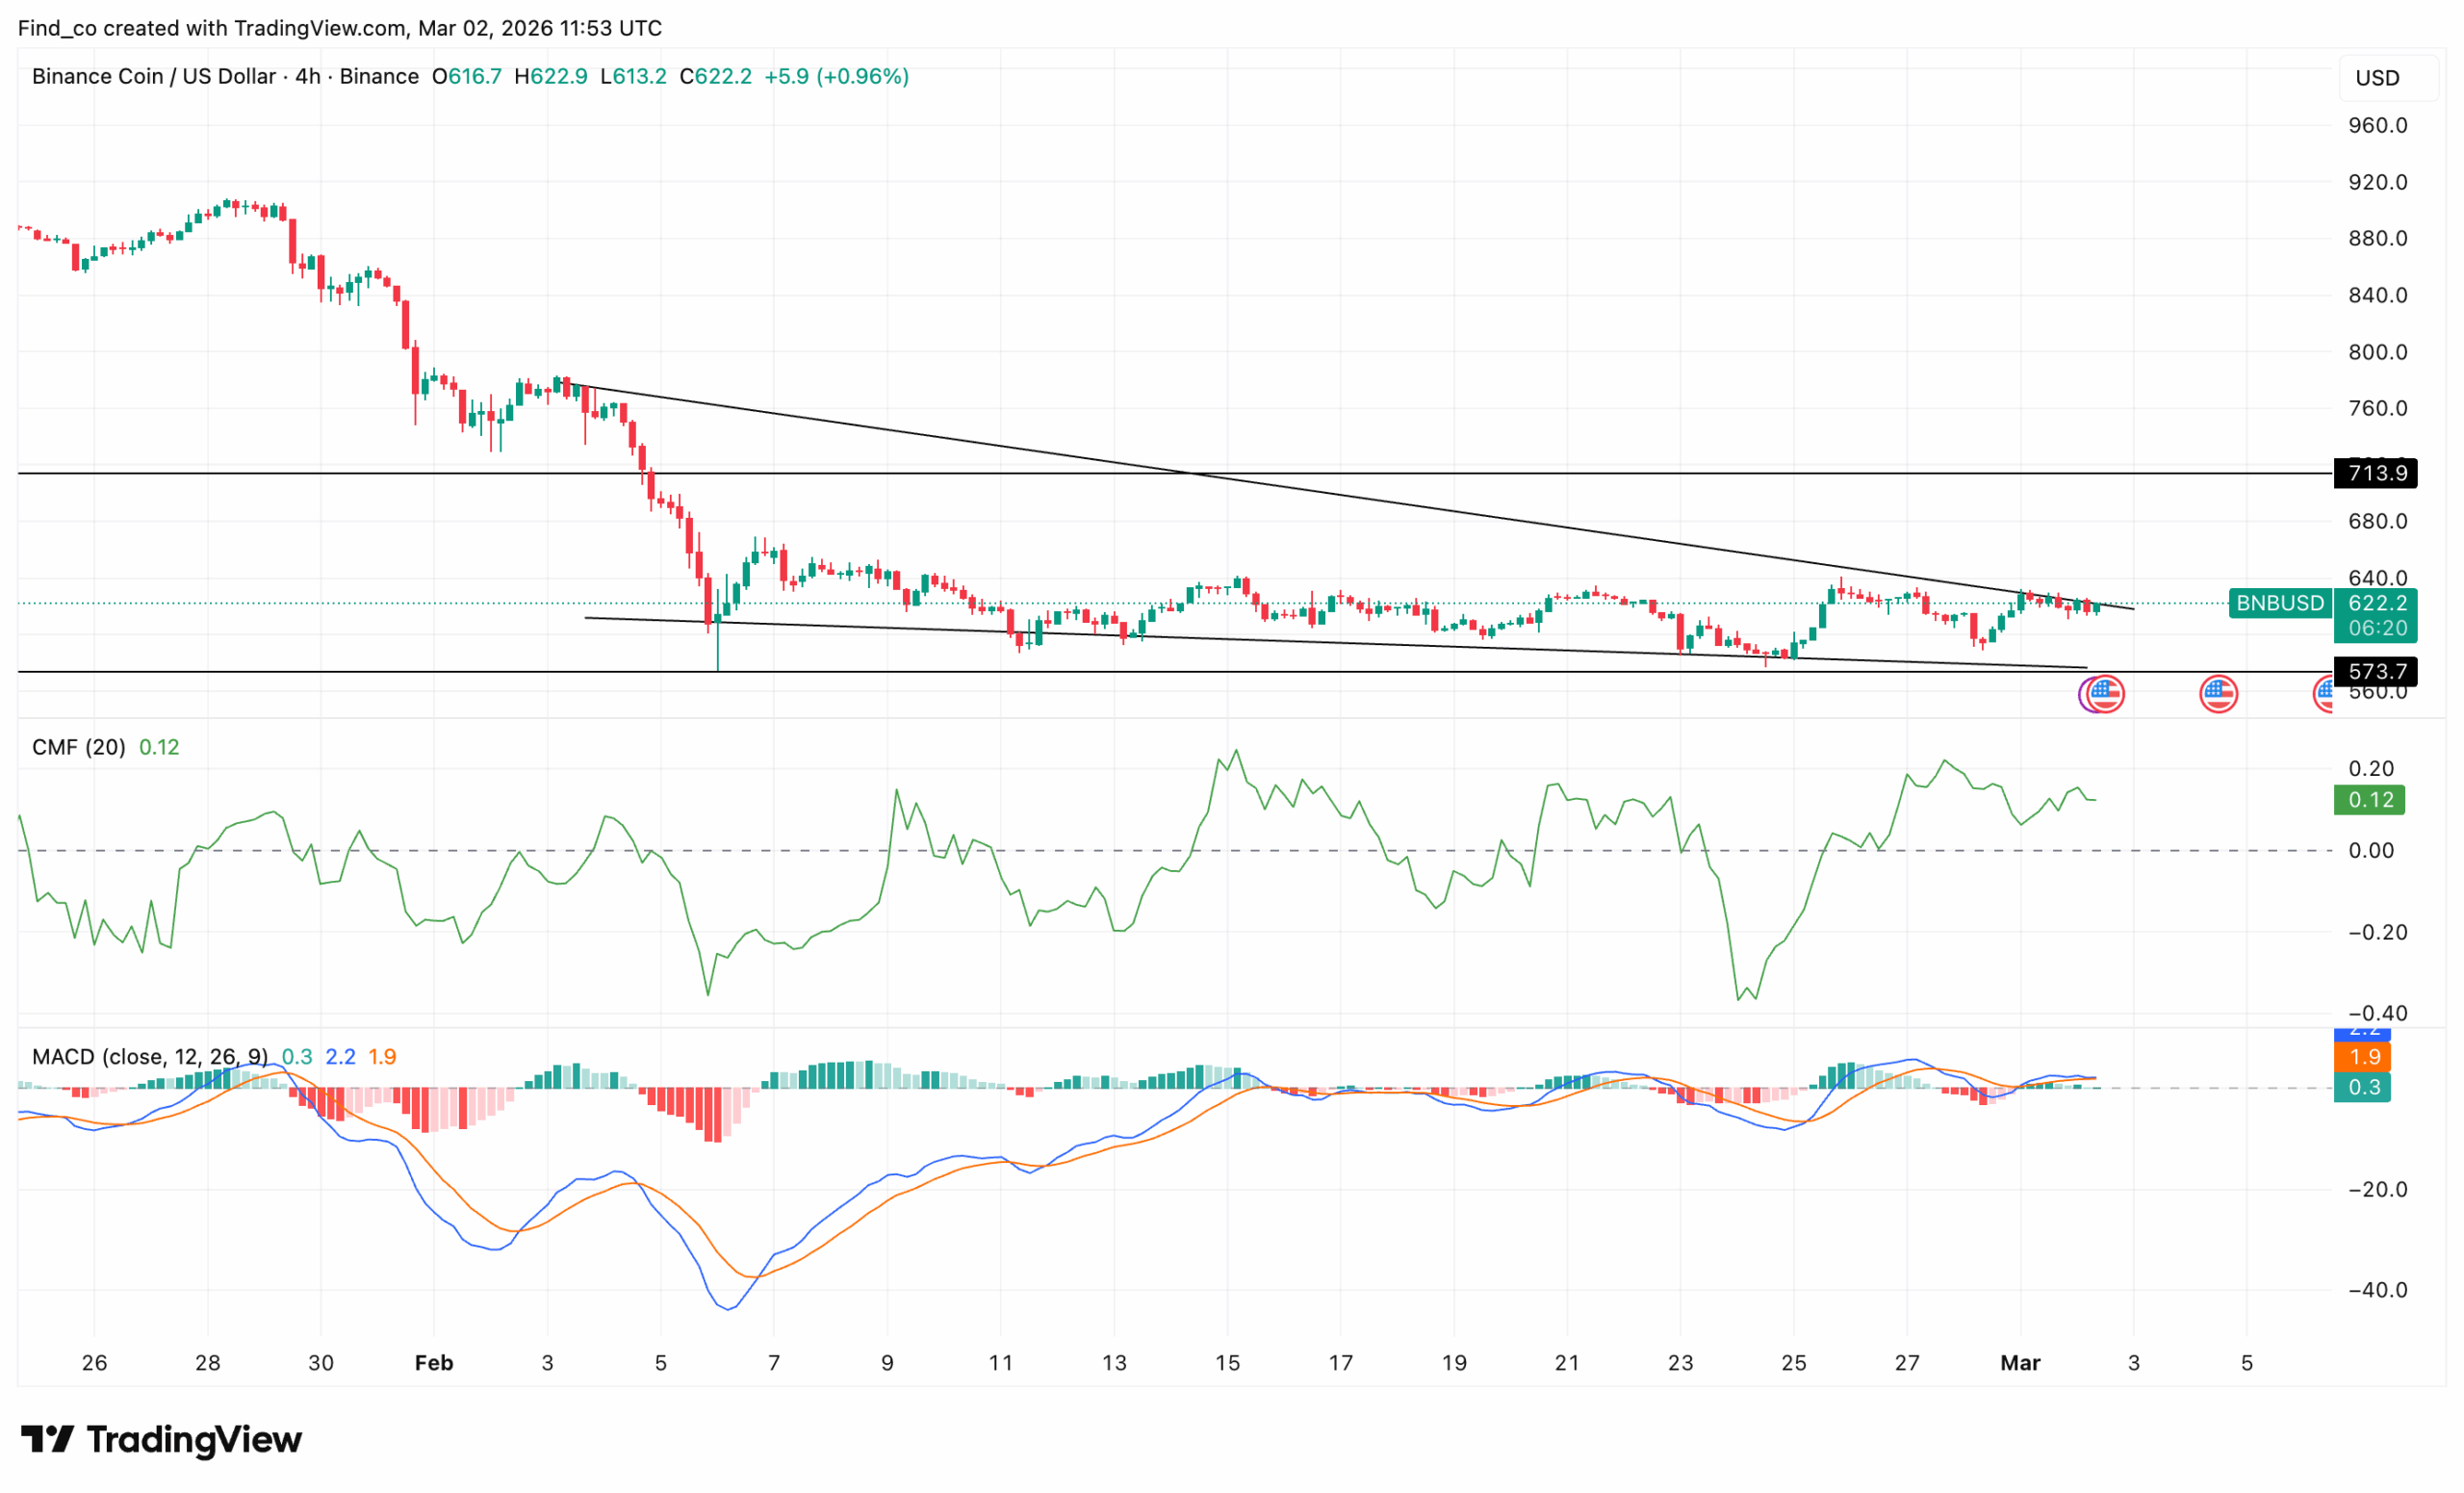
On the 4-hour chart, BNB remains under pressure, as price continues to respect a descending trendline that has capped rallies since early February. Each attempt is quickly met with renewed selling pressure.
However, downside momentum is slowing down. The indicator shows price compressing between falling resistance and a rising base near the $580 zone. This tightening range signals volatility contraction.
Typically, such compression precedes expansion.
Meanwhile, capital inflows support the market. The Chaikin Money Flow (CMF) reads 0.13, indicating steady buying pressure. This suggests accumulation rather than distribution.
Still, buyers lack the power to force a breakout. As such, BNB’s price might keep trading sideways.
Momentum indicators confirm hesitation. The Moving Average Convergence Divergence (MACD) is slightly positive, yet the histogram bars shrink.
That shift signals a weakening bullish impulse. In other words, buyers are present but cautious.
Technically, BNB sits at a decision point. In the short term, structure favors range trading. If capital inflows persist, upside pressure could set in.
Liquidations Signal Limited Pressure
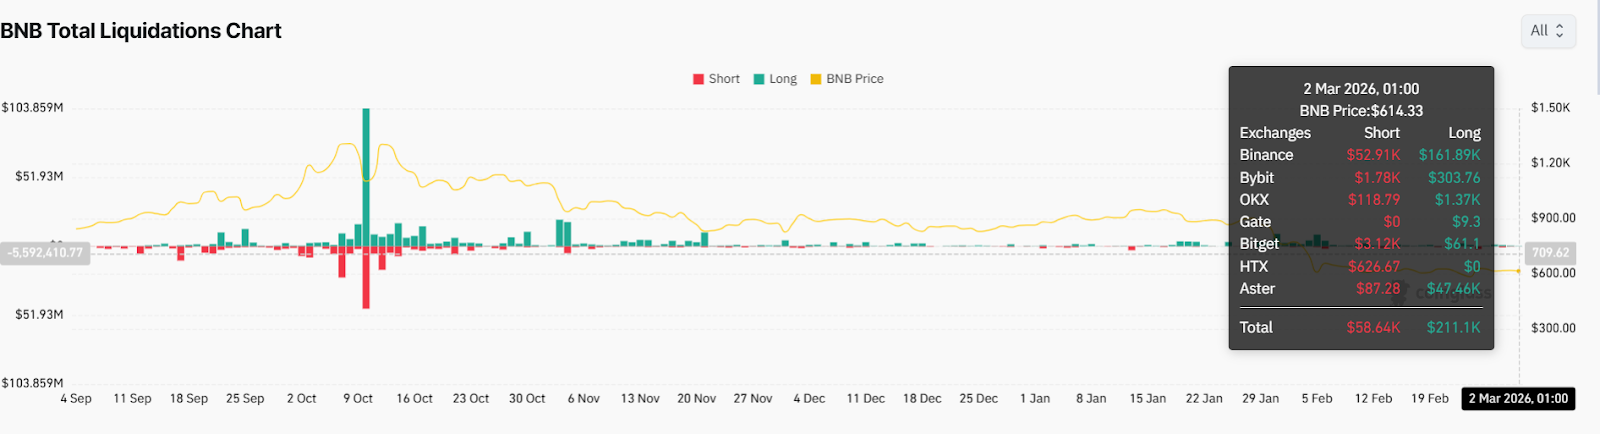
Liquidation data shows mild long-side pressure as BNB trades around $614, now holding above the key $600 level.
Recent liquidations were relatively small, with longs accounting for the majority. That suggests dips below and around $600 flush overleveraged bulls rather than triggering a meaningful short squeeze.
Sellers pressured the market, but not aggressively enough to cause broad capitulation.
Importantly, $600 has shifted from resistance to immediate support.
As long as BNB’s price holds above it, stabilization remains intact. A break back below $600 would likely increase liquidation pressure and expose $577 again.
BNB Price Forecast: Fragile Rebound
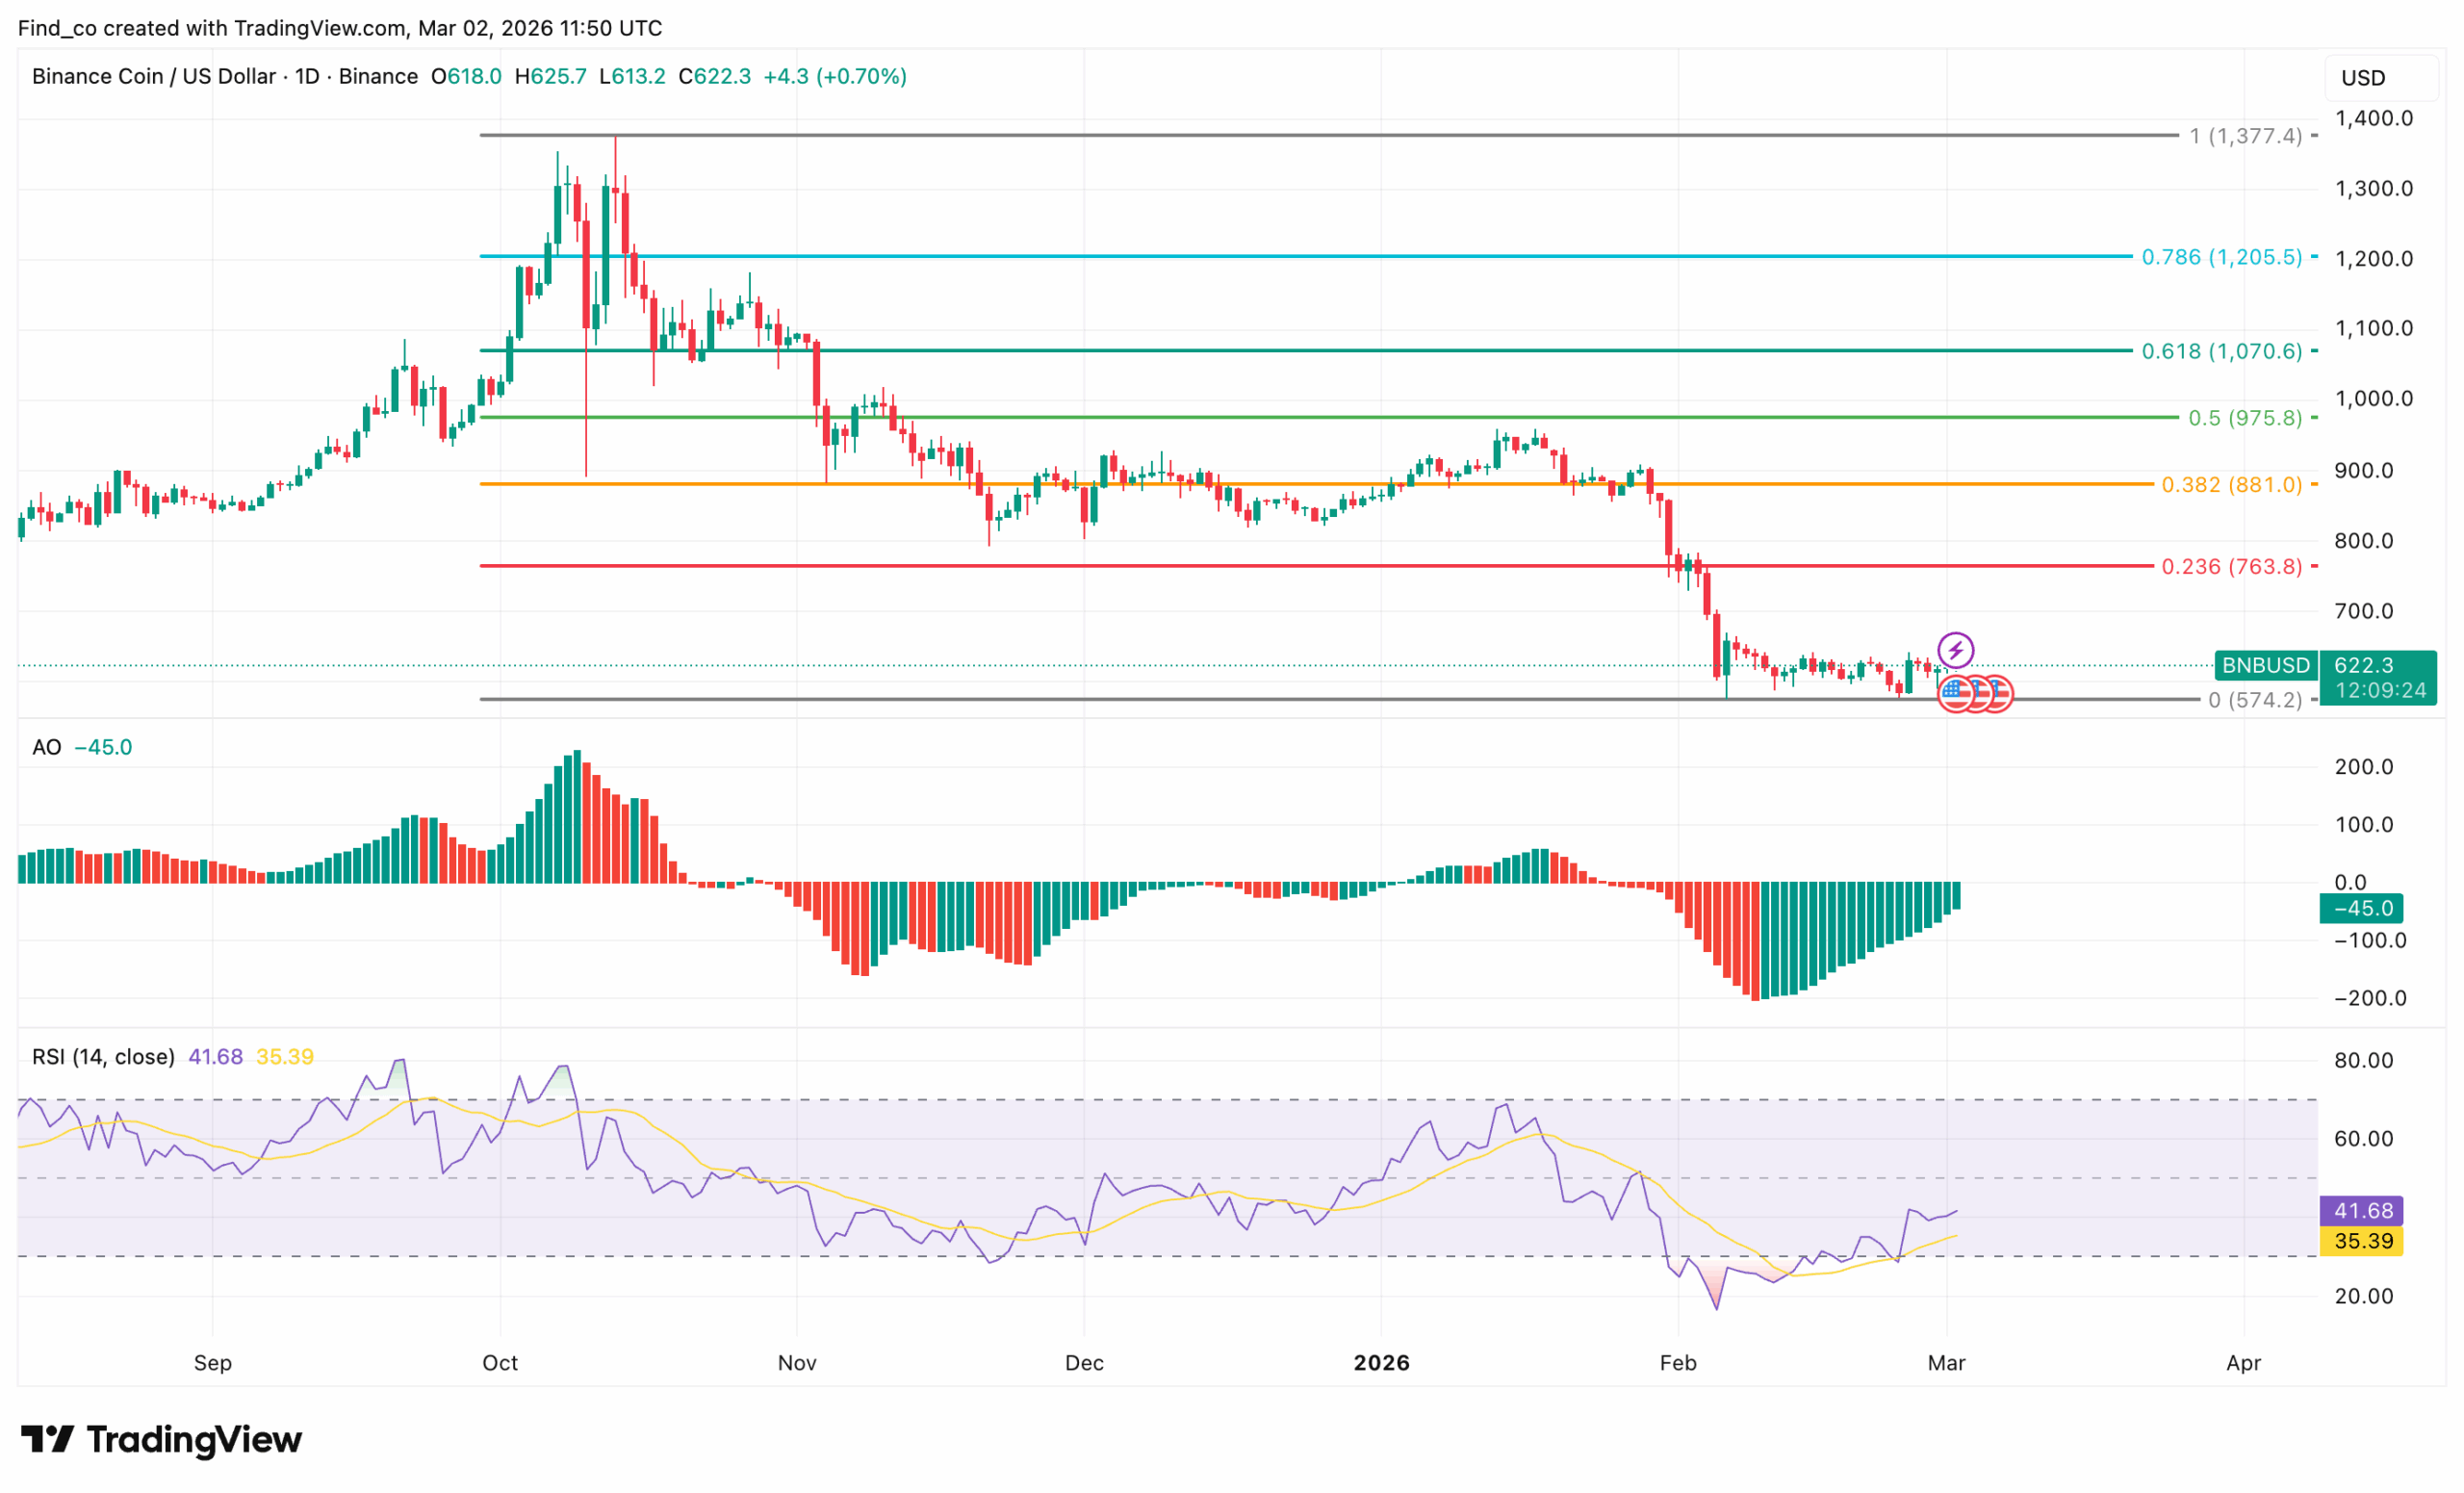
On the daily chart, BNB’s price has completed a near-full Fibonacci retracement from its all-time high, slicing through the 0.382, 0.5, and 0.618 levels in succession.
The most recent capitulation wick tagged the zero Fib level around $577, where buyers stepped in aggressively.
However, BNB is no longer trading below $600. Price has recovered and now hovers around $614, meaning the $600 zone has already been reclaimed.
That shift changes the immediate structure. Instead of acting purely as overhead resistance, $600 now becomes a short-term support pivot. The key question is whether bulls can defend it on pullbacks.
If BNB’s price holds above $600, it strengthens the case for a relief rally toward $766.40, which aligns with the 0.236 Fibonacci retracement.
A sustained push beyond that region could open the path toward $883.50 near the 0.382 level, an area that previously served as consolidation support before the breakdown.
Nevertheless, the broader structure remains fragile. The descending trendline from the peak is still intact, and BNB continues to trade be
Momentum reflects this tension. The Awesome Oscillator (AO) remains in negative territory despite printing consecutive green bars, suggesting bearish momentum is weakening but not reversed.
Meanwhile, the relative strength index (RSI) sits near 40, indicating buyers are attempting to recover control but lack strong conviction.
Therefore, the focus shifts from reclaiming $600 to defending it. A sustained move above $600 keeps stabilization intact and raises the probability of a push toward $766.40.
Disclaimer:
The information provided in this article is for informational purposes only. It is not intended to be, nor should it be construed as, financial advice. We do not make any warranties regarding the completeness, reliability, or accuracy of this information. All investments involve risk, and past performance does not guarantee future results. We recommend consulting a financial advisor before making any investment decisions.
Victor Olanrewaju is a crypto analyst and reporter at CCN with deep roots in on-chain research and technical analysis. His crypto journey began in 2017, but it was the 2020 Uniswap airdrop that sparked a full-time pivot into the space.
With a foundation in copywriting, Victor honed his craft creating high-converting content for leading crypto brokers — most notably an XRP price prediction that ranked #1 on Google during the 2021 bull run.
He later joined AMBCrypto in 2022, where he combined storytelling with technical and on-chain analysis to cover key market narratives.
In 2024, he expanded his expertise at BeInCrypto, collaborating with analysts and using tools like Glassnode, Santiment, and IntoTheBlock to break down Bitcoin and altcoin trends.
At CCN, Victor covers the top cryptocurrencies, memecoins, macro shifts, blending real-time insights with deep-dive metrics.
He holds a Bachelor’s degree in Physics from the University of Ibadan, equipping him to simplify complex data for a wide audience. Follow his work or connect on LinkedIn or X.