BNB’s price has shifted from a pullback to a trend breakdown, down 23% YTD.
A death cross setup and resistance around $880 have restricted any bounce.
Support near $697 is acting as the last line of defense amid the current outlook.
BNB is starting to trade like a token that’s losing its trend, not just absorbing a pullback.
After a brutal January marked by the “Warsh Shock”-driven risk-off wave, BNB’s price is down roughly 23% from its New Year’s highs.
At the time of writing, the altcoin has dropped below the crucial $700 mark.
Notably, this is right on top of the kind of support zone that decides whether the rest of the quarter is a grind higher or a slow bleed lower.
But for now, it seems to be the latter. Here is why.
BNB Price Breaks Down
The technical damage is the part that bulls can’t wave away.
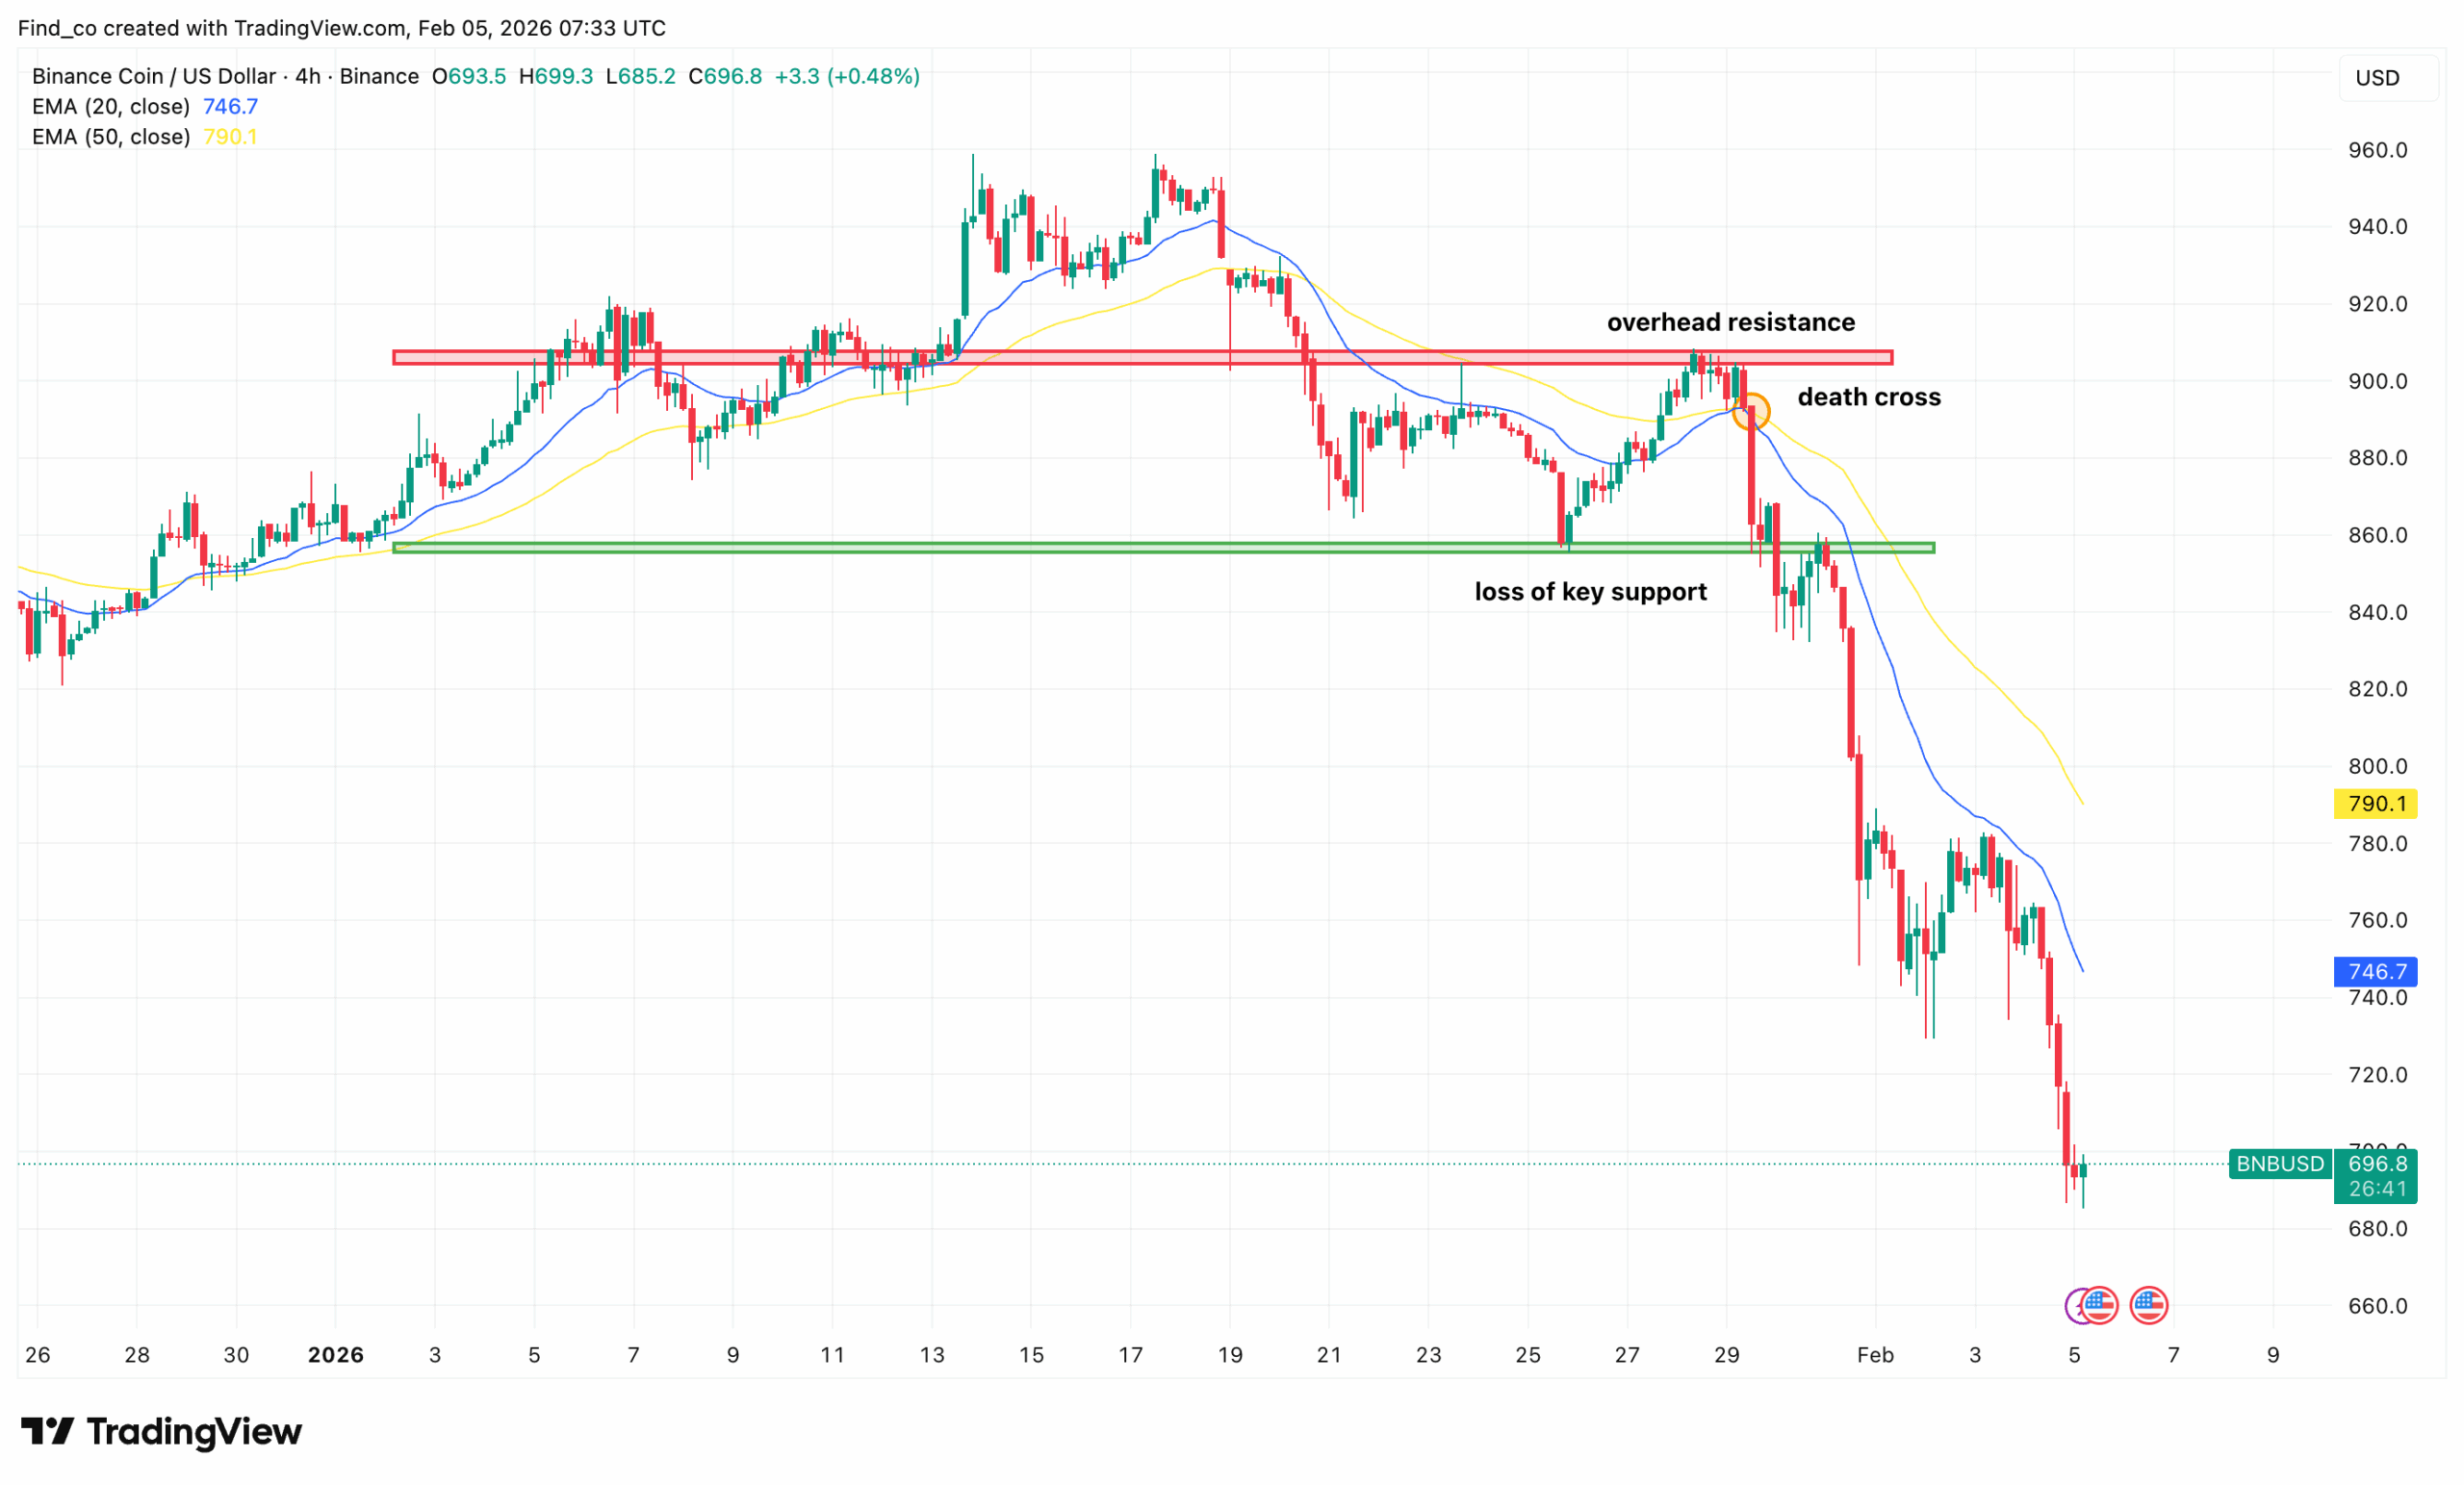
As seen below, BNB’s price has slipped below its key moving averages, with the 20-day (blue) and 50-day (yellow) EMAs converging near the $880 area and forming the “death cross” setup.
Get These Top Crypto Casino Offers Now!
Sponsored
Disclosure
We sometimes use affiliate links in our content, when clicking on those we might receive a commission at no extra cost to you. By using this website you agree to our terms and conditions and privacy policy.
That zone now acts like a heavy ceiling: even if price bounces, it has to fight through layered resistance before the market can call it a trend recovery.
The selloff has, for now, found footing around $697 — a level that’s doing “last line of defense” work.
As it stands, BNB’s price is likely to decline below that region. If that is the case, the altcoin’s market-value risk is declining to a level not seen since the 2022 bear market.
Fundamentals are trying to form a floor. However, they are not overpowering the overhead resistance yet.
Grayscale’s addition of BNB to its Digital Large Cap Fund is a clear signal of institutional acceptance. But it’s more like a slow structural bid than the kind of immediate demand that reverses a falling chart.
Binance’s reported move to rotate $1 billion of stablecoin reserves into BTC and BNB also supports the narrative — a liquidity backstop is helpful when confidence is thin.
However, the market is still pricing the macro first.
Meanwhile, ongoing compliance tightening and selective delistings keep sentiment cautious, reinforcing the view that this is a “risk management” phase for the exchange rather than an aggressive growth phase.
High Volatility Adds to the Pressure
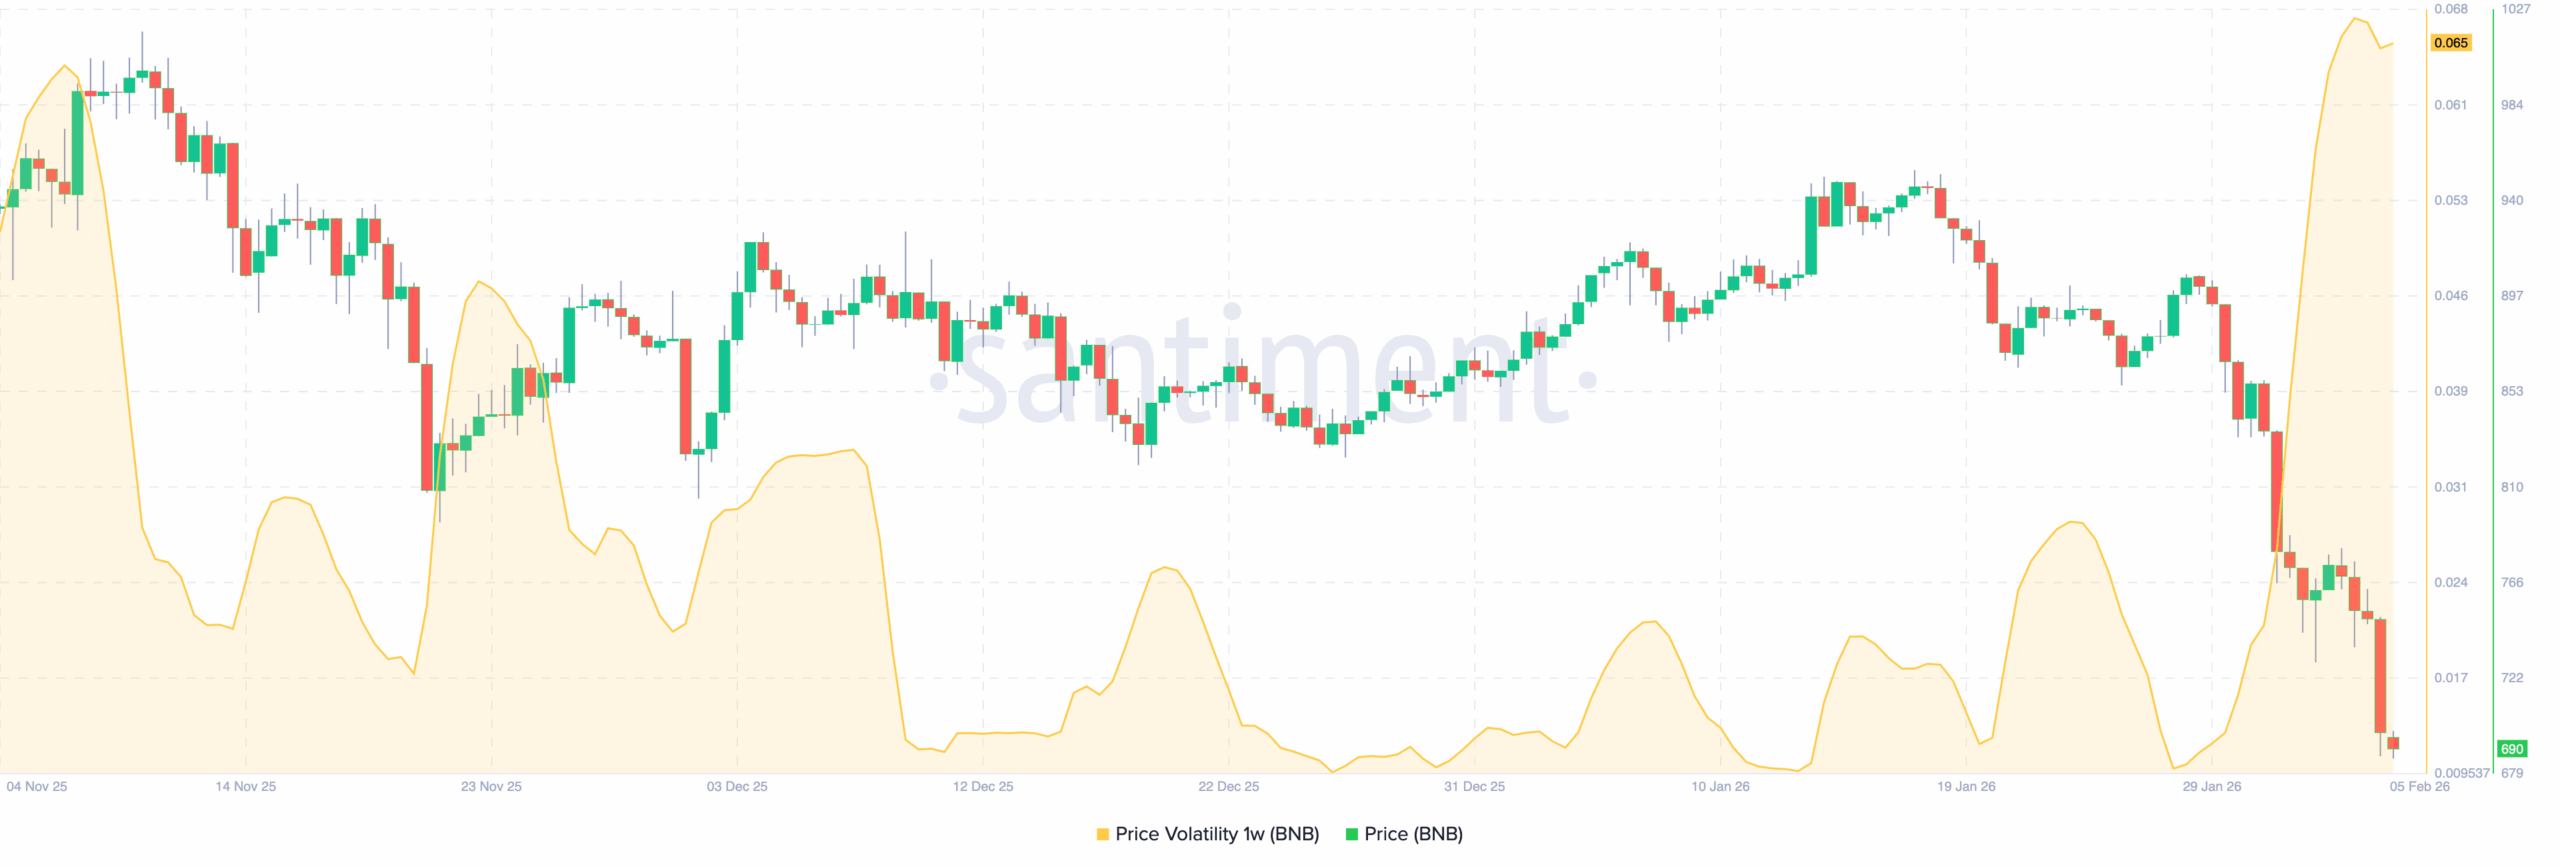
From an on-chain perspective, BNB is flashing a clear volatility warning as the price sells off sharply into early February.
The chart shows a sudden downside acceleration, with price breaking down toward the lower end of the recent structure. This move marks a decisive shift in short-term momentum after weeks of relatively orderly price action.
At the same time, one-week price volatility has surged to its highest level in months. That spike matters.
Historically, volatility expansions like this tend to accompany forced liquidations, panic selling, or aggressive de-risking.
Structurally, BNB’s price had been printing higher lows through December and early January. However, that pattern has now failed.
The latest breakdown erased multiple weeks of gains in a short window, signaling that buyers stepped aside quickly once key support gave way.
Therefore, if selling pressure persists, elevated volatility can fuel further downside. As such, BNB’s price will likely slide toward $550 in the short term.
BNB Price Analysis
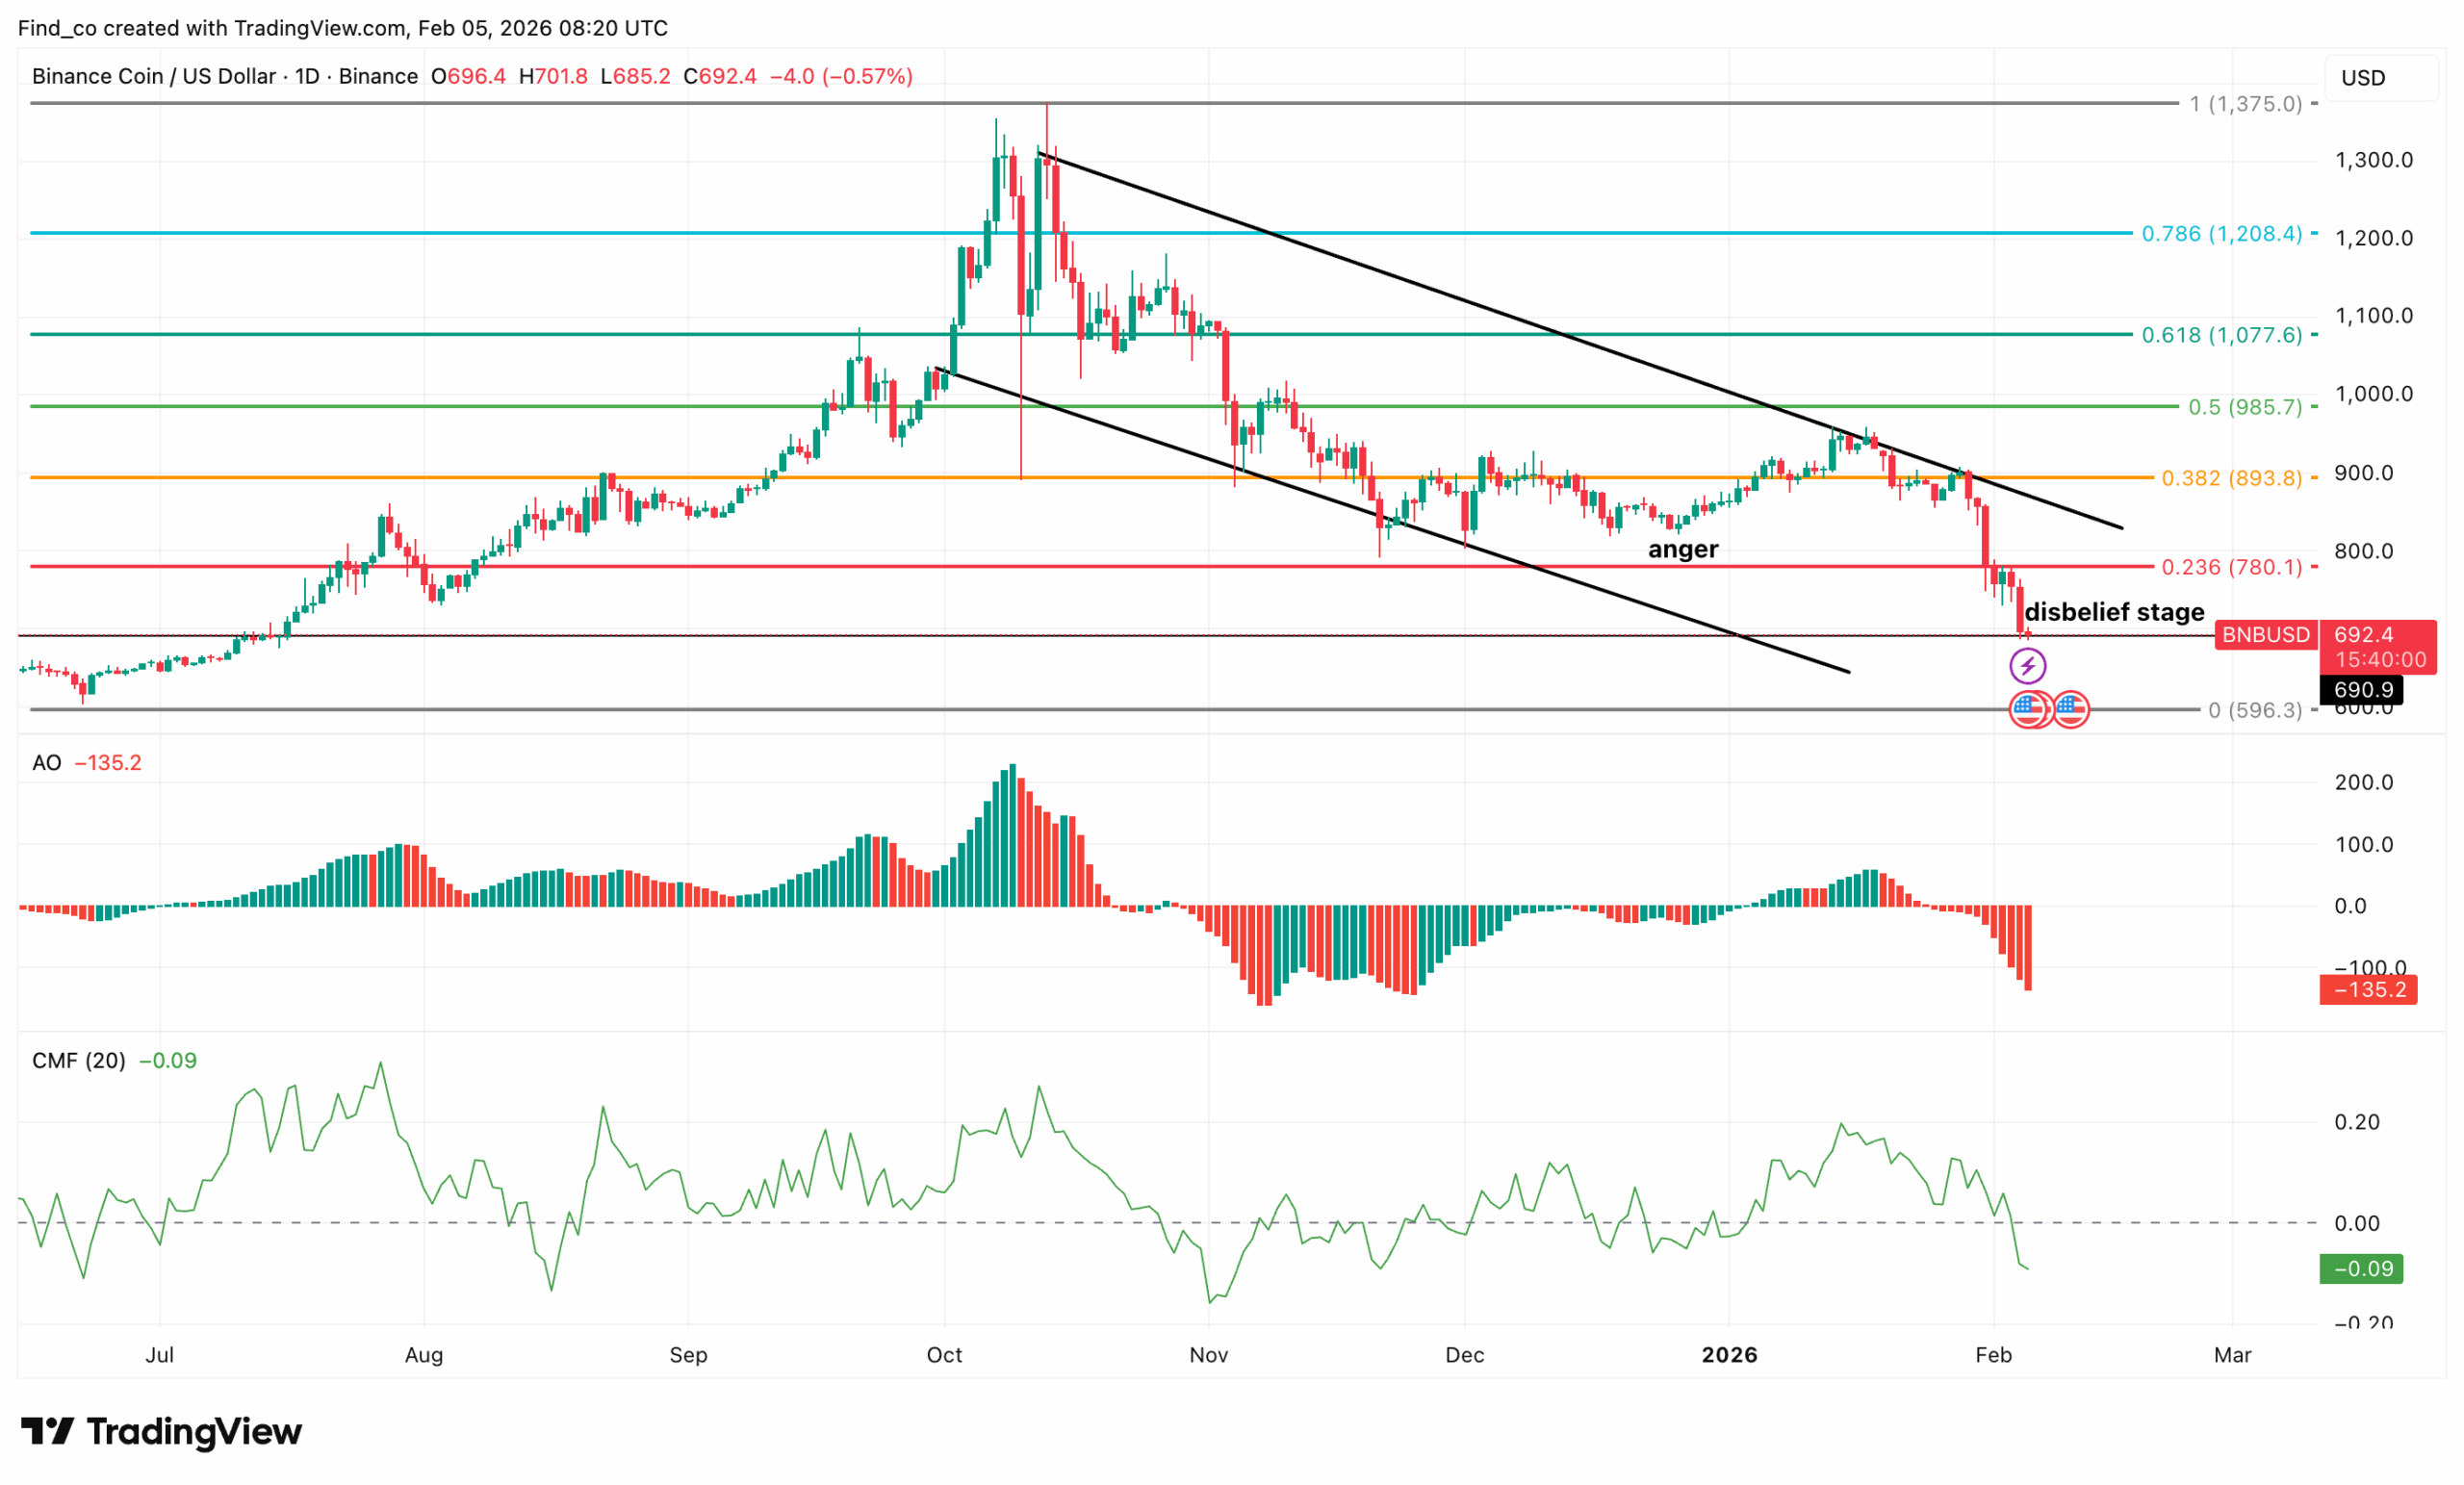
On the daily chart, BNB’s price continues to slide as bearish momentum tightens its grip.
As seen below, the altcoin has now fallen through the lower boundary of the descending channel, confirming a broader trend breakdown.
The rejection from the upper trendline earlier in January set the tone.
The failure to hold the 0.382 retracement near the $890 area shifted control firmly to sellers. Since then, the price has sliced through the 0.236 level around $780 and is now trading closer to the psychological $700 zone.
This move signals structural weakness, as prior demand zones have offered little resistance.
Momentum indicators reinforce the bearish picture. For instance, the Awesome Oscillator (AO) has flipped deeply negative, expanding to the downside and signaling accelerating bearish momentum.
At the same time, the Chaikin Money Flow has slipped below zero, pointing to sustained capital outflows rather than dip buying.
Sentiment also appears to be deteriorating. The chart’s “anger” and “disbelief” annotations align with late-stage correction behavior.
From here, the $690 region stands out as the next major support area, aligning with the lower macro range visible on the chart.
If this level fails to hold, downside risk could extend toward the $600 zone.
On the flip side, any meaningful recovery would first require reclaiming the broken $780 area, a move that currently looks unlikely without a broader market shift.
Disclaimer:
The information provided in this article is for informational purposes only. It is not intended to be, nor should it be construed as, financial advice. We do not make any warranties regarding the completeness, reliability, or accuracy of this information. All investments involve risk, and past performance does not guarantee future results. We recommend consulting a financial advisor before making any investment decisions.
Victor Olanrewaju is a crypto analyst and reporter at CCN with deep roots in on-chain research and technical analysis. His crypto journey began in 2017, but it was the 2020 Uniswap airdrop that sparked a full-time pivot into the space.
With a foundation in copywriting, Victor honed his craft creating high-converting content for leading crypto brokers — most notably an XRP price prediction that ranked #1 on Google during the 2021 bull run.
He later joined AMBCrypto in 2022, where he combined storytelling with technical and on-chain analysis to cover key market narratives.
In 2024, he expanded his expertise at BeInCrypto, collaborating with analysts and using tools like Glassnode, Santiment, and IntoTheBlock to break down Bitcoin and altcoin trends.
At CCN, Victor covers the top cryptocurrencies, memecoins, macro shifts, blending real-time insights with deep-dive metrics.
He holds a Bachelor’s degree in Physics from the University of Ibadan, equipping him to simplify complex data for a wide audience. Follow his work or connect on LinkedIn or X.