BNB rebound remains weak amid a broader bearish market structure.
A falling channel suggests an extended downside unless bulls step in.
ETF speculation offers hope, but there is no confirmed reversal of BNB.
The BNB price has staged a mild recovery after briefly hitting its lowest level since August 20, several days ago.
However, the broader technical outlook suggests the rebound may struggle to develop into a sustained rally.
Although buying pressure has increased slightly, indicators across multiple timeframes suggest weakening momentum.
Unless buyers overcome key resistance levels, BNB coin is unlikely to revisit the $1,000 zone in the near term. Here is why.
BNB On the Edge
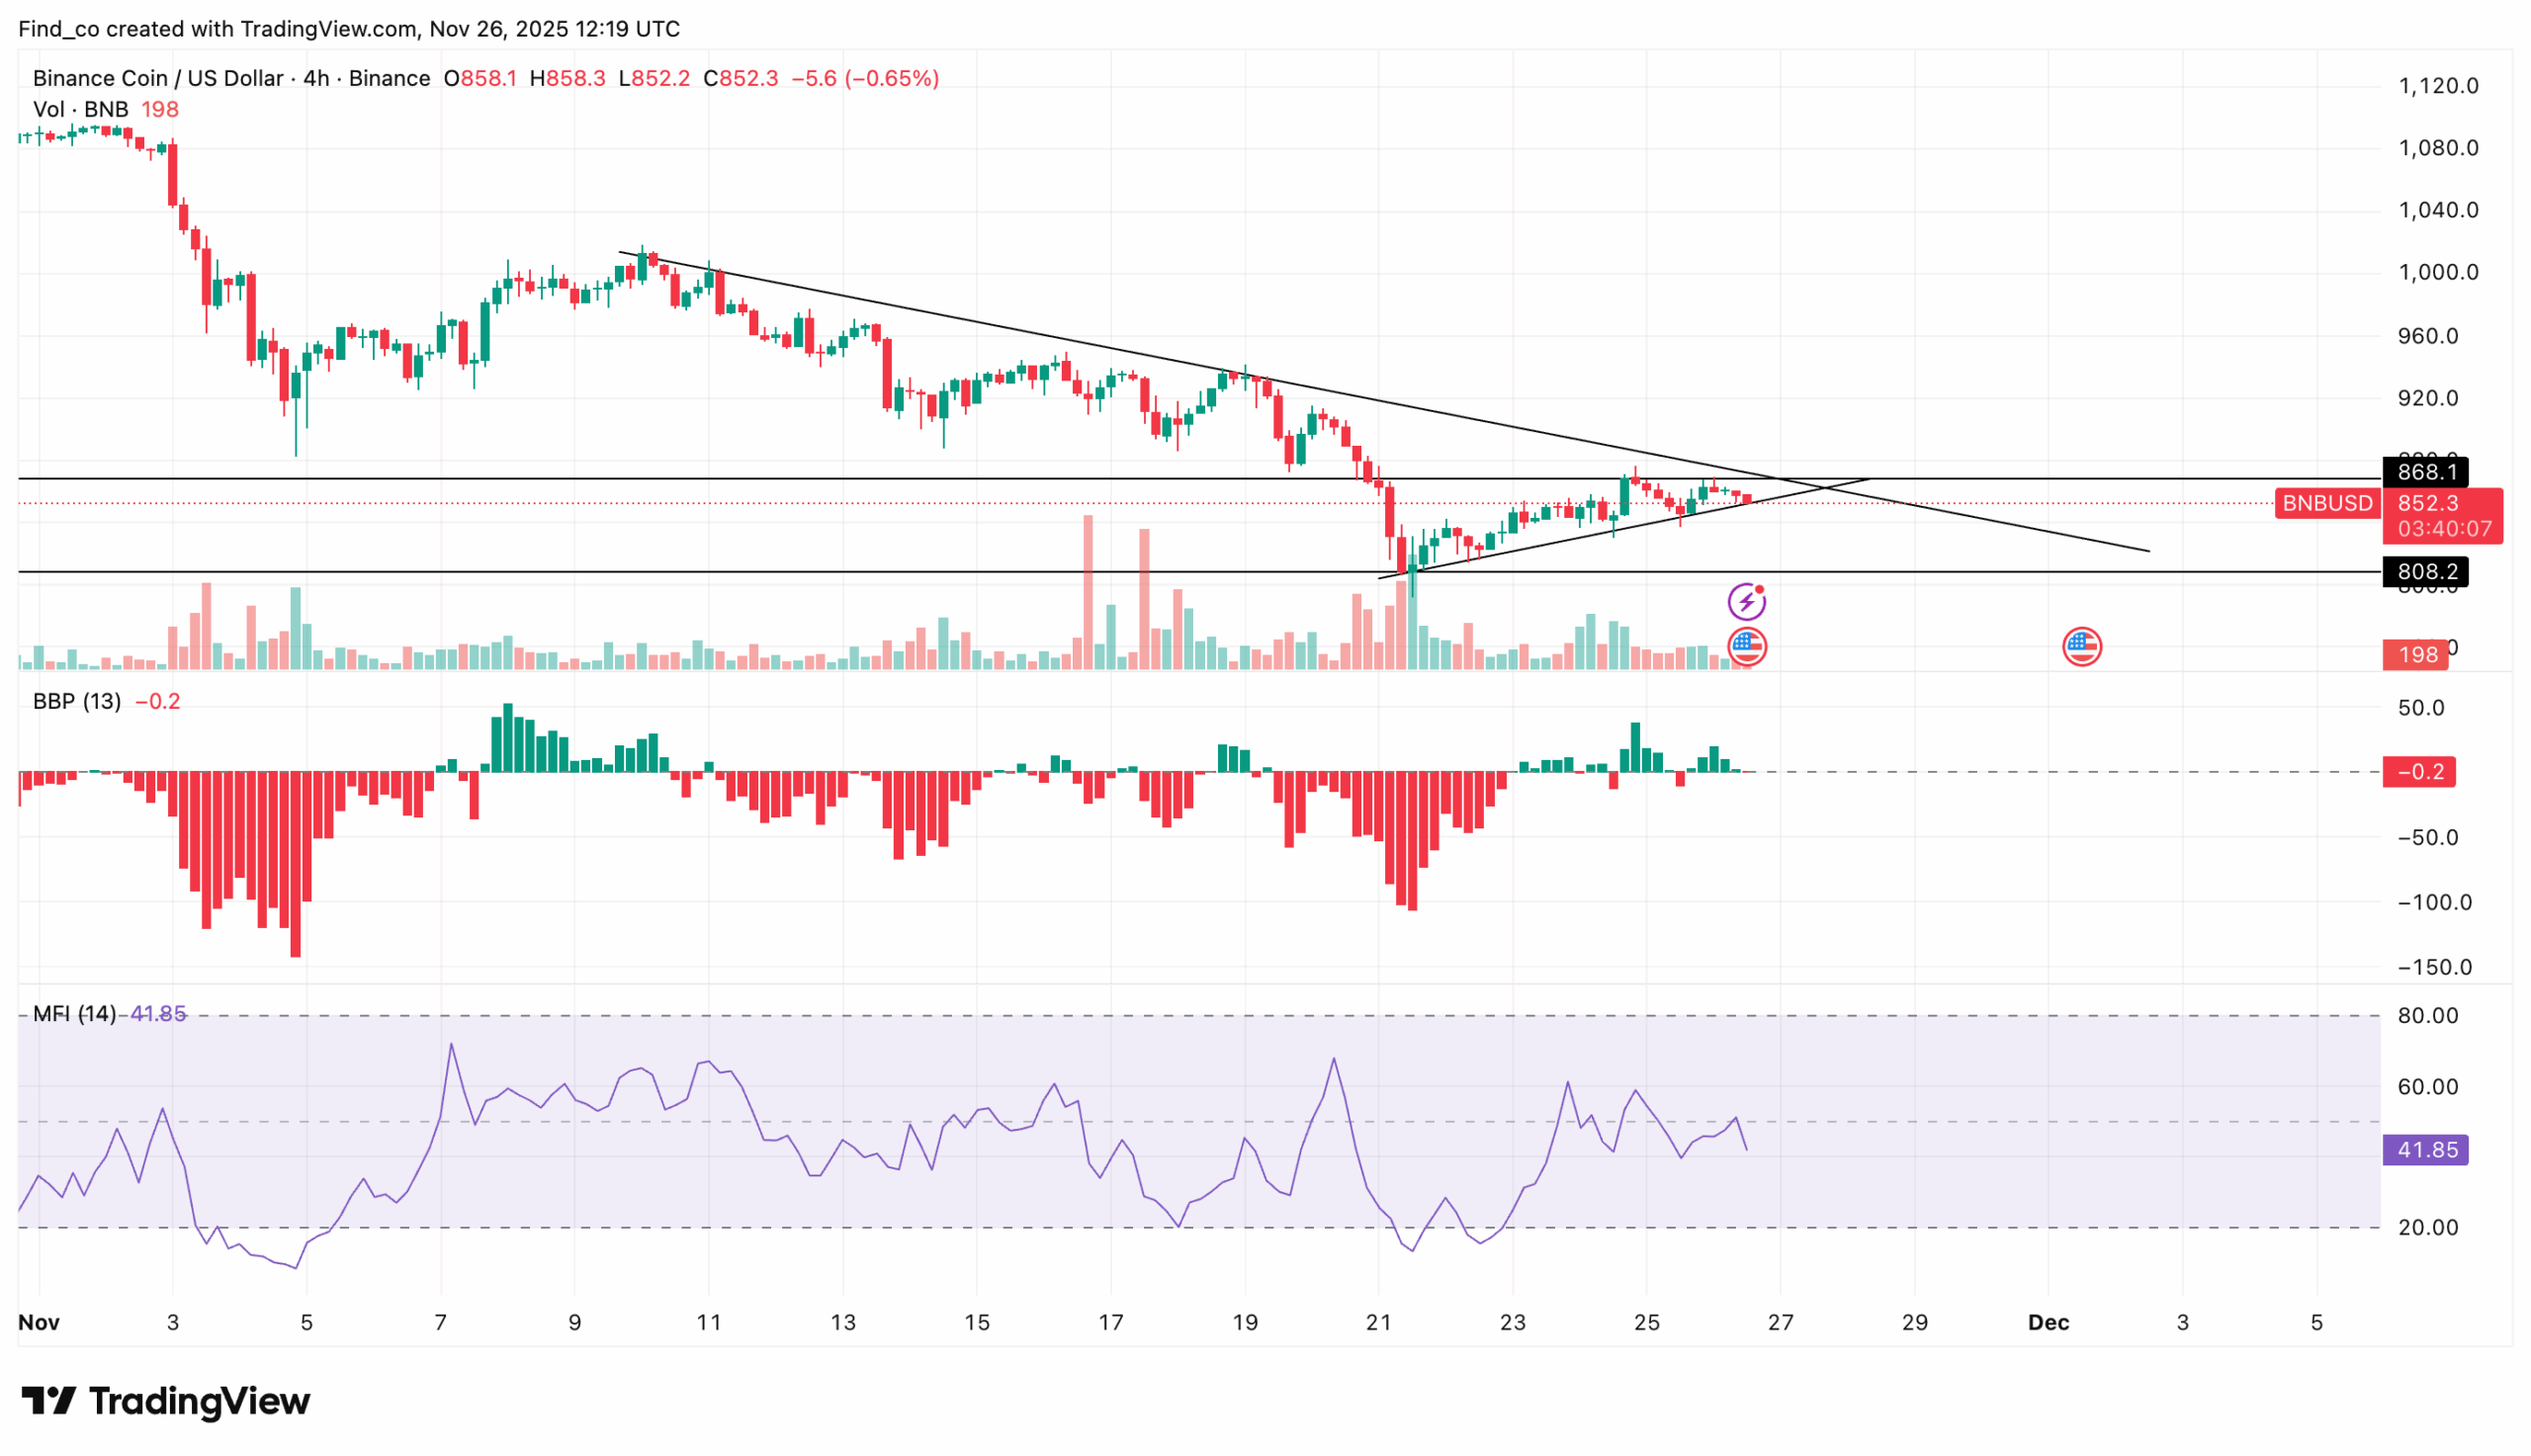
On the 4-hour chart, BNB’s Bull Bear Power (BBP) indicator reads 4.50, signaling that bulls are regaining some footing after the recent decline.
Despite that, the momentum remains fragile within the broader downtrend.
Get These Top Crypto Casino Offers Now!
Sponsored
Disclosure
We sometimes use affiliate links in our content, when clicking on those we might receive a commission at no extra cost to you. By using this website you agree to our terms and conditions and privacy policy.
On the daily chart, BNB’s price is trading in a falling channel at $856.96. The Chaikin Money Flow (CMF) remains in positive territory at 0.05.
While CMF is tilted downwards, it suggests that buying pressure still exists, albeit weakening.
The Awesome Oscillator (AO) shows a similar pattern, trending in negative territory but forming a single green histogram bar, which signals a minor attempt at bullish momentum.
This short-lived positive signal is not yet strong enough to counter the prevailing downtrend, indicating that any upside may be temporary unless further confirmation follows.
Using Fibonacci retracement levels, the BNB coin is moving toward the 0.236 Fib level at $783.89.
A sustained break below this level could confirm the start of strong bearish momentum, potentially driving prices toward $615.43.
Conversely, if BNB breaks above the 0.382 Fib level at $897.24, the next resistance lies at the 0.5 Fib level of $988.80
BNB ETF Likely to Reverse Trend
In the meantime, some analysts remain optimistic about BNB’s price recovery, especially with the potential launch of a spot BNB ETF.
“VanEck has officially filed for a spot BNB ETF. The firm applied for VBNB, a spot BNB exchange-traded fund that would list on Nasdaq and hold BNB directly, similar to the Bitcoin and Ethereum spot ETFs. This is a major signal for the market! Institutional interest in BNB is real and growing bullish.” ZYN, a crypto trader on X, said.
If approved, the spot BNB ETF could spark increased institutional adoption, boosting demand and potentially supporting a more substantial price rebound.
Disclaimer:
The information provided in this article is for informational purposes only. It is not intended to be, nor should it be construed as, financial advice. We do not make any warranties regarding the completeness, reliability, or accuracy of this information. All investments involve risk, and past performance does not guarantee future results. We recommend consulting a financial advisor before making any investment decisions.
Victor Olanrewaju is a crypto analyst and reporter at CCN with deep roots in on-chain research and technical analysis. His crypto journey began in 2017, but it was the 2020 Uniswap airdrop that sparked a full-time pivot into the space.
With a foundation in copywriting, Victor honed his craft creating high-converting content for leading crypto brokers — most notably an XRP price prediction that ranked #1 on Google during the 2021 bull run.
He later joined AMBCrypto in 2022, where he combined storytelling with technical and on-chain analysis to cover key market narratives.
In 2024, he expanded his expertise at BeInCrypto, collaborating with analysts and using tools like Glassnode, Santiment, and IntoTheBlock to break down Bitcoin and altcoin trends.
At CCN, Victor covers the top cryptocurrencies, memecoins, macro shifts, blending real-time insights with deep-dive metrics.
He holds a Bachelor’s degree in Physics from the University of Ibadan, equipping him to simplify complex data for a wide audience. Follow his work or connect on LinkedIn or X.