When Will the Bitcoin Cycle End? | Credit: Hameem Sarwar
Share
Key Takeaways
The Bitcoin Fear & Greed Index has reached fear.
Bitcoin’s price is below the short-term holder’s cost basis.
Has the Bitcoin price reached a bottom, or will it continue falling?
The Bitcoin Fear & Greed Index has again slipped into fear territory, raising questions about the market’s next move.
At the same time, Bitcoin’s price has dropped below the short-term holder cost basis, a level that has historically marked critical turning points.
With that in mind, let’s examine a few charts and determine where Bitcoin will go.
Bitcoin Fear and Greed Index
The Bitcoin Fear & Greed Index is an indicator that combines data from numerous sources to represent investor sentiment with a single number.
The index goes from 0 to 100, with 0 being extreme fear and 100 being extreme greed.
Historically, extreme greed has been associated with tops, especially if there was a bearish divergence between the price and the index.
Get These Top Crypto Casino Offers Now!
Sponsored
Disclosure
We sometimes use affiliate links in our content, when clicking on those we might receive a commission at no extra cost to you. By using this website you agree to our terms and conditions and privacy policy.
The other two dips were in August 2024 and March 2025, when the index dropped to extreme fear before a reversal.
The current decline is so far more like the one in September 2023. The Bitcoin fear and greed index has briefly fallen below 50.
It remains to be seen if it will fall to extreme greed before a Bitcoin trend reversal.
Bitcoin On-Chain Cost Basis
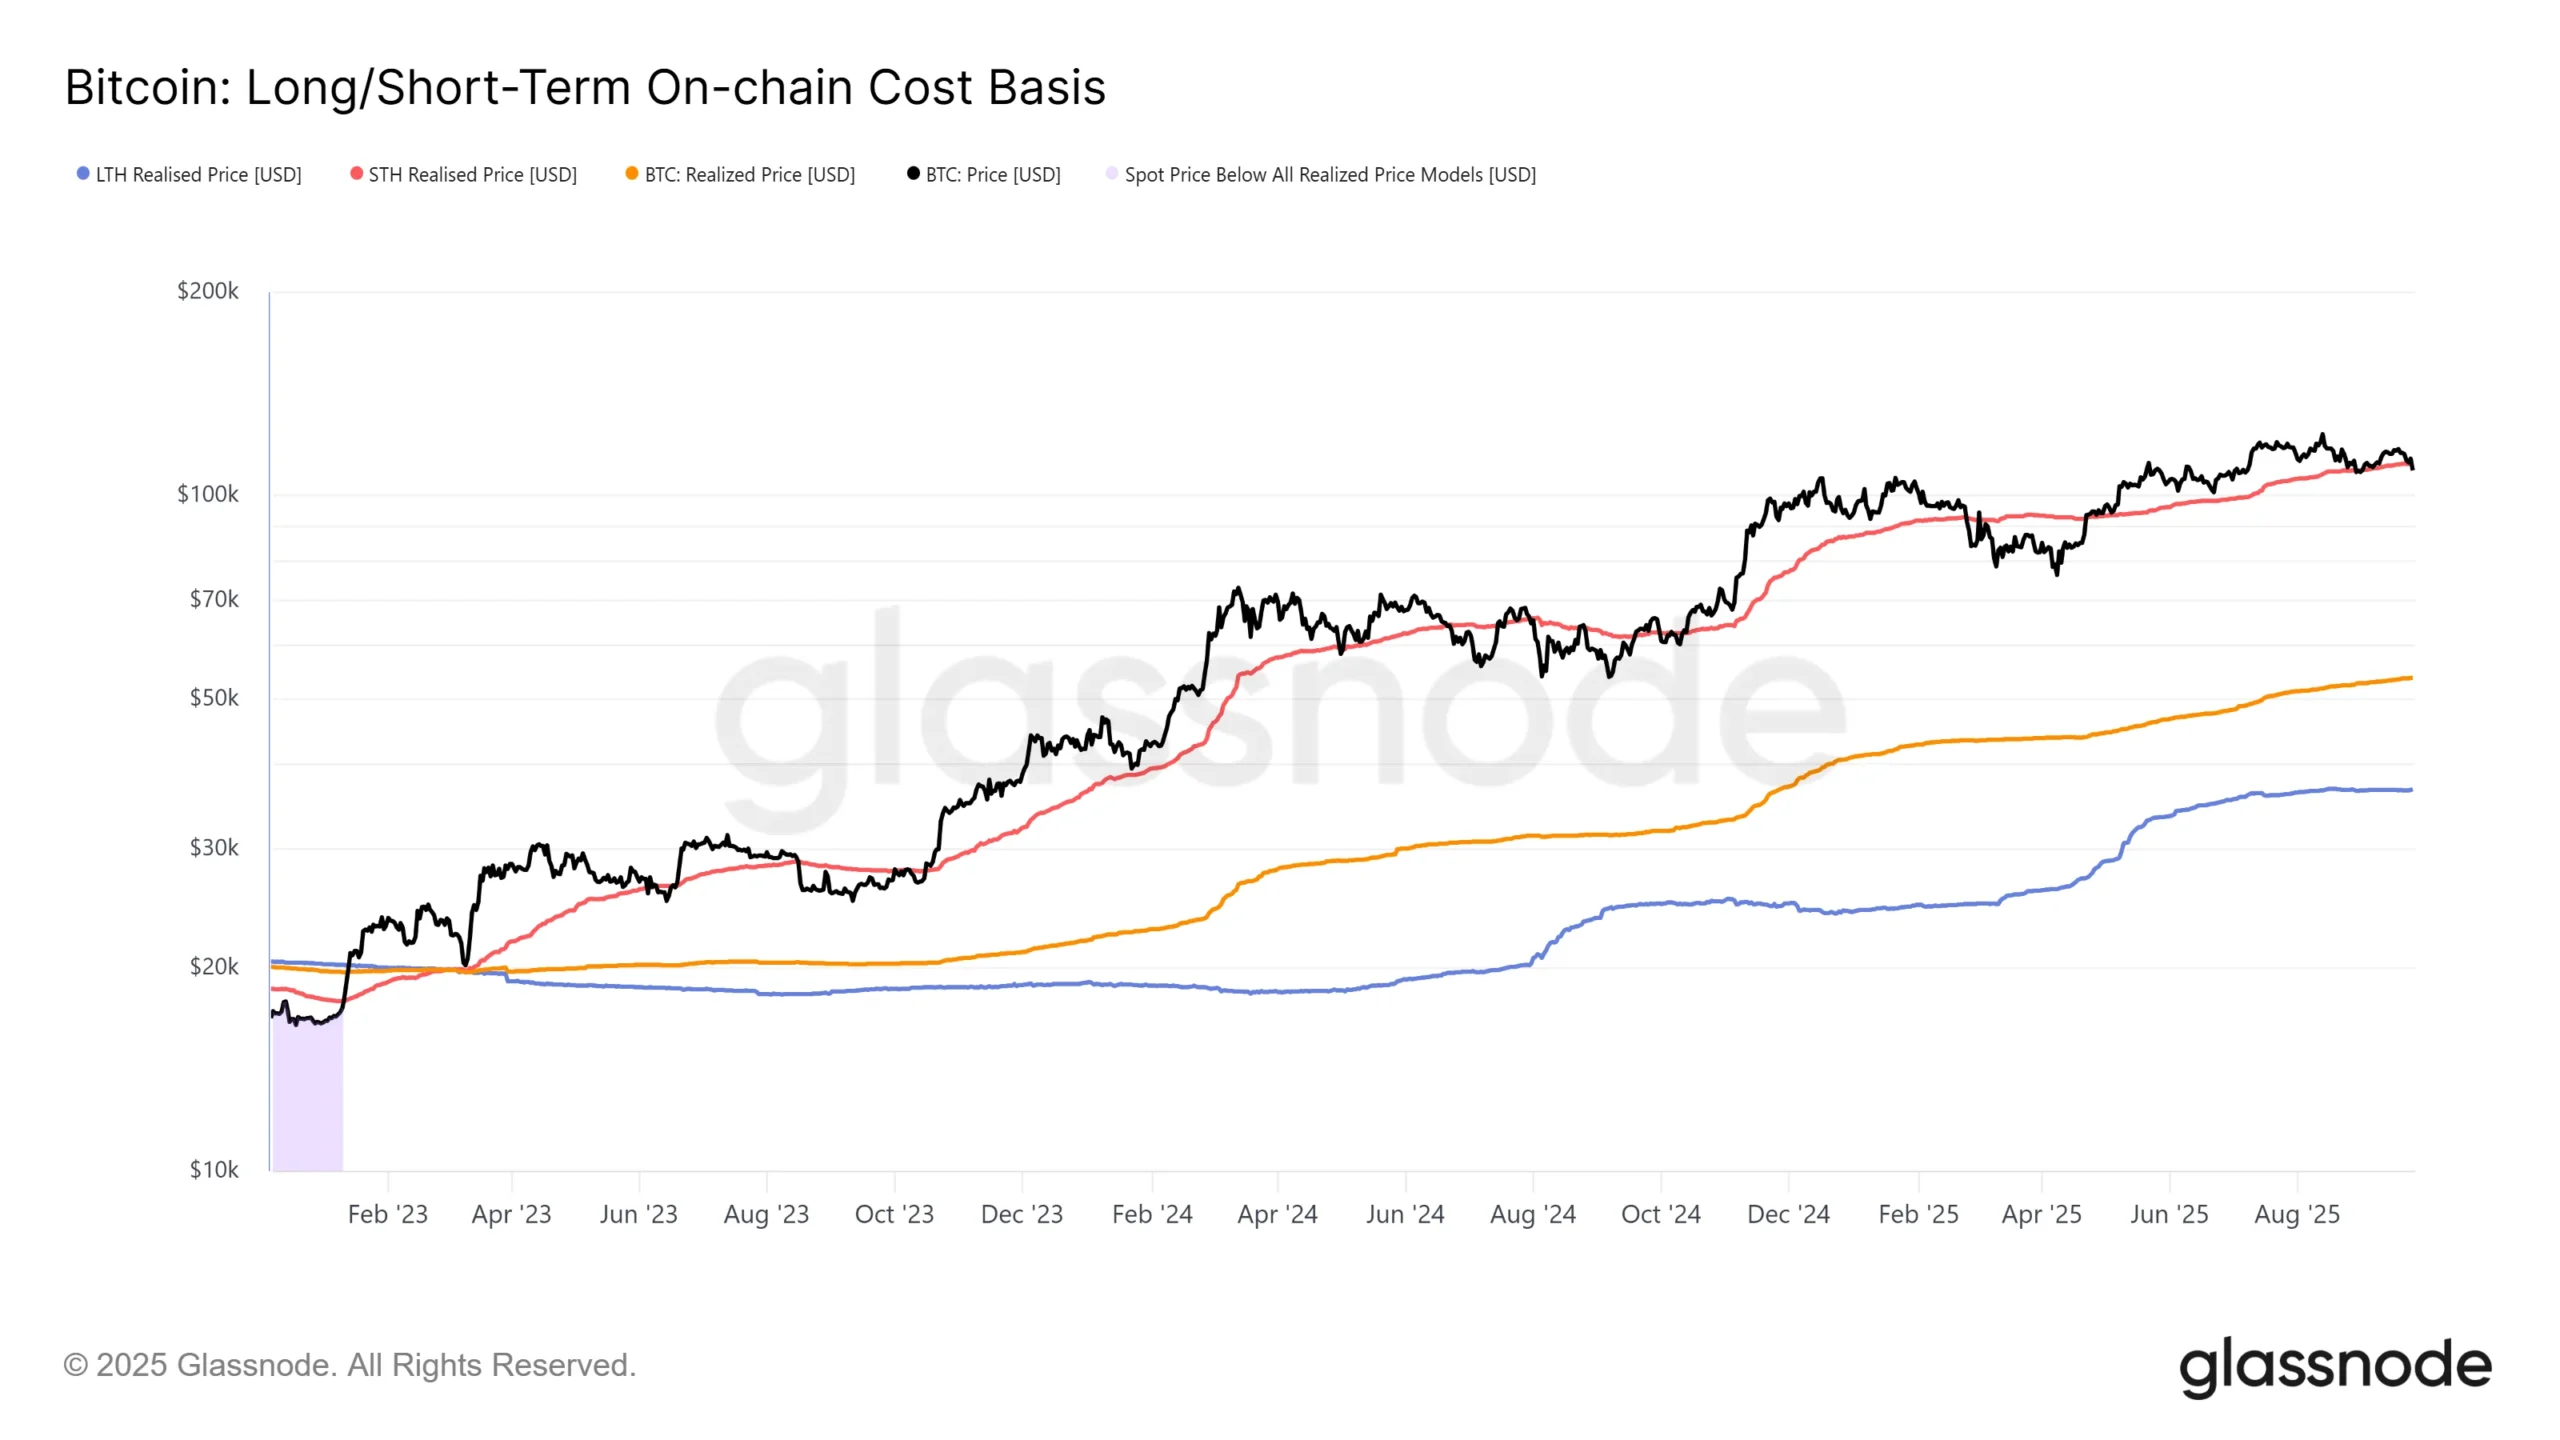
Another on-chain indicator used to determine when the price will reverse is the Long-Short-Term-Holder on-chain cost basis.
The indicator uses the Long- and Short-term holder realized price, and compares it to the actual and realized Bitcoin price.
Historically, the short-term holder’s realized price has always been above the realized BTC price, but the long-term holder’s realized price has been below it.
Bitcoin LTH and STH Cost Basis | Credit: Glassnode
During the current bull run, the Bitcoin price has fallen three times below the STH realized price, but always reclaimed it and moved to new highs.
The price stayed below it for several weeks at most before reclaiming it.
Based on this indicator, the Bitcoin price will likely fall below the STH realized price. This would also cause the Bitcoin fear and greed index to reach extreme fear.
Afterward, another upward movement is likely.
Final Thoughts
History shows that moments of extreme fear often set the stage for substantial recoveries, but they can also precede deeper corrections.
If Bitcoin falls below the short-term holder realized price, investor sentiment could worsen before a potential reversal.
All eyes remain on the Fear & Greed Index to see if the fear will lead to a reversal.
Disclaimer:
The information provided in this article is for informational purposes only. It is not intended to be, nor should it be construed as, financial advice. We do not make any warranties regarding the completeness, reliability, or accuracy of this information. All investments involve risk, and past performance does not guarantee future results. We recommend consulting a financial advisor before making any investment decisions.
Valdrin Tahiri is a cryptocurrency analyst and reporter at CCN, specializing in technical analysis with a focus on Elliott Wave theory, on-chain metrics, and fundamental research. He brings over seven years of experience in the crypto space as both a trader and writer.
He discovered cryptocurrencies in 2017 while earning his MSc in Financial Markets at the Barcelona School of Economics, which sparked a deep interest in blockchain and market dynamics. Since then, he’s contributed to top crypto outlets like BeInCrypto and CoinGape.
Valdrin also served as Community Manager of BeInCrypto’s Telegram group for three years, helping grow it into one of the largest crypto communities worldwide. His expertise in market structure and price patterns allows him to break down complex trends into clear, actionable insights.
He’s published thousands of articles covering altcoins, Bitcoin cycles, and macro trends.