When Will the Bitcoin Decline End? | Credit: Derek Fenech
Share
Key Takeaways
Bitcoin (BTC) failed to move above the $117,000 horizontal resistance area.
The BTC price broke down from an ascending parallel channel pattern.
How much further will the Bitcoin price continue to decrease?
Bitcoin (BTC) has been sliding since Sept. 18, with a flash crash briefly sending it below $112,000 on Monday.
While the price has since recovered slightly, the drop casts doubt on the strength of the rally that started on Sept. 1.
Bitcoin’s price is breaking down again today, threatening to retrace all of its previous gains.
Let’s take a closer look at the charts to see what might come next.
Bitcoin’s September Crash
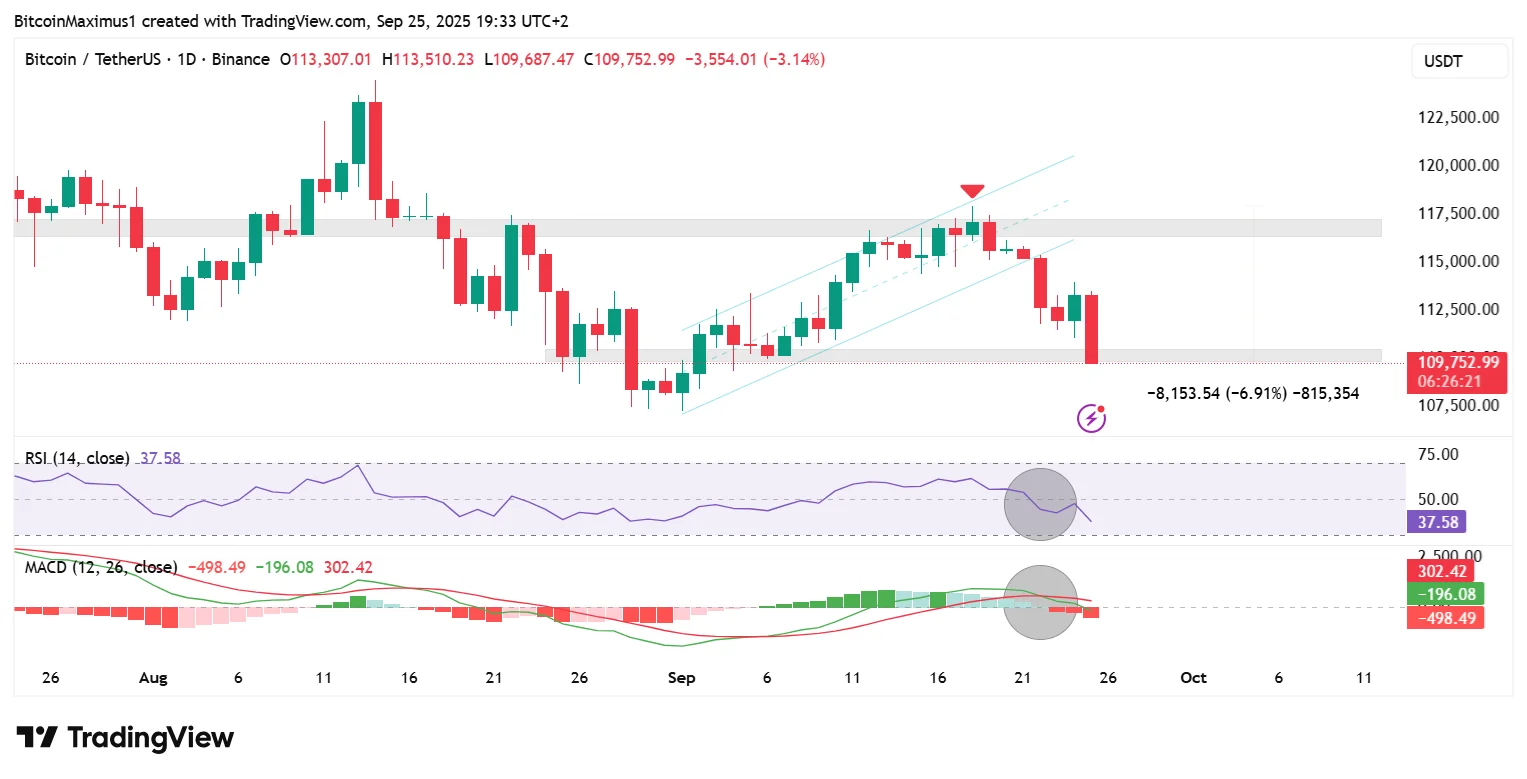
Bitcoin’s daily time frame chart shows that the price has fallen by more than 5% since its $117,900 high on Sept. 18 (red icon).
The level at which the decline started is important since Bitcoin was rejected at a confluence of resistances between $117,000 and $118,000.
Get These Top Crypto Casino Offers Now!
Sponsored
Disclosure
We sometimes use affiliate links in our content, when clicking on those we might receive a commission at no extra cost to you. By using this website you agree to our terms and conditions and privacy policy.
Bitcoin’s failure to break out is an ominous sign, since it suggests that the BTC price could be in a corrective upward movement, instead of an impulsive one.
The fact that Bitcoin has traded inside an ascending parallel channel since the Sept. 1 lows further reinforces this belief, since channels usually contain corrective movements.
While the Bitcoin price bounced at the $112,000 horizontal support area yesterday (green icon), it risks breaking down below it again.
Momentum indicators also give worrying signs. The Relative Strength Index (RSI) fell below 50 (black circle), and the Moving Average Convergence/Divergence (MACD) made a bearish cross.
The daily time frame leans slightly bearish, but the fact that Bitcoin trades at support could lead to a bounce.
Why is Bitcoin Crashing?
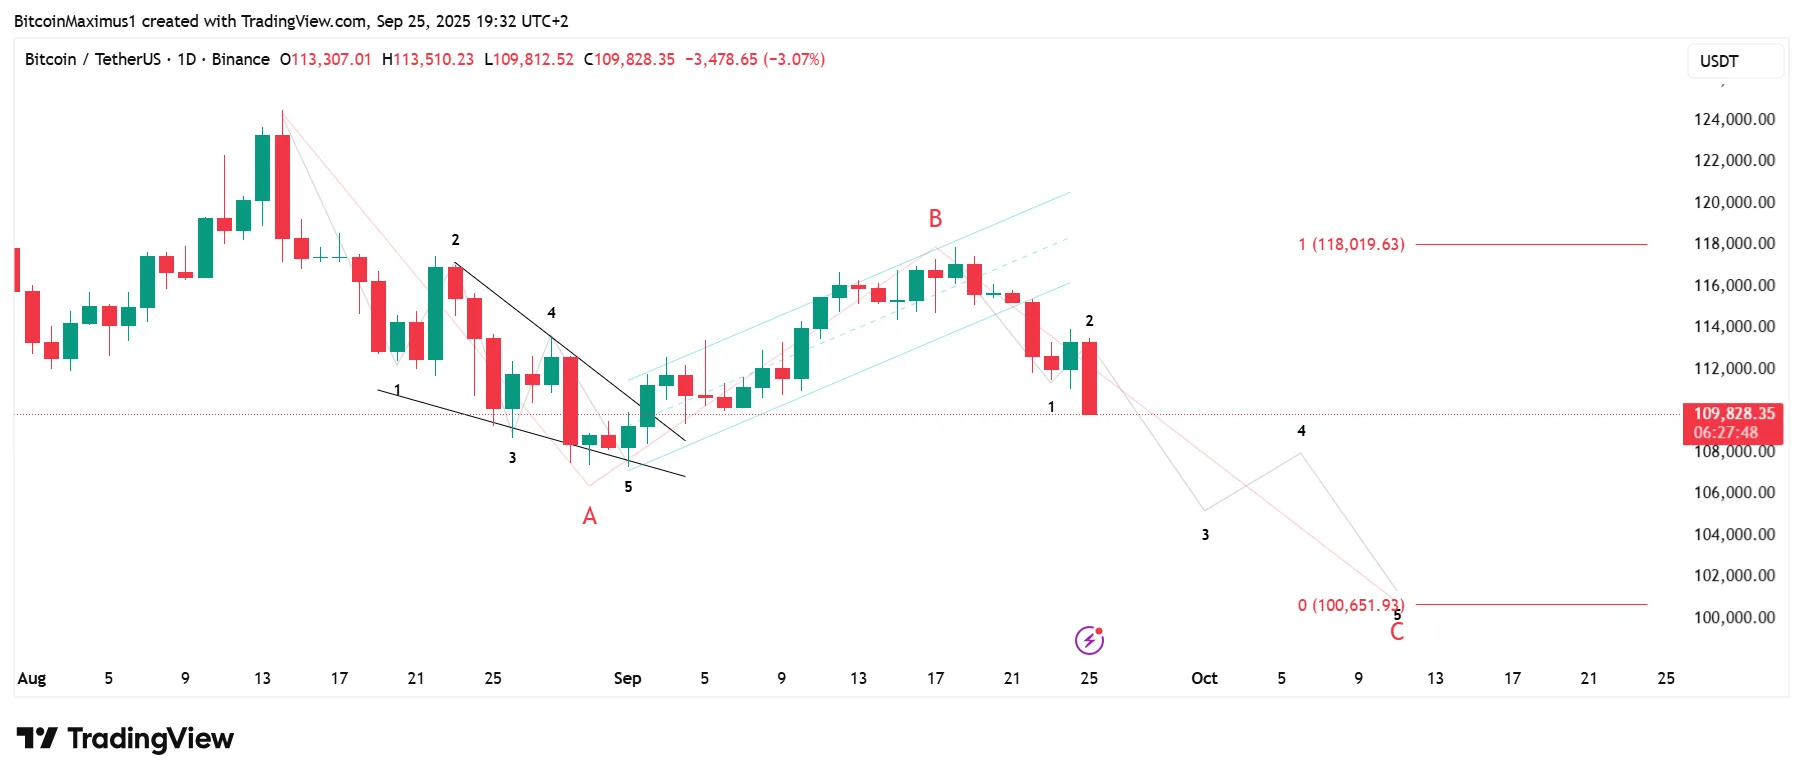
The Bitcoin price can take two potential paths for the rest of September: one bearish and one bullish.
The bearish one suggests the Bitcoin crash will continue the rest of September. According to the count, the parallel channel contained wave B in an A-B-C correction (red).
If the count is accurate, Bitcoin is now correcting in wave C, which could take it down to $100,600, a target found by giving waves A and C the same length.
The sub-wave counts for wave A and C are in black.
While the bearish count is primary, not all hope is lost, since a bullish count still remains valid.
The bullish count suggests that Bitcoin completed a five-wave upward movement (green) since Sept. 1, and is now finishing an A-B-C correction.
While the count remains valid, the Bitcoin price has to hold above the horizontal and Fibonacci support level at $112,650 to increase its likelihood of transpiring.
So, for this to become the primary count, the BTC price will have to bounce once it reaches the 0.786 Fibonacci retracement support level at $109,600.
While the price may fall to $109,600 before bouncing, creating a deeper retracement, the more the BTC price remains below $114,000, the less likely this count becomes.
In conclusion:
Bearish count: BTC could drop to $100,600 if wave C plays out.
Bullish count: BTC must hold the $109,600 support to confirm a rebound.
Breakdown or Bounce?
Bitcoin’s rejection at the $117,000 resistance and breakdown from the ascending channel put pressure on the bulls.
Momentum indicators now lean bearish, but the price is close to a critical support level that, if held, could trigger a bounce.
The next few days will determine whether BTC continues toward $100,000 or if it begins a recovery.
Disclaimer:
The information provided in this article is for informational purposes only. It is not intended to be, nor should it be construed as, financial advice. We do not make any warranties regarding the completeness, reliability, or accuracy of this information. All investments involve risk, and past performance does not guarantee future results. We recommend consulting a financial advisor before making any investment decisions.
Valdrin Tahiri is a cryptocurrency analyst and reporter at CCN, specializing in technical analysis with a focus on Elliott Wave theory, on-chain metrics, and fundamental research. He brings over seven years of experience in the crypto space as both a trader and writer.
He discovered cryptocurrencies in 2017 while earning his MSc in Financial Markets at the Barcelona School of Economics, which sparked a deep interest in blockchain and market dynamics. Since then, he’s contributed to top crypto outlets like BeInCrypto and CoinGape.
Valdrin also served as Community Manager of BeInCrypto’s Telegram group for three years, helping grow it into one of the largest crypto communities worldwide. His expertise in market structure and price patterns allows him to break down complex trends into clear, actionable insights.
He’s published thousands of articles covering altcoins, Bitcoin cycles, and macro trends.