Key Takeaways
- The OKB price has fallen since its all-time high of $258.60.
- OKB trades inside a short-term symmetrical triangle.
- Can OKB break out and move to a new all-time high price?
The OKB token’s price swing in August was wild, increasing by more than 300% to an all-time high of $258.60.
Despite a sharp pullback since, the price trades in a continuation pattern that could lead to another breakout.
Let’s examine the charts and see how likely another breakout is.
OKB Falls After High
The weekly time frame chart shows that OKB broke out from a symmetrical triangle in August and closed above the $62 horizontal resistance area.
OKB’s rally was catalyzed by an announced 65 million token burn, which led to a new all-time high price of $258.60 next week.
However, that has been the top since the OKB price has fallen by nearly 30% since the high and currently trades below $190.
Because the breakout led to a parabolic rally, there is no clear support below the current price, meaning that a sharp downtrend could follow if the trend reverses.
The closest horizontal resistance area is the previous resistance at $62, which is a drop of nearly 70% from the current price.
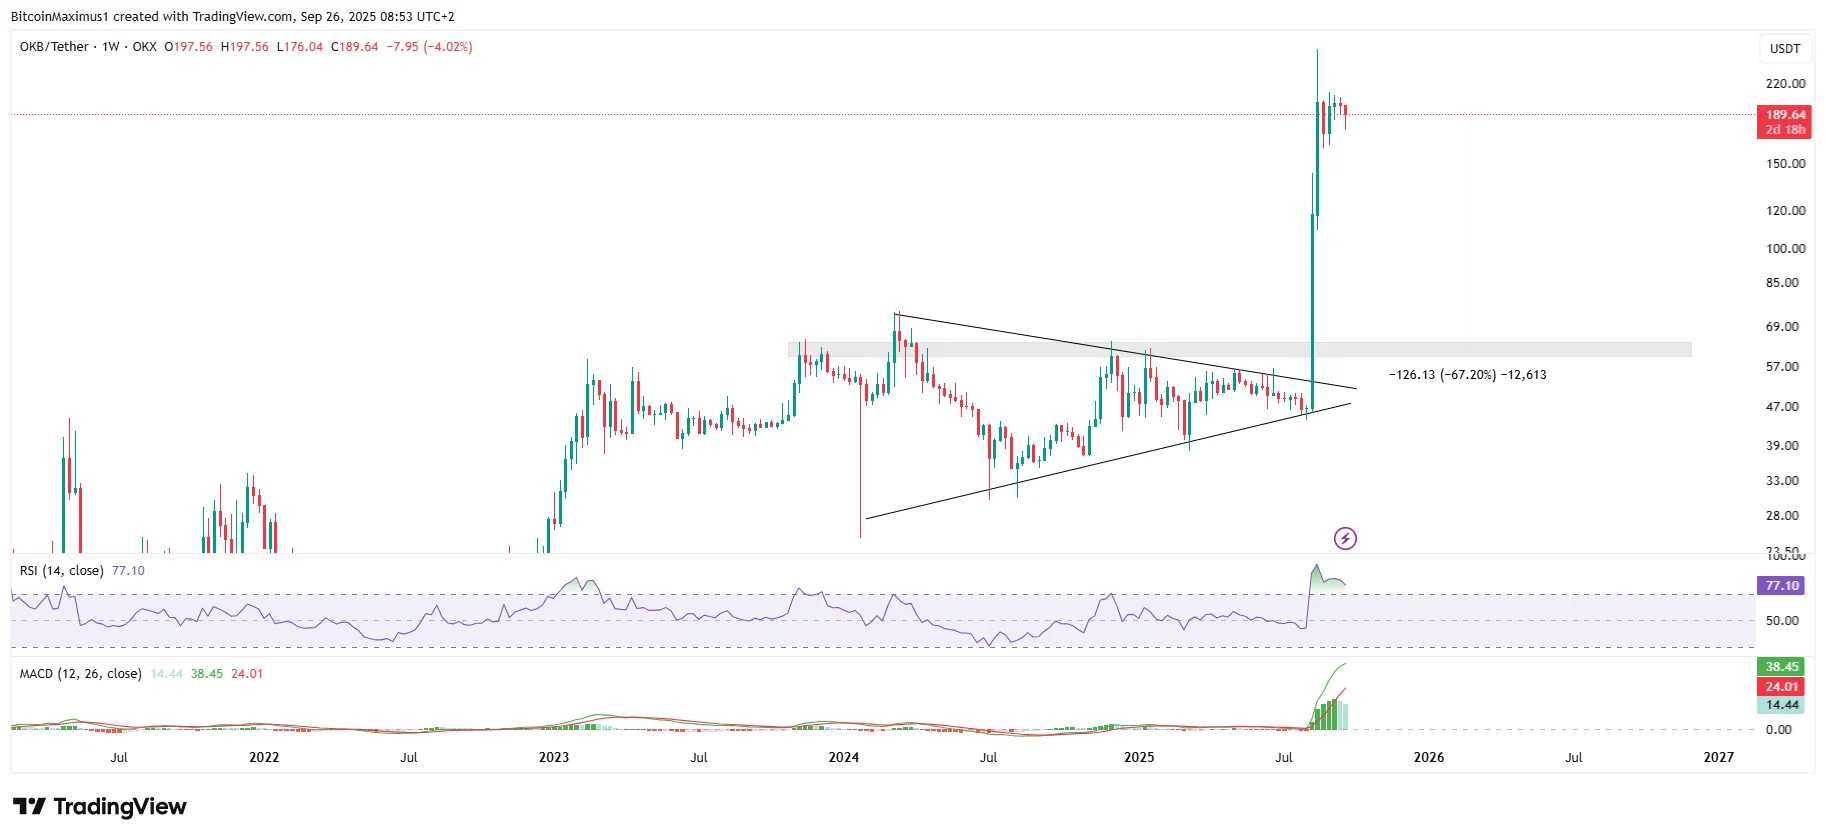
- OKB/USDT Weekly Chart | Credit: Valdrin Tahiri/TradingView
Momentum indicators lean slightly bearish. While the Relative Strength Index (RSI) and Moving Average Convergence/Divergence (MACD) are positive, they are both falling.
However, neither has generated any bearish divergence.
So, the weekly time frame analysis is inconclusive on whether the OKB prediction is bullish or bearish.
What’s Next for OKB?
The daily time frame chart shows that OKB has traded inside a symmetrical triangle since the all-time high, and is approaching its endpoint.
While the triangle is considered a neutral pattern, it often acts as a continuation. Since it transpires after an upward movement, it will likely lead to a breakout.
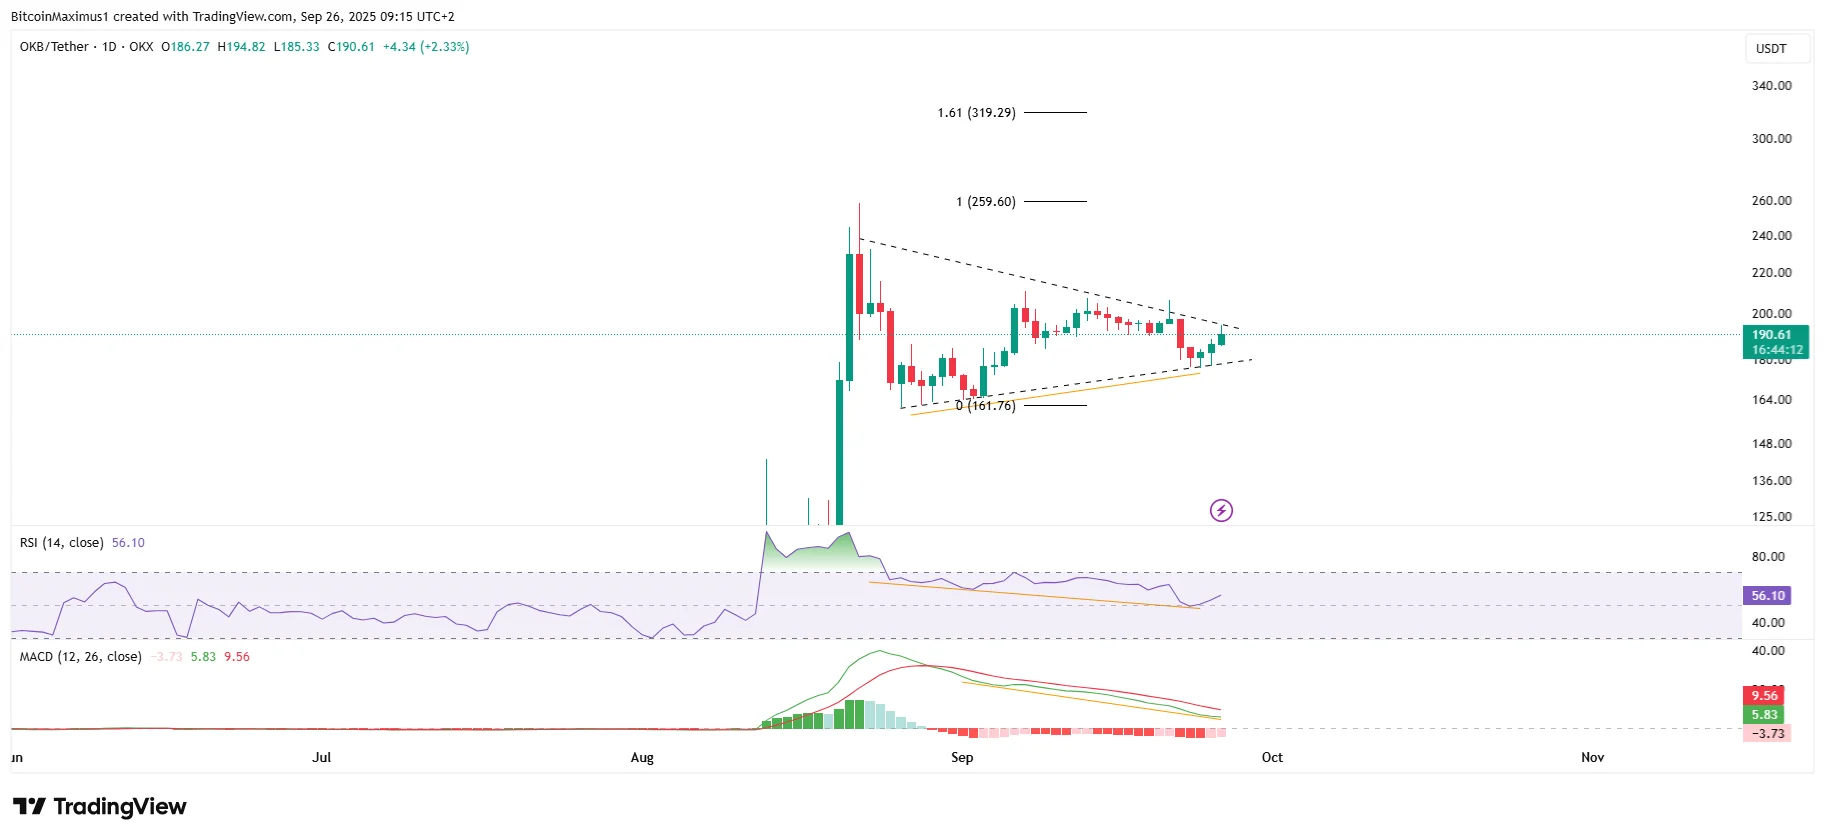
- OKB/USDT Daily Chart | Credit: Valdrin Tahiri/TradingView
Additionally, the RSI and MACD have created hidden bullish divergences (orange), often leading to trend continuation.
Combined with the triangle pattern, they make a much more likely OKB price breakout.
If one occurs, the price could hit a new all-time high of $319, reaching the 1.61 external Fibonacci retracement resistance level of the most recent drop.
OKB Breakout Incoming
OKB’s symmetrical triangle pattern is ending, and a hidden divergence points to continuation.
If the price breaks out, it could reach a new all-time high near $319.
Alternatively, a breakdown from the triangle could cause the price to plunge because of the lack of support below it.
The information provided in this article is for informational purposes only. It is not intended to be, nor should it be construed as, financial advice. We do not make any warranties regarding the completeness, reliability, or accuracy of this information. All investments involve risk, and past performance does not guarantee future results. We recommend consulting a financial advisor before making any investment decisions.

Valdrin Tahiri is a cryptocurrency analyst and reporter at CCN, specializing in technical analysis with a focus on Elliott Wave theory, on-chain metrics, and fundamental research. He brings over seven years of experience in the crypto space as both a trader and writer.
He discovered cryptocurrencies in 2017 while earning his MSc in Financial Markets at the Barcelona School of Economics, which sparked a deep interest in blockchain and market dynamics. Since then, he’s contributed to top crypto outlets like BeInCrypto and CoinGape.
Valdrin also served as Community Manager of BeInCrypto’s Telegram group for three years, helping grow it into one of the largest crypto communities worldwide. His expertise in market structure and price patterns allows him to break down complex trends into clear, actionable insights.
He’s published thousands of articles covering altcoins, Bitcoin cycles, and macro trends.