Home / Analysis / Crypto / Technical Analysis / Bitcoin (BTC) Price Reclaims $70K, Thanks to Whales, but These Signals Reveal the Bear Market Isn’t Over
Bitcoin’s rebound is real, but the bear market isn’t over | Credit: Hameem Sarwar
Share
Key Takeaways
Bitcoin’s rebound above $70,000 happened due to a flush and mid-tier whale accumulation.
Data shows top buyers remain underwater, meaning rallies are likely to face resistance.
Technically, Bitcoin’s price is still transitioning to a bear market, with $75,000 the key level.
Bitcoin’s (BTC) price has clawed back above $70,000. This happened as it ripped more than 9% off the weekend’s capitulation low near $60,500.
The bounce is real, and the relief is obvious. However, it does not seem that the cryptocurrency is saved from the bear market yet.
It’s simply back in the arena, where whales and macro are still pulling in opposite directions. So, what’s next for Bitcoin’s price?
Bitcoin Whales Drive Rebound
The $60,000 flash Bottom wasn’t a gentle dip. From our findings, it seemed like a forced reset.
Over the Feb. 7 to 8 period, BTC briefly knifed below its 200-week moving average, triggering over $2 billion in long liquidations and flushing leverage that had been keeping the downside unstable.
That purge is part of why the rebound had room to breathe.
What’s more telling is who stepped in. On-chain data suggests mid-tier whales (1,000–10,000 BTC) were the ones building buy walls in the $60,000-$65,000 zone, absorbing panic supply and giving the price something solid to bounce from.
That accumulation appears to have offset continued distribution pressure from larger holders and miners, which is why this move feels like a tug-of-war.
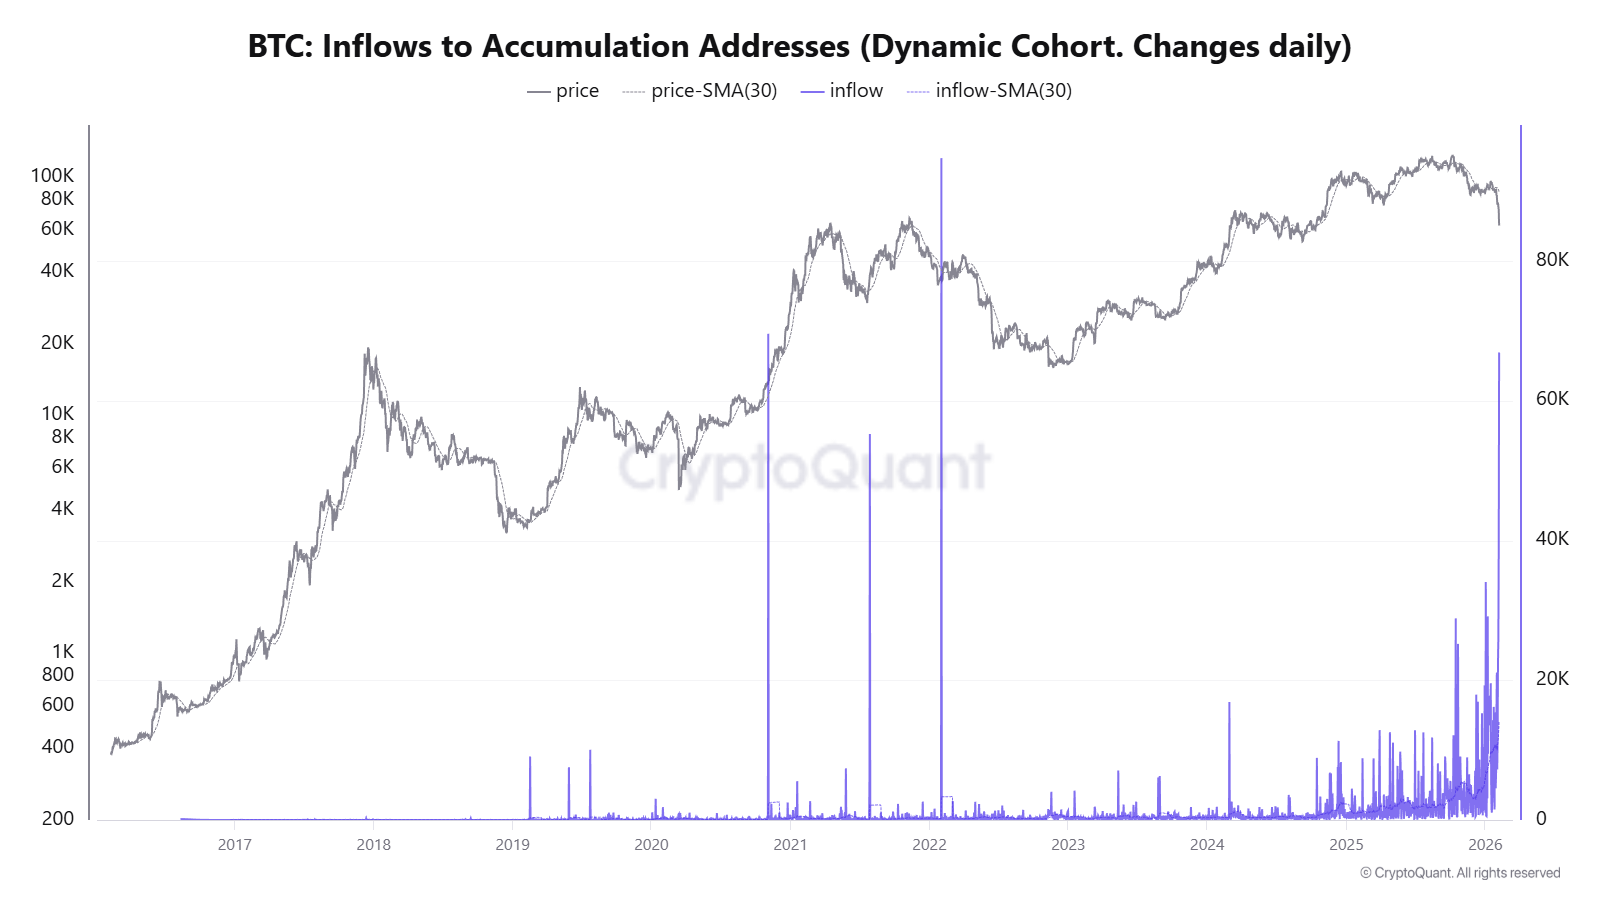
Furthermore, data from CryptQuant shows a surge in Bitcoin inflows to accumulation addresses.
Even as Bitcoin’s price has pulled back from recent highs, long-term holders and whales are aggressively absorbing supply, suggesting selling pressure is being met by strong demand.
Compared to prior cycles, the scale of recent inflows is notable and aligns more with late-bear or early re-accumulation behavior.
If this trend persists, it increases the probability that the current weakness is a structural reset rather than the start of a prolonged bear market.
However, it seems too early to conclude, as other metrics also matter.
Too Many Hurdles Still
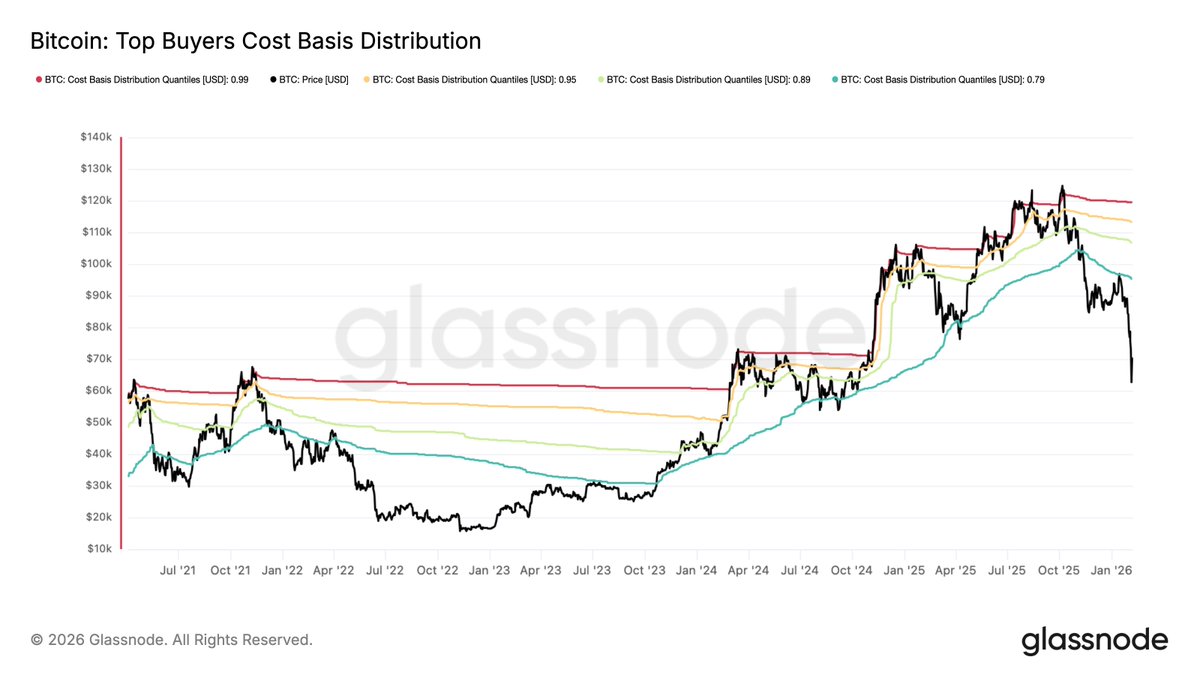
Notably, since the October all-time high, data from Glassnode shows that Bitcoin has repeatedly failed to reclaim and hold above the cost-basis bands of the “top buyers”.
Here, this cohort represents the top 1%, 5%, 10%, and 20% of supply. When BTC price trades below these cohorts’ cost basis, it usually means the most aggressive late-cycle buyers are underwater.
In this case, rallies into those bands tend to get sold because they become “get-out-even” levels.
At $60,000, the price, roughly 37% below the top 20% cost basis ($95,000), is a big psychological deal.
This setup is comparable to May 2022, when the crypto market was trapped under key cohort cost bases.
In bear markets, sustained trading below major cost-basis bands tends to signal that the market is still in a capitulation.
Therefore, as long as BTC remains below the top-buyer cost basis cluster, the path of least resistance is usually sideways-to-down with violent squeezes.
BTC Top Buyers On-Chain Cost Distribution | Credit: Glassnode
“The Realized Profit-to-Loss Ratio (90D-SMA) has been trending lower since late July. It has now fallen to ~1.45, marking a sharp deterioration in market profitability, though still above <1 levels historically associated with extreme capitulation,” Glassnode posted in support of the current bear phase.
Like the on-chain analytic platform, Julio Moreno, Head of Research at CryptoQuant, added that this could be one of the worst bear markets.
To support his opinion, Moreno analyzed the 365-day moving average downside cross. At the time of writing, this metric is deep in negative territory, signaling a bear market.
“Bitcoin, current bear market performance is among the worst in the comparable periods, -30%,” He highlighted.
BTC Price Prediction: Problem Lingers
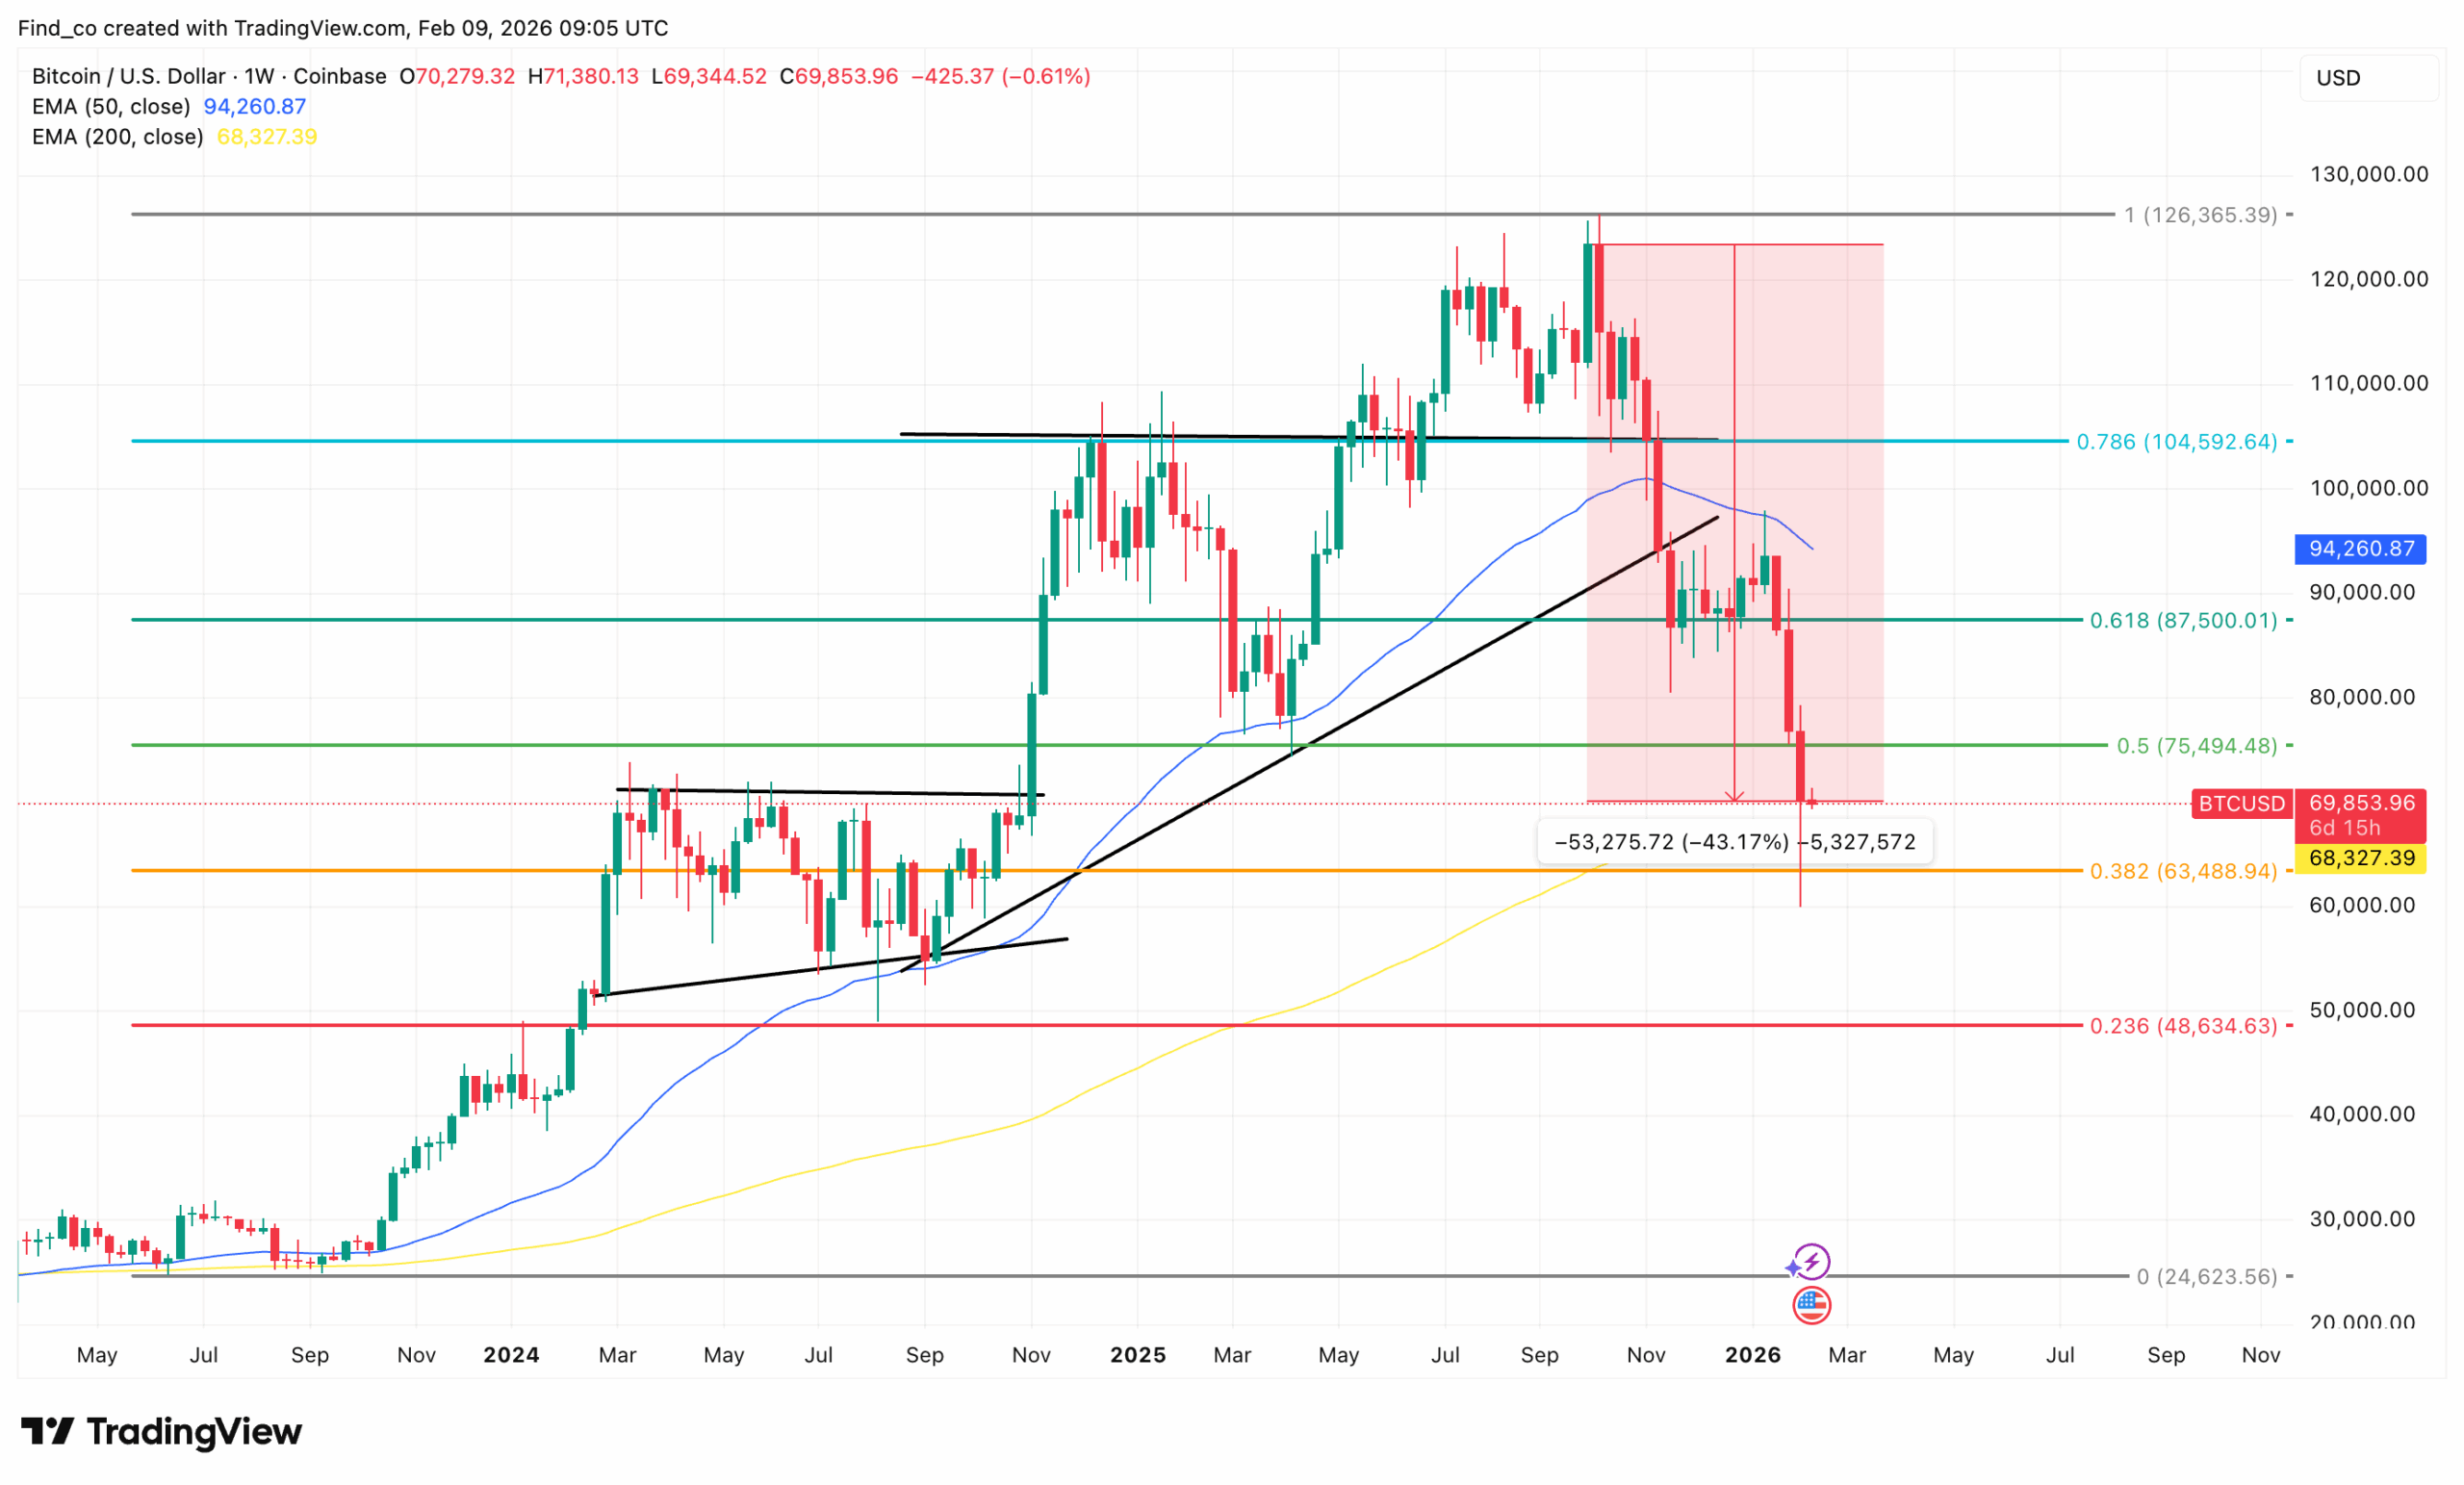
Technically, the weekly BTC chart reinforces the idea that the market is still behaving like a bear market in transition.
After the October all-time high, Bitcoin’s price has failed to hold above the 0.786 retracement ($104,592), breaking successive structural supports.
The loss of the 0.618 level ($87,500) was especially important. It marked the shift from “bullish pullback” into trend deterioration.
The sharp move down through the 0.5 retracement ($75,494) resembles the bear-market behavior seen in prior cycles.
In 2022, similar breaks of mid-cycle Fibonacci levels coincided with a transition from optimism to disbelief.
The current 43% drop from the local top fits within that historical template.
From a moving-average perspective, BTC losing the 50-week EMA near $94,000 and now trading only marginally above the 200-week EMA (68,000) is a critical warning sign.
In past bear markets, the 200W EMA tends to act as a magnet during late-stage drawdowns, producing volatile bounces but not immediate trend reversals.
Structurally, this chart aligns with what on-chain data is signaling — underwater top buyers, distribution pressure on rallies, and fragile demand above $70,000.
Until Bitcoin’s price can reclaim the $75,000 zone and hold it as support, rallies are more likely to be bear-market rallies.
Disclaimer:
The information provided in this article is for informational purposes only. It is not intended to be, nor should it be construed as, financial advice. We do not make any warranties regarding the completeness, reliability, or accuracy of this information. All investments involve risk, and past performance does not guarantee future results. We recommend consulting a financial advisor before making any investment decisions.
Victor Olanrewaju is a crypto analyst and reporter at CCN with deep roots in on-chain research and technical analysis. His crypto journey began in 2017, but it was the 2020 Uniswap airdrop that sparked a full-time pivot into the space.
With a foundation in copywriting, Victor honed his craft creating high-converting content for leading crypto brokers — most notably an XRP price prediction that ranked #1 on Google during the 2021 bull run.
He later joined AMBCrypto in 2022, where he combined storytelling with technical and on-chain analysis to cover key market narratives.
In 2024, he expanded his expertise at BeInCrypto, collaborating with analysts and using tools like Glassnode, Santiment, and IntoTheBlock to break down Bitcoin and altcoin trends.
At CCN, Victor covers the top cryptocurrencies, memecoins, macro shifts, blending real-time insights with deep-dive metrics.
He holds a Bachelor’s degree in Physics from the University of Ibadan, equipping him to simplify complex data for a wide audience. Follow his work or connect on LinkedIn or X.