Has the TRX Market Cycle Ended? | Credit: Hameem Sarwar
Share
Key Takeaways
Tron (TRX) has broken down from a parabolic trend line.
The TRX price is holding on to the $0.320 horizontal support.
Will TRX break down before the end of the year, or can it rally?
Tron (TRX) is facing a critical moment after breaking down from its long-standing parabolic trend line.
Despite reaching a new all-time high of $0.45 in December 2024, the rally quickly faded, leaving warning signs of weakness.
The price now clings to the key $0.32 support zone, which could determine its fate.
TRX Price Breakdown
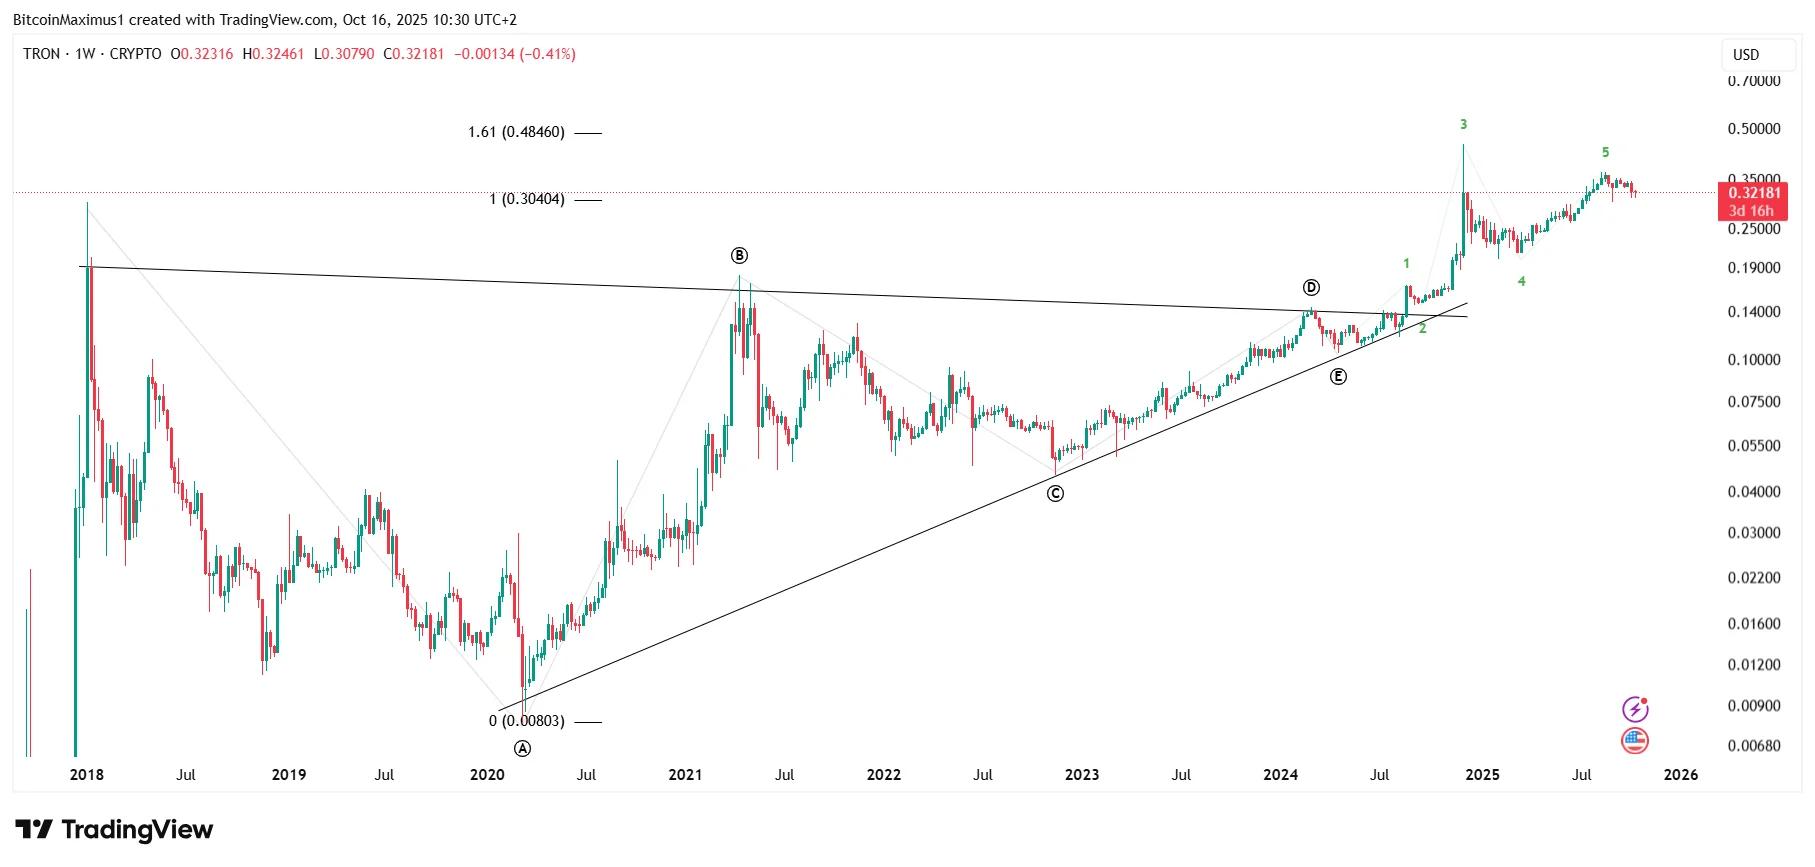
The weekly time frame analysis reveals that the TRX price has increased in tandem with a parabolic ascending support trend line since the beginning of 2023.
During its ascent, the TRX price hit a new all-time high of $0.45 in December, after using the parabola as a spring for a bounce.
Nevertheless, the upward movement could not be sustained, and the TRX price created a long upper wick, never revisiting its highs.
Get These Top Crypto Casino Offers Now!
Sponsored
Disclosure
We sometimes use affiliate links in our content, when clicking on those we might receive a commission at no extra cost to you. By using this website you agree to our terms and conditions and privacy policy.
Despite the lack of a follow-up, the TRX price bounced at the parabola several times (green icons), maintaining its bullish structure.
This changed last week, when the biggest crypto liquidation event on record finally caused the TRX price to crash below the parabola after 1,050 days.
Breakdowns from such long-term structures typically lead to a significant shift in trend.
This has not happened yet for TRX, possibly because the price has increased above the $0.320 horizontal support area. Once that goes, the TRX price could quickly plunge to new lows.
Momentum indicators do not suggest a bullish trend reversal. The Relative Strength Index (RSI) and Moving Average Convergence/Divergence (MACD) have generated bearish divergences (indicated by the orange lines).
The MACD has also made a bearish cross (black circle), the final confirmation that the TRX price prediction is bearish.
There is a lack of support below the current price, so TRX could quickly plunge to $0.22 if the $0.32 area gives.
Is the TRX Bull Trend Over?
The long-term wave count aligns with the TRX price action and indicator readings.
Although the count is unusual, it reveals a completed symmetrical triangle structure, which ultimately led to the breakout and an all-time high.
Since a triangle is either wave four or wave B in the higher degree structure, the breakout from it is the ultimate rally before the trend reverses.
Disclaimer:
The information provided in this article is for informational purposes only. It is not intended to be, nor should it be construed as, financial advice. We do not make any warranties regarding the completeness, reliability, or accuracy of this information. All investments involve risk, and past performance does not guarantee future results. We recommend consulting a financial advisor before making any investment decisions.
Valdrin Tahiri is a cryptocurrency analyst and reporter at CCN, specializing in technical analysis with a focus on Elliott Wave theory, on-chain metrics, and fundamental research. He brings over seven years of experience in the crypto space as both a trader and writer.
He discovered cryptocurrencies in 2017 while earning his MSc in Financial Markets at the Barcelona School of Economics, which sparked a deep interest in blockchain and market dynamics. Since then, he’s contributed to top crypto outlets like BeInCrypto and CoinGape.
Valdrin also served as Community Manager of BeInCrypto’s Telegram group for three years, helping grow it into one of the largest crypto communities worldwide. His expertise in market structure and price patterns allows him to break down complex trends into clear, actionable insights.
He’s published thousands of articles covering altcoins, Bitcoin cycles, and macro trends.