Bitcoin Exchange Balances Reach Lows Last Seen in 2018 — What Does This Mean for BTC Price?

What is happening on exchanges with Bitcoin | Credit: Shutterstock
Key Takeaways
- An estimated 11% of Bitcoin’s total circulating supply currently sits on exchanges.
- BTC held on exchanges continues to decline.
- Trend of Bitcoin withdrawals could have upside for BTC price.
The amount of Bitcoin being held on centralized cryptocurrency exchanges has reached lows not seen since 2018, but the metric could be a bullish sign for the future value of BTC.
Bitfinex released its latest Alpha report, which delves into the most prominent insights from the wider cryptocurrency ecosystem. A prominent takeaway from the report focuses on dwindling levels of Bitcoin’s circulating supply held on exchanges.
According to the analysts, exchange balances have dropped by 32% from peaks in March 2020, down from 3.1 million BTC to 2.1 million. The report notes that just 11 percent of the circulating supply of Bitcoin remains on exchanges, which is down by 17% from March 2020.
While the exact reasons for the trend remain a point of discussion, the report suggests that the propensity of Bitcoin users to hold their coins off exchanges could also have a positive effect on the value of the cryptocurrency in the medium term future.
Plotting the Supply
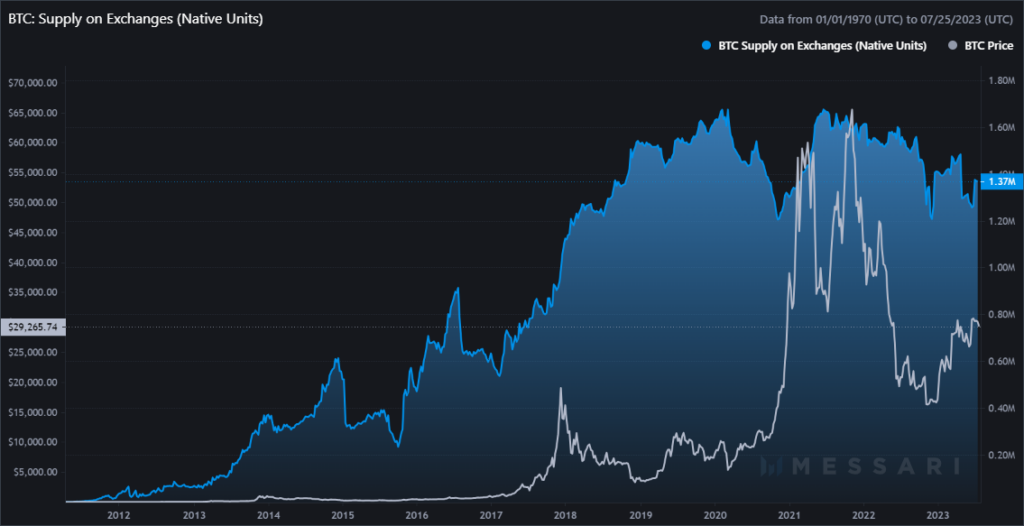
The number of Bitcoin held on major exchanges has been on a continuous decline since July 21, 2021, when it reached a peak of 1,675,582 BTC. The price of Bitcoin was $34,680 on that date and started moving to the upside, ultimately reaching $65,500 on November 8 of the same

With the bear market starting after, the prices have been decreasing dramatically, but BTC accumulation continued throughout the bear market, ultimately decreasing to the levels last seen in 2018.
The first major dip was from November 21, 2022, when it was 1,35M to 1,22M on December 5 of the same year. Consequently, this is the time Bitcoin’s price began to rise and made an increase from $17,088 on December 5 to $30,314 in mid-April 2023.
Supply on exchanges rose in this period as well and the mid-April high could have marked the completion of a corrective structure. But supply held on exchanges started falling back down again in a sharp manner and made it back down to the pre-recovery levels on June 19.
Since June 19, the number of Bitcoin held in major exchanges has been on the rise again, which correlates with the end of the price increase of Bitcoin. Can this be an early sign of the coming sellers’ pressure?
How to Interpret BTC Supply On Exchanges
First and foremost, as with every metric and technical indicator, BTC supply on exchanges should be interpreted relatively – meaning taking into account recent valuations.
However, the consensus is that if this metric is on the rise it could mean that investors are sending BTC to exchanges from their private wallets in order to make a sale.
Alternatively, if the number of Bitcoin is diminishing from exchange wallets, it usually means that investors are withdrawing the asset to their private wallets in order to hold for the long term, in other words, are accumulating.
As said above it should be viewed relatively because there can be numerous reasons why holds might want to deposit or withdraw Bitcoin from exchanges. Also, there are other players in the market that can cause the price change other than investors – miners, funds, and even exchanges.
Other Evidence of Accumulation?
Aside from the discussed metric other on-chain charts can be cross-referenced to support the accumulation assumptions.

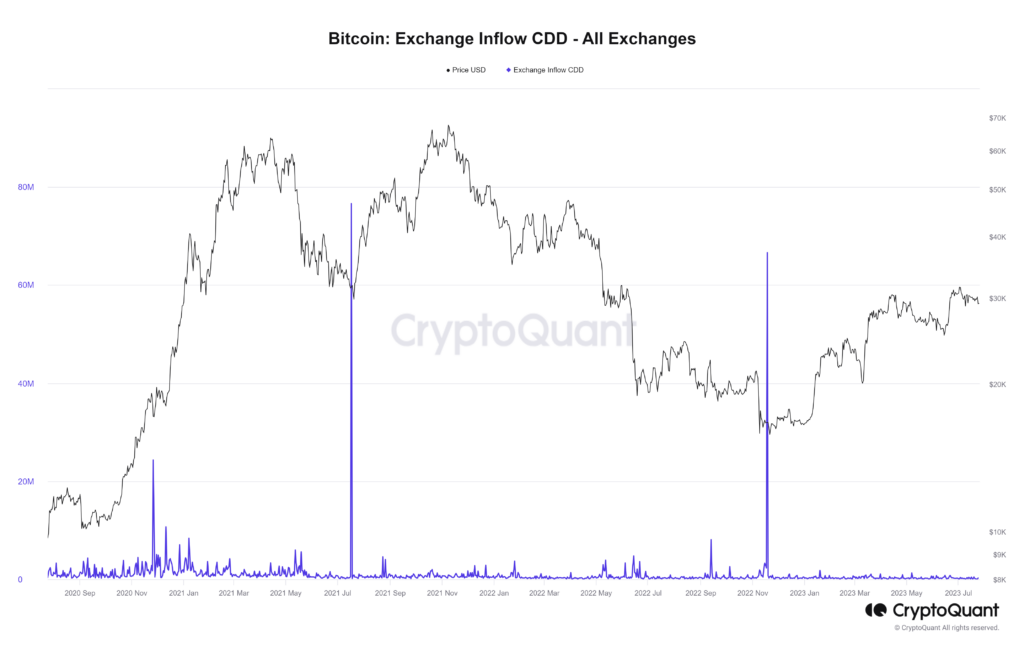
One of them is Exchange Inflow Coin Days Destroyed (CDD), which indicates whether or not long-term holders are moving their coins for a possible sell. If the values are high, then an incoming selling pressure is possible, but if the value is low, then it could indicate that long-term holders are still accumulating, or at least sitting tight.
The chart above shows that the values are small, meaning that long-term holders are still sitting on the sidelines.
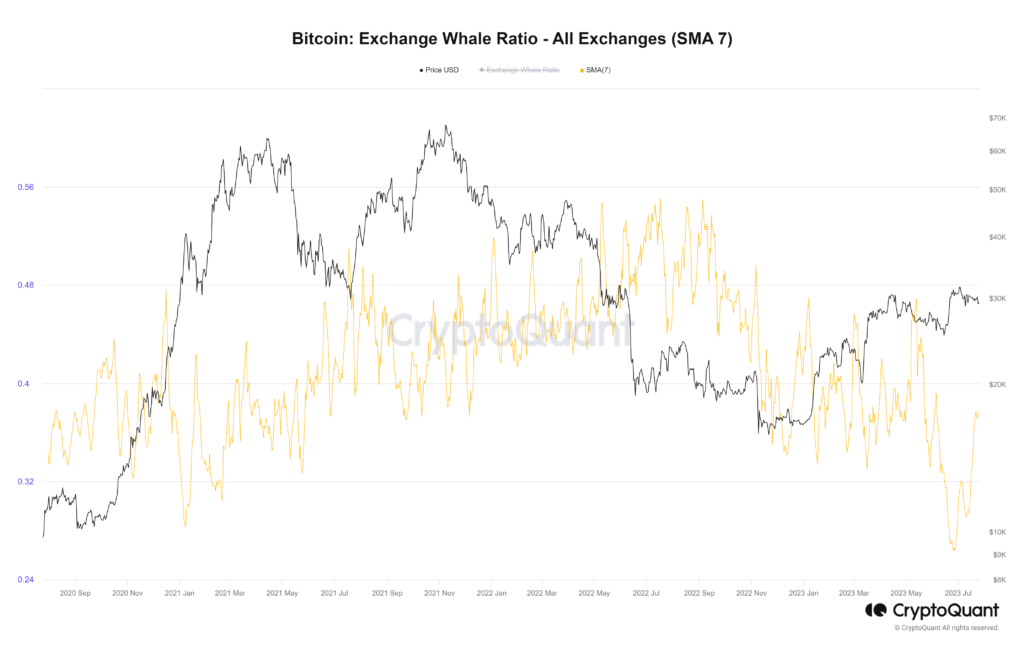
Another way of looking at the possibility of long-term investors accumulating is by looking into whale activity.

The exchange whale ratio has been on the rise since June 25, meaning that they are using the exchanges more than usual. It’s important to note that true whales don’t use exchanges but more often OTC services to mitigate the risk of slippage and impact the price when accumulating.
Be it as it may, this metric shows us that even so, the interest is high at the moment, and large transactions have been seen as this metric is calculated as the relative size of the top 10 inflow transactions to total inflows.
Accumulate Rather than Trade
The analysts concede that the decline of BTC on exchanges could be attributed to the usage of alternatives like decentralized exchanges and funds not covered by its data, but note that available metrics indicate widespread moves to withdraw Bitcoin from exchanges.
“This is also a testament of how longer-term holders are moving coins to cold storage. We see this as a positive for the price as more investors indicate the desire to accumulate rather than trade.”
The report also notes that derivatives market participation is increasing, which historically precedes price increases as spot prices decrease.
Cryptocurrency-backed investment funds saw a net inflow of $137 million in the third week of July, with 99% of these funds moving to Bitcoin-backed funds. This could also be driven by the fanfare surrounding renewed applications for Bitcoin exchange-traded funds headlined by the likes of BlackRock and Fidelity.
The analysts added that crypto funds have seen four consecutive weeks of gross inflows, with $742 million of investments over the last month.
Shorters Underscore Bitcoin’s Dominance
The report also indicates that Bitcoin’s dominance has been driven by outflows from Bitcoin shorting funds, which rise in value as the market price of BTC drops.
“These funds experienced $3.2 million in outflows for the week, reinforcing the bullish sentiment for the BTC price among investors, which has now been in a tight range for months,” the analysts wrote.
The report said that the data could be used as a “proxy for institutional investor bias” that will see the price of BTC break out of its current range to the upside. Analysts added that these factors paint a picture of Bitcoin’s dominance in the market, despite alt coins growing in market capitalization:
“The sustained inflows into Bitcoin-backed funds indicate a strong investor confidence in the asset, despite the volatility inherent in the crypto market.”
Addressing the Whale in the Room
The activity of Bitcoin whales, users that hold major sums of the cryptocurrency, also revealed some interesting on-chain events in recent weeks.
Blockchain data showing a period of increased inflows of BTC onto exchanges was linked to the distribution of 9,852 BTC seized from Silk Road by the United States Justice Department.
The institution moved a total of 9,825 BTC to exchanges on July 12, as it began its distribution strategy involving multiple wallets offloading BTC to different exchanges.
Chart analysis provided by Nikola Lazic