Bitcoin Pushing Through Resistance Again
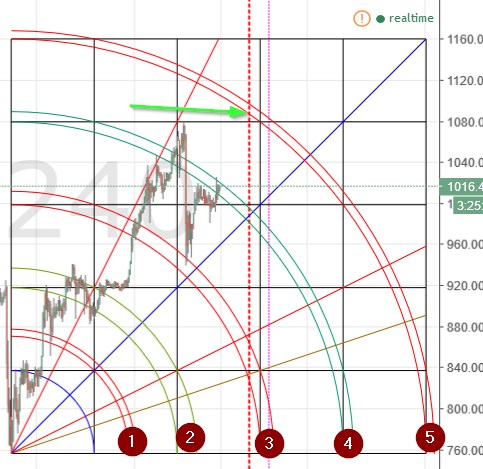
Bitcoin is now pushing its way through arc resistance in several timeframes. I think it is reasonable to assume that it will soon get through the arcs to close on the sunny side, giving us buy signals once again.
Here is a 4-hour chart:
 As you can see, in this setup it was the top of the 4th square that knocked price for a loop several days ago. But the chart found support at the 3rd arc, retraced back to the 4th arc, faltered for a bit, but is now pushing through.
Of course, it is possible that the 2nd arc of the pair will knock it back down, but that seems a bit unlikely. Far more likely, imho, is that price will get through and target the 5th arc at ~ $1087.
It seems that the 2/19-2/21 timeframe will see price hit the 5th arc. What will likely happen then? Of course, I can’t say for sure. However, Chris Carolyn’s epic work, “The Spiral Calendar” has called out this time frame as a time window to watch as an “energy point in time”, so to speak. Truthfully, for several weeks now I had assumed that the 2/21 time frame was going to see a major low, leading to a wonderful time for the bulls. It now appears that it may in fact be a top.
Time will tell if that is true or not. But for now, it seems that a buy signal on the 4-hour chart is likely imminent.
Here is the 2-hour BTCCN.comY chart (BTCCHINA): Here we can see that price fell after reaching the end of the 2nd square in time, but has since crossed the 3rd arc pair. While price is still looking a bit weak here, the 4th arc is a long way up, when/if price decides to turn up.
Happy trading!
Remember: The author is a trader who is subject to all manner of error in judgement. Do your own research, and be prepared to take full responsibility for your own trades.
Image from Shutterstock.