
Bitcoin closed just below the arc support it had been resting on for a couple days. As you can see below, the top of the square stopped this advance for 3 days in a row. This break below support does not support the bullish argument. 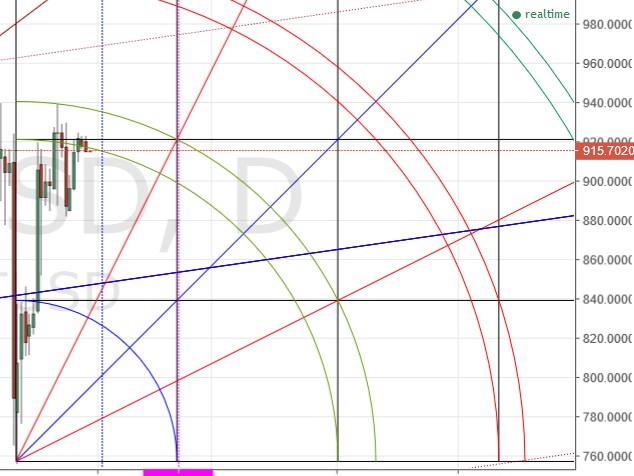 Let’s look closer at a short-term chart to see if there is more information to be gleaned therein:
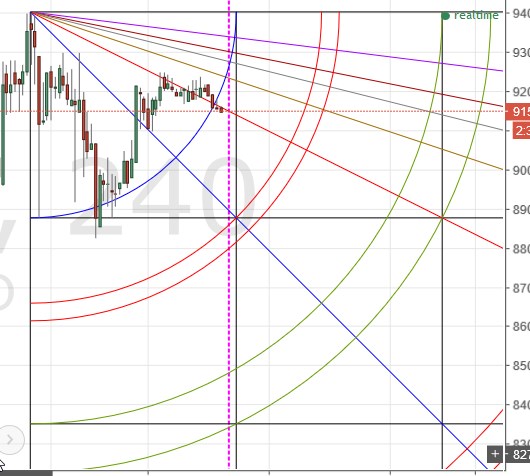 Here can see that the bearish setup from the swing high on a 4-hour chart (Kraken) has also seen a break in support, as price has closed below first arc support (blue arc), and also below the 2×1 Gann angle (red line). As can be observed, the 2×1 was resisting price for quite a while before it just briefly managed to get (marginally) above the angle. All of these things suggest weakness in price will continue.
I have expressed the opinion on these pages that the correction was not yet over. If in fact the downturn resumes here, perhaps as a C wave of an A-B-C Elliott Wave, this bear setup on the daily chart indicates where the major supports will be found: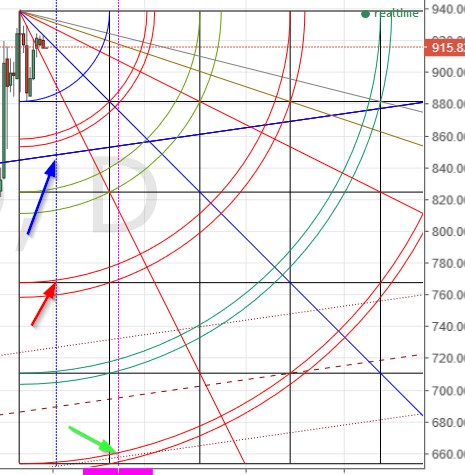 Interestingly, price was stopped by the 1×1 angle on this setup, which suggests that pricetime is respecting the setup.
The blue arrow is pointing to the ‘0 line’ of an Andrews Pitchfork (not shown). That support, at ~ 850 could hold, at least temporarily. More likely, imho, long-term support will be found at the 3rd or 5th arc pairs (red and green arrows respectively). The green arrow shows the intersection of the 5th arc and the 2/21/2017 timeframe. This February date is highlighted as a significant energy point (in time) in the bitcoin market by the ‘Spiral Calendar’ championed by Chris Carolyn.
Happy trading!
Remember: The author is a trader who is subject to all manner of error in judgement. Do your own research, and be prepared to take full responsibility for your own trades.
Image from Shutterstock.
