Bitcoin Consolidating before next Move Up

Bitcoin
“Wheels within wheels” – that’s what Gann called the fractal nature of markets. That uniquely perplexing feature of market activity such that markets react to support and resistance at multiple time frames simultaneously.
Look at the daily Bitcoin chart we have been looking at for weeks now:
We can see that price broke through the 1st of the 3rd arc pair and is struggling as it is meandering its way toward the 2nd of the pair. As I have suggested repeatedly here, when/if price closes above the 3rd arc pair, a fun rally will likely commence.
Now lets look at the exact same chart, but with a smaller bull setup beginning at the mid-May low: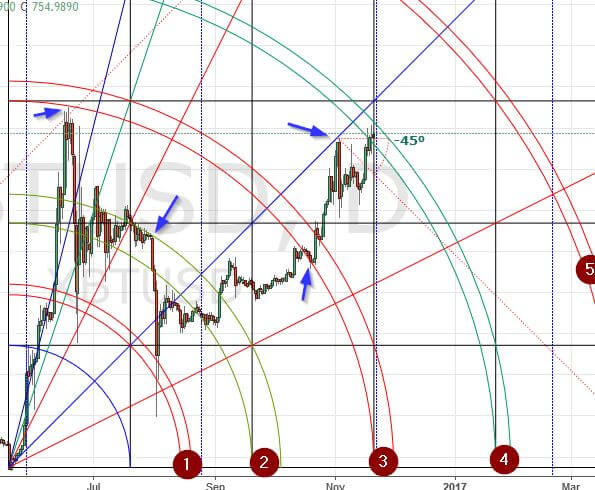
As should be clear from the arrows which are highlighting just a few of the places wherein pricetime has respected the setup, this setup, like it’s much larger sibling above, is indicating why price has been moving sideways for a few days now. On this setup, pricetime is working its way through the 4th arc pair.
The interesting this about this setup is that here we see pricetime will be at the end of the 3rd square as soon as the day after tomorrow. It therefore will not be a surprise if an acceleration begins at that time.
To look at geometry from a different perspective, lets look at a pitchfork on an 8-hour chart:
 Here we can that pricetime has been moving up a very steep angle, constrained by the 1.414, 1.618 and 1.732 extensions off a rather obvious pitchfork. As of this writing, price is continuing to hug the 1.618 extension, as it has for the past few days. I see no reason to believe that the 1.732 extension’s support will break any time soon.
Here, on the same chart, is a different, longer-term pitchfork illustrating a gentler sloping rate of ascent, with clear indications of where future support and resistance can be expected. I have highlighted several places where that S/R has already been tested and held. There are others I did not highlight.
 Because these lines are not horizontal, one cannot easily say where the resistance is in terms of price, because the geometry is such that resistance determined by where in price and time ( pricetime), the line is touched. If and when the 0 line (bold blue line) is touched, a selloff can be anticipated, though not necessarily a sell-off that a investor needs to worry about as much as a day-trader. In other words, the longer term trend will likely remain upwards until at least the end of the year.
Ethereum
Here it 6 days after I was faked out by what looked like the beginning of a breakout on the ethereum daily chart, and the coin has still not been able to break free of the 3rd arc.
 You can see how the 2nd arc thrashed ethereum price, which was later thrown to the ground exactly at the end of the 2nd square. It finally met the 3rd arc and began falling; price has not escaped the arc’s pull of gravity since then (all these market events are highlighted by blue arrows). The good news is there is not much time before the arc loses its ability to hold the coin down. Time has passed such that pricetime will have soon moved passed the arc. That could happen any time now, so ethereum traders should be alert to a trend change at any time.
Happy trading!
Remember: The author is a trader who is subject to all manner of error in judgement. Do your own research, and be prepared to take full responsibility for your own trades.
Image from Shutterstock.
