The Venus Protocol is a decentralized finance (DeFi) crypto lending platform with a twist. The network allows people to mint stablecoins based on the collateral they put in when they want to take out a loan.
The network’s XVS token has had a tough time over the last few years. The heights of May 2021, when it came very close to breaking past $150, seem a long way away, with XVS dropping nearly 70% since this time last year.
On March 14 2025, XVS was worth about $5.45.
Let’s take a look at our Venus Protocol price predictions, made on March 14, 2025. We will also examine the Venus Protocol price history and talk a little about what Venus Protocol is and what it does.
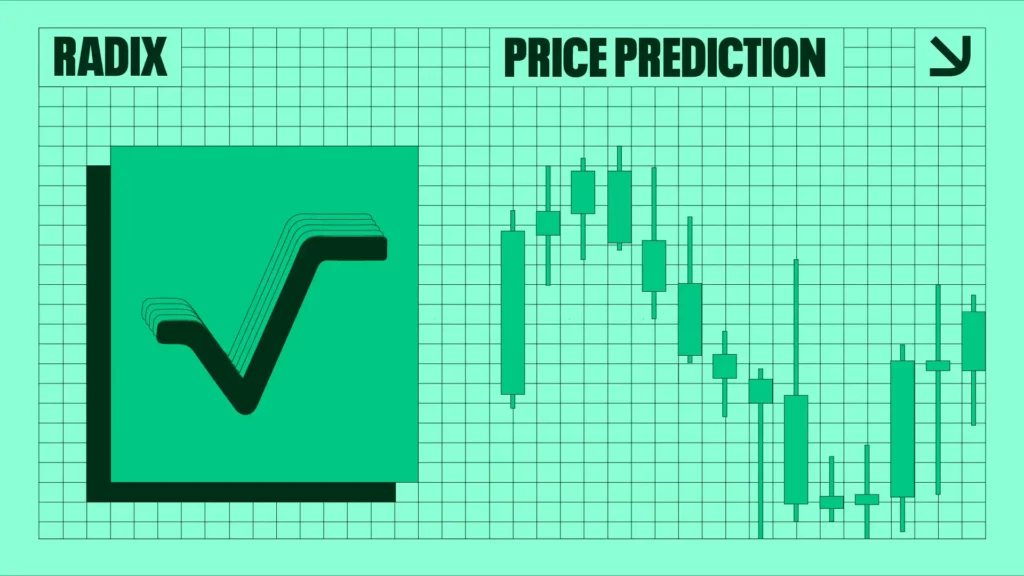
Venus Protocol Price Prediction
Let’s take a look at some of our Venus Protocol price predictions made by CCN on March 14, 2025. It is important to remember that price forecasts, especially for something as potentially volatile as crypto, are often wrong.
Minimum XVS price prediction
Average XVS price prediction
Maximum XVS price prediction
2025
$3
$7.50
$12
2026
$5
$10
$18
2030
$8
$20
$35
Venus Protocol Price Prediction 2025
XVS is expected to recover from its corrective phase, with a minimum price of $3 if bearish pressure persists and the key $4 to $4.50 support fails. However, if the anticipated bullish reversal materializes, the price could average around $7.50, with a maximum target of $12 driven by trendline breakouts and renewed investor interest.
Venus Protocol Prediction 2026
By 2026, XVS could establish a sustained uptrend if it successfully breaks above $7.50, leading to an average price of $10 as it consolidates within a bullish structure. A strong market cycle and increasing adoption of the Venus protocol could push XVS toward a peak of $18, although downside risks remain if broader market conditions weaken.
Venus Protocol Price Prediction 2030
In the long term, XVS has the potential for significant growth, with institutional adoption and DeFi expansion supporting a projected average price of $20. If the ecosystem thrives and demand surges, the price could reach $35, while bearish cycles or stagnation might keep it closer to $8.
Venus Protocol Price Analysis
XVS is nearing a key $3.50 to $4.50 support zone, historically an accumulation area. The daily chart shows a WXY corrective structure, potentially completing the third wave. The descending trendline at $7.50 remains crucial resistance, requiring a breakout for a bullish shift. RSI is near oversold, increasing the likelihood of a reversal.
Venus Protocol could go back up soon | Credit: Nikola Lazic/TradingView
A final dip between $3.50 and $4.50 on the four-hour chart could precede a strong rebound. Holding this support would confirm an impulsive wave up, while failure risks a deeper drop toward $2.50, though unlikely based on historic behavior.
Short-term Venus Protocol Price Prediction
The one-hour chart suggests the third wave is nearly complete, with a possible final decline to $ before reversing. Fibonacci retracement highlights $4.12 as key support.
A rebound from this level could push XVS towards $7.50, with a confirmed breakout targeting $9.
XVS needs to stay above $4 | Credit: Nikola Lazic/TradingView
If $4.00 holds, upside momentum is likely. However, failure to maintain this zone could drive XVS to $3.00. RSI above 50 would confirm bullish strength.
A successful rebound could propel XVS past $7.50, confirming a broader trend reversal. The Venus Protocol price prediction for the next 24 hours depends on whether or not it can stay above $4.
Venus Protocol Average True Range (ATR): XVS Volatility
The Average True Range (ATR) measures market volatility by averaging the largest of three values: the current high minus the current low, the absolute value of the current high minus the previous close, and the absolute value of the current low minus the previous close over a period, typically 14 days.
A rising ATR indicates increasing volatility, while a falling ATR indicates decreasing volatility. Since ATR values can be higher for higher-priced assets, normalize ATR by dividing it by the asset price to compare volatility across different price levels.
On March 14, 2025, Venus Protocol’s ATR was 0.71, suggesting relatively high volatility.
Venus Protocol Relative Strength Index (RSI): Is XVS Overbought or Oversold?
The Relative Strength Index (RSI) is a momentum indicator traders use to determine whether an asset is overbought or oversold. Movements above 70 and below 30 show over and undervaluation, respectively.
Movements above and below the 50 line also indicate if the trend is bullish or bearish.
On March 14, 2025, the Venus Protocol RSI was at 36, indicating bearish conditions
Venus Protocol Market Cap to TVL Ratio
The Total Value Locked (TVL) to market cap ratio (TVL ratio) measures the valuation of a decentralized finance (DeFi) project by comparing its market capitalization to the total value of assets locked in its smart contracts. This ratio shows the project’s utilization and links the platform’s health to the value of locked assets.
A ratio above 1.0 indicates overvaluation because the market cap exceeds the value of assets used in the platform.
A ratio below 1.0 indicates undervaluation because the market cap is lower than the value of locked assets.
On March 14, 2025, the Venus Protocol TVL ratio was 0.05, suggesting severe undervaluation.
CCN Strength Index
The CCN Strength Index combines an array of advanced market signals to measure the strength of individual cryptocurrencies over the last 30 days.
Every day, it assigns a strength score, ranging from 0 to 100, to the top 500 assets by market capitalization on CoinMarketCap, focusing on both trend direction and the intensity of price movements.
0 to 24: Assets exhibit significant weakness, showing signs of sustained downtrend behavior.
25 to 35: The price tends to move within stable bounds with minimal volatility.
36 to 49: Assets begin a stable uptrend but without strong surges.
50 to 59: Consistent growth with moderate price advances, building momentum.
60+: Sharp price movements and high demand indicate stronger volatility and trend shifts.
The index dynamically adapts to rapid changes. For example, an asset experiencing a 100% increase within a short timeframe would see a sharp jump in its score to reflect the intensity of the rise.
However, should that asset stabilize at this new price level, the score will gradually taper down and align with the dampened momentum as the movement normalizes. The same principle applies to rapid declines: a sudden drop will spike the score downward, but the score will slowly adjust back up as volatility decreases.
On March 14, 2025, Venus Protocol scored 39 on the CCN Index, suggesting moderate momentum.
XVS CCN Index | Credit: CCN
Venus Protocol Price Performance Comparisons
Venus Protocol is, basically, a DeFi platform, so let’s compare how XVS has done compared to other tokens from the same category with a similar market cap.
We looked at the Venus Protocol price history and found the best times to buy XVS.
Day of the Week
Sunday
Week
6
Month
February
Quarter
First
XVS Price History
Let’s now look at some key dates in the Venus Protocol price history. While past performance should never be taken as an indicator of future results, knowing what the token has done can help give us some very useful context when it comes to either making or interpreting a Venus Protocol price prediction.
Venus Protocol price history for the last 12 months | Credit: CoinMarketCap
Time period
XVS price
Last week (March 7, 2025)
$6.37
Last month (Feb. 14, 2025)
$8.34
Three months ago (Dec. 14, 2025)
$11.54
One year ago (March 14, 2025)
$17.13
Launch price (Oct. 6, 2020)
$2.55
All-time high (May 10, 2021)
$147.02
All-time low (Nov. 4, 2020)
$2.07
Venus Protocol Market Cap
Market capitalization, or market cap, is the sum of the total number of XVS in circulation multiplied by their price.
Venus Protocol market cap for the last 12 months | Credit: CoinMarketCap
On March 14, 2025, Venus Protocol’s market cap was $90.15 million, making it the 345th-largest crypto by that metric.
Who Owns the Most Venus Protocol?
On March 14, 2025, one wallet held nearly 45% of the XVS supply.
0xfd36e2c2a6789db23113685031d7f16329158384. This wallet held 13,164,820 XVS or 43.88% of the supply.
0x051100480289e704d20e9db4804837068f3f9204. This wallet held 7,148,186 XVS or 23.83% of the supply.
0xf977814e90da44bfa03b6295a0616a897441acec. This wallet held 3,292,001 XVS or 10.97% of the supply.
0xf8f46791e3db29a029ec6c9d946226f3c613e854. This wallet held 1,098,297 XVS or 3.66% of the supply.
0x151b1e2635a717bcdc836ecd6fbb62b674fe3e1d. This wallet held 628,543 XVS or 2.1% of the supply.
Venus Protocol Supply and Distribution
Supply and distribution
Figures
Total supply
30,000,000
Circulating supply (as of March 14, 2025)
16,590,110 (55.3% of total supply)
Holder distribution
Top 10 holders owned 90.67% of the supply as of March 14, 2025
From the Venus Protocol Whitepaper
In its technical documentation, or whitepaper, Venus Protocol claims to be “pushing the edges of decentralized finance through its novel combinations of existing solutions and deployment on the BNB chain, lowering the barrier to entry for millions of new users around the globe”.
What is Venus Protocol?
The Venus Protocol is one of many cryptocurrency lending platforms out there. What makes the system, which was founded in 2020 by a team led by crypto entrepreneur Joselito Lizarondo, a little different from its rivals is that it can mint stablecoins. These cryptos are designed to match the price of an asset, usually the US Dollar.
Unlike most crypto lenders, Venus Protocol is based on the Binance (BNB) blockchain, which, it claims, makes it quicker and cheaper than similar platforms based on Ethereum (ETH).
The Venus Protocol is supported by its own native token, which goes by the ticker handle XVS.
How Venus Protocol Works
The Venus Protocol system allows people to set aside a crypto deposit as collateral against a loan made in stablecoins. The collateral helps mint the stablecoins, ensuring that the system works as it should.
In terms of XVS itself, this token gives holders the right to vote on changes to the network. It can also be bought, sold, or traded on exchanges.
It is worth pointing out that XVS is a token, not a coin because it is based on the Binance blockchain. You might see references to things like a Venus Protocol coin price prediction, but these are wrong.
Is Venus Protocol a Good Investment?
It is difficult to tell. Venus Protocol operates in a crowded market that has never quite been the same since the Celsius crypto lending platform suspended withdrawals in June 2022.
Not only that, but the XVS token has not exactly been breaking through any significant barriers recently, despite the claims made in its rather poorly written whitepaper.
As always with crypto, you should do your own research before deciding whether or not to invest in XVS.
Will Venus Protocol go up or down?
No one can really tell right now. While the Venus Protocol crypto price predictions are largely positive, price predictions have a well-earned reputation for being wrong. Keep in mind, too, that prices can and do go down and up.
Should I invest in Venus Protocol?
Before deciding whether to invest in Venus Protocol, you must do your own research on XVS and other related coins and tokens such as KAVA or Compound (COMP). Either way, you will also need to ensure you never invest more money than you can afford to lose.
Technical analysis by Nikola Lazic.
FAQs
How many Venus Protocol are there?
On March 14 2025, there were
Will Venus Protocol reach $100?
Our price predictions, based on technical analysis, suggest XVS won’t reach three figures until at least the 2030s, if ever.
What is Venus Protocol used for?
The XVS token gives its holders the right to vote on changes to the Venus Protocol crypto lending platform. It can also be bought, sold, and traded on exchanges.
Disclaimer:
The information provided in this article is for informational purposes only. It is not intended to be, nor should it be construed as, financial advice. We do not make any warranties regarding the completeness, reliability, or accuracy of this information. All investments involve risk, and past performance does not guarantee future results. We recommend consulting a financial advisor before making any investment decisions.
Peter Henn has been a journalist since 2005. In that time, he has written for a variety of publishers including the Mail on Sunday and the Daily Express. He has previously covered the world of cryptocurrency for Currency.com and Capital.com, and has also written for ECigIntelligence.com and CBD-Intel.com. A graduate of the University of Liverpool, he is based in the United Kingdom. His hobbies include music, horse racing and performance art.
Nikola Lazic is a cryptocurrency analyst and investor working in the industry since 2017. He holds a bachelor's degree in Sociology, which enables him to better understand the psychology behind the crowd´s positioning. Consequently his preferred analytical tool is Elliott Wave Theory in combination with price action analysis.
Combining his experience in trading and investing with knowledge in content writing he strives to bring the most accurate and actionable information.