Will Ziliqa's Mainnet Upgrade Spark Rally? | Credit: Hameem Sarwar
Share
Key Takeaways
Ziliqa’s mainnet upgrade will go live today.
The Ziliqa (ZIL) price has created a triple bottom pattern.
Will the positive news spark a Ziliqa price increase?
Ziliqa’s 0.19.0 mainnet upgrade will go live today. The hard fork will introduce two key improvements: a 7-day stake unbonding period and the jailing of faulty proposers to improve network liveness.
Although the ZIL price has trended downward for over five years, it has created a bullish short-term pattern.
Combined with the positive news, the pattern could trigger a much-needed relief rally for the Ziliqa price.
Let’s examine the charts and figure out how likely that is.
Ziliqa’s Bullish Pattern
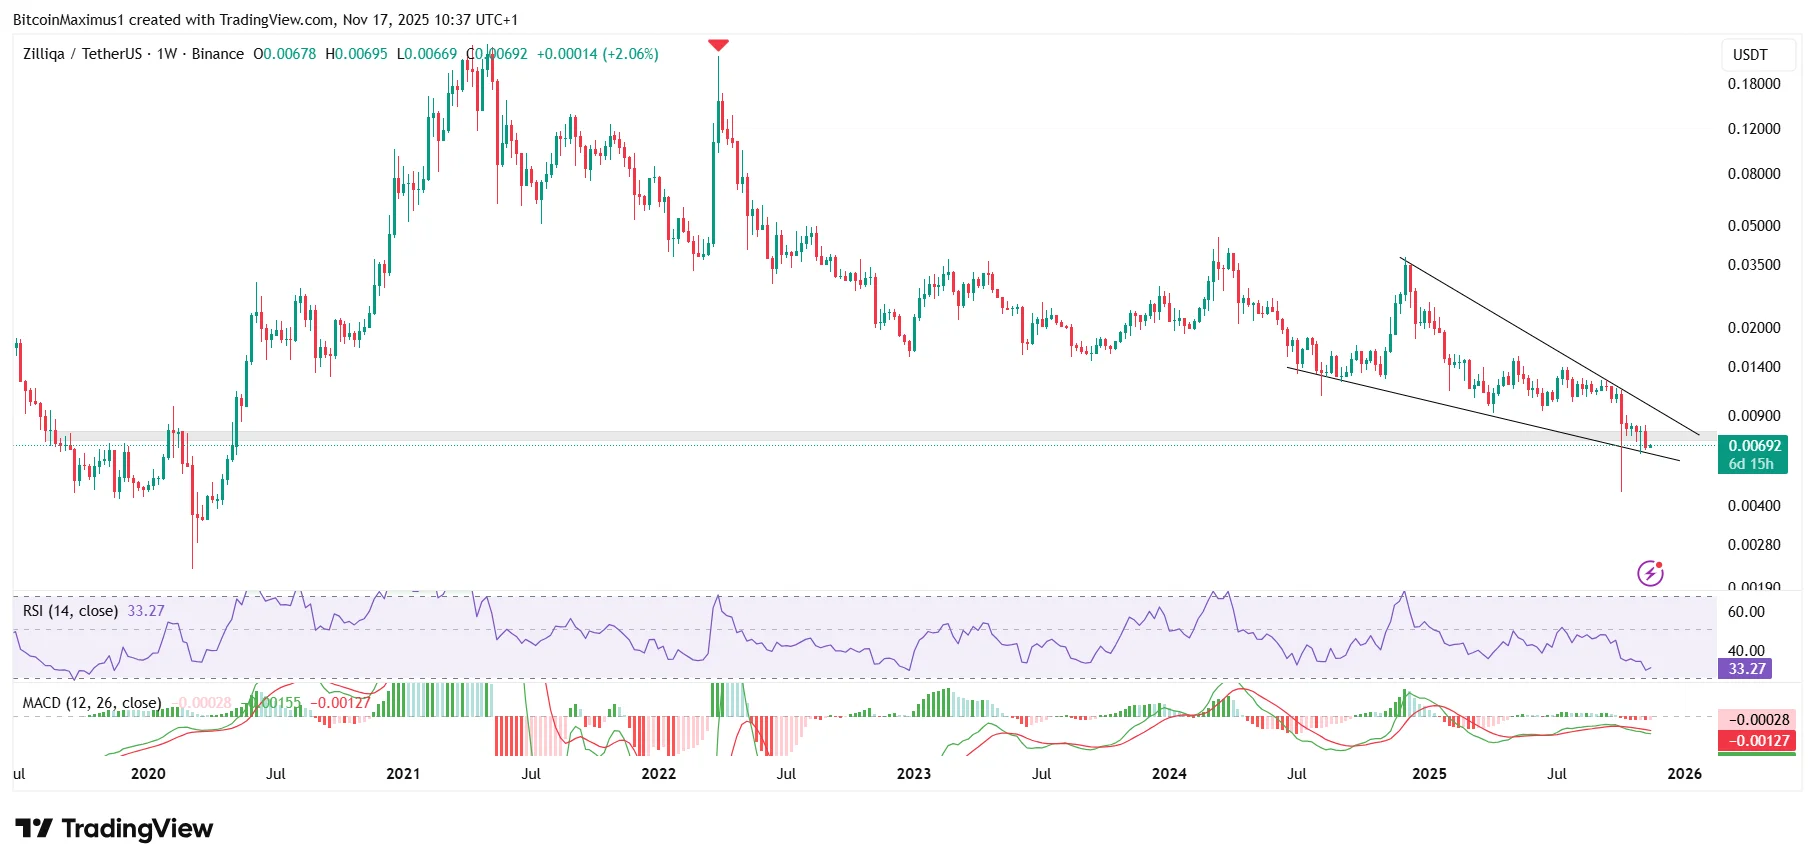
The weekly time frame ZIL chart shows that the price has fallen since its all-time high of $0.257 in May 2021.
Next year, the price created a lower high (red icon) and accelerated its downward trend.
The entire current bullish cycle has been nonexistent, as the price of ZIL has created lower highs and lower lows.
Get These Top Crypto Casino Offers Now!
Sponsored
Disclosure
We sometimes use affiliate links in our content, when clicking on those we might receive a commission at no extra cost to you. By using this website you agree to our terms and conditions and privacy policy.
While the wedge is a bullish pattern, the ZIL trend cannot be considered bullish until the price reclaims the $0.008 area and breaks out from its wedge.
Momentum indicators are decisively bearish. The Relative Strength Index (RSI) is crashing, and so is the Moving Average Convergence/Divergence (MACD).
Since the ZIL price has trended downward for four years, the wedge’s presence is unlikely to cause a bullish trend reversal, given the other bearish signals already in place.
Can Ziliqa Bounce?
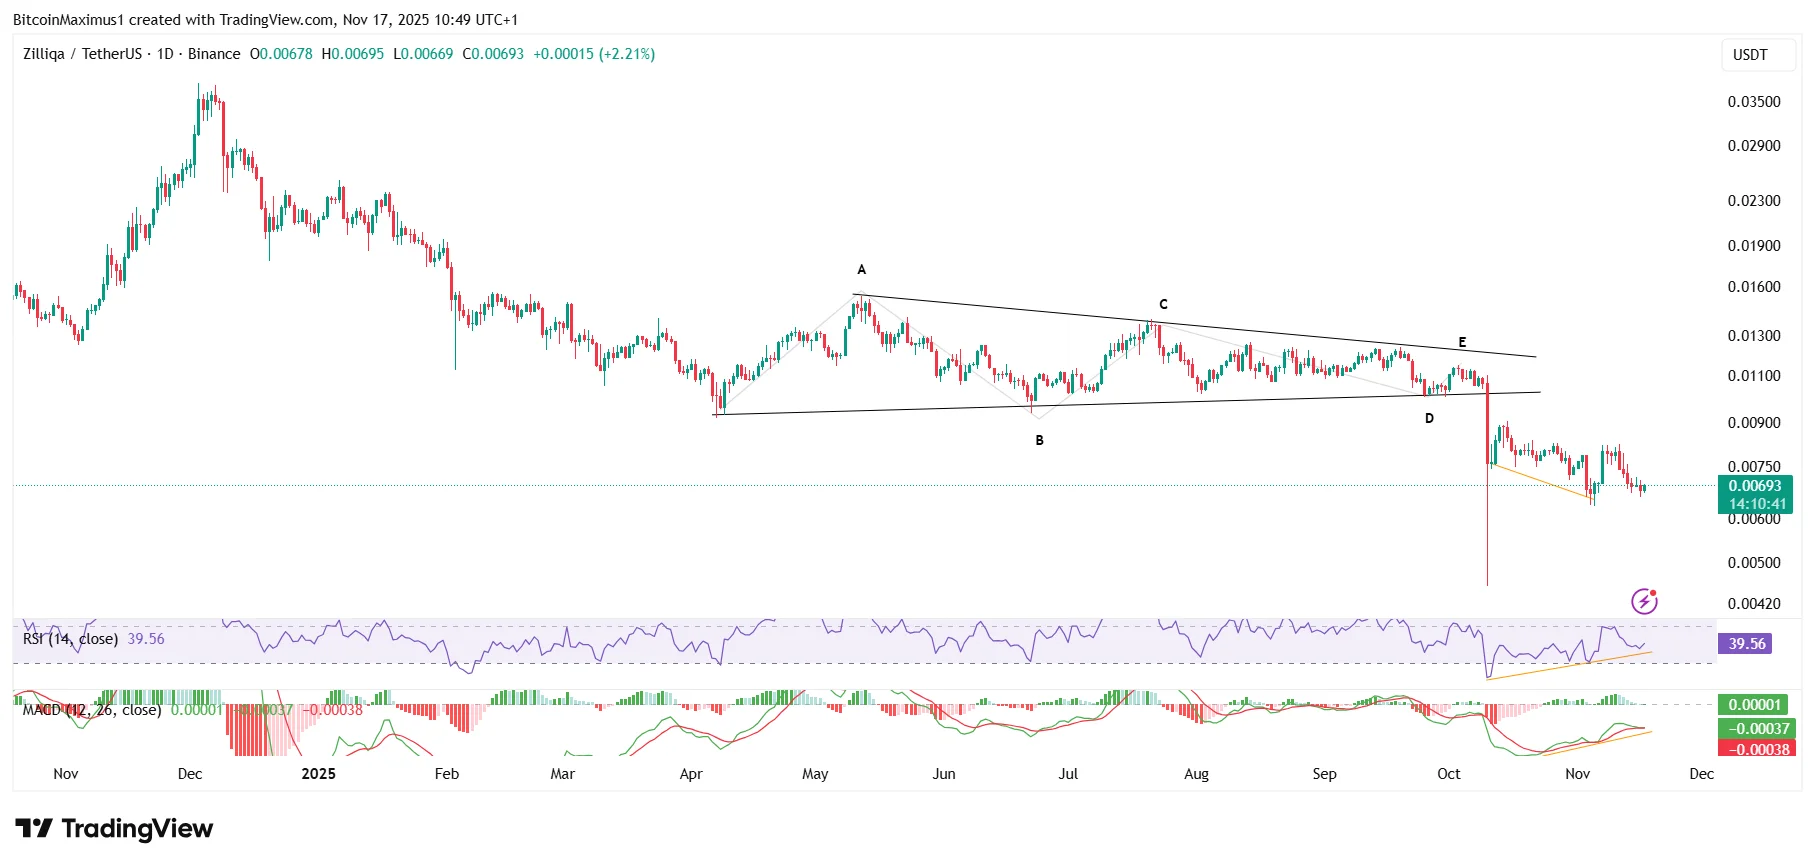
While the weekly time frame chart is bearish, the daily one provides some bullish signs.
The breakdown from the triangle often marks the end of the downward movement and could trigger a bullish trend reversal.
So, the ZIL price could undergo a short-term reversal, possibly returning to the $0.008 horizontal resistance again.
However, the chances of a full-blown bullish trend reversal remain slim.
Short-Term Bounce Incoming
Ziliqa’s 0.19.0 upgrade may provide the charts with a short-term boost, particularly with the formation of triple bottoms and bullish divergences on the daily time frame.
A short-term bounce toward $0.008 is possible if momentum strengthens.
Still, with the overall trend bearish, any rally will likely meet strong resistance and reverse.
Disclaimer:
The information provided in this article is for informational purposes only. It is not intended to be, nor should it be construed as, financial advice. We do not make any warranties regarding the completeness, reliability, or accuracy of this information. All investments involve risk, and past performance does not guarantee future results. We recommend consulting a financial advisor before making any investment decisions.
Valdrin Tahiri is a cryptocurrency analyst and reporter at CCN, specializing in technical analysis with a focus on Elliott Wave theory, on-chain metrics, and fundamental research. He brings over seven years of experience in the crypto space as both a trader and writer.
He discovered cryptocurrencies in 2017 while earning his MSc in Financial Markets at the Barcelona School of Economics, which sparked a deep interest in blockchain and market dynamics. Since then, he’s contributed to top crypto outlets like BeInCrypto and CoinGape.
Valdrin also served as Community Manager of BeInCrypto’s Telegram group for three years, helping grow it into one of the largest crypto communities worldwide. His expertise in market structure and price patterns allows him to break down complex trends into clear, actionable insights.
He’s published thousands of articles covering altcoins, Bitcoin cycles, and macro trends.