Has the PI Downtrend Finally Ended? | Credit: Hameem Sarwar
Share
Key Takeaways
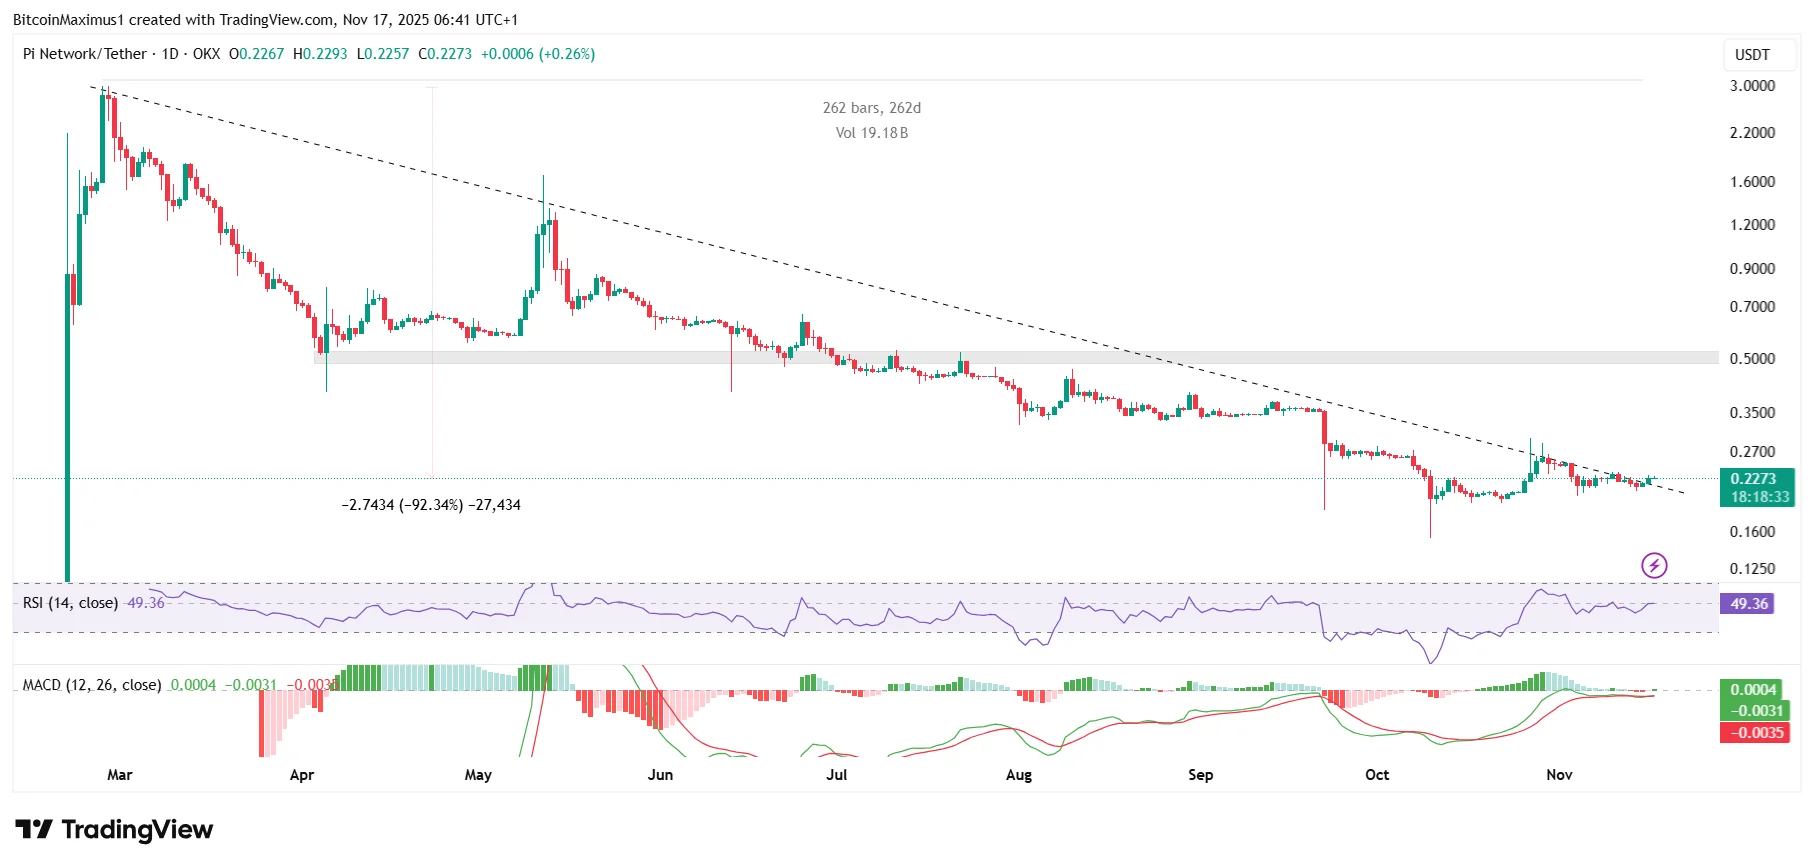
Pi Network (PI) broke out from a 262-day resistance level.
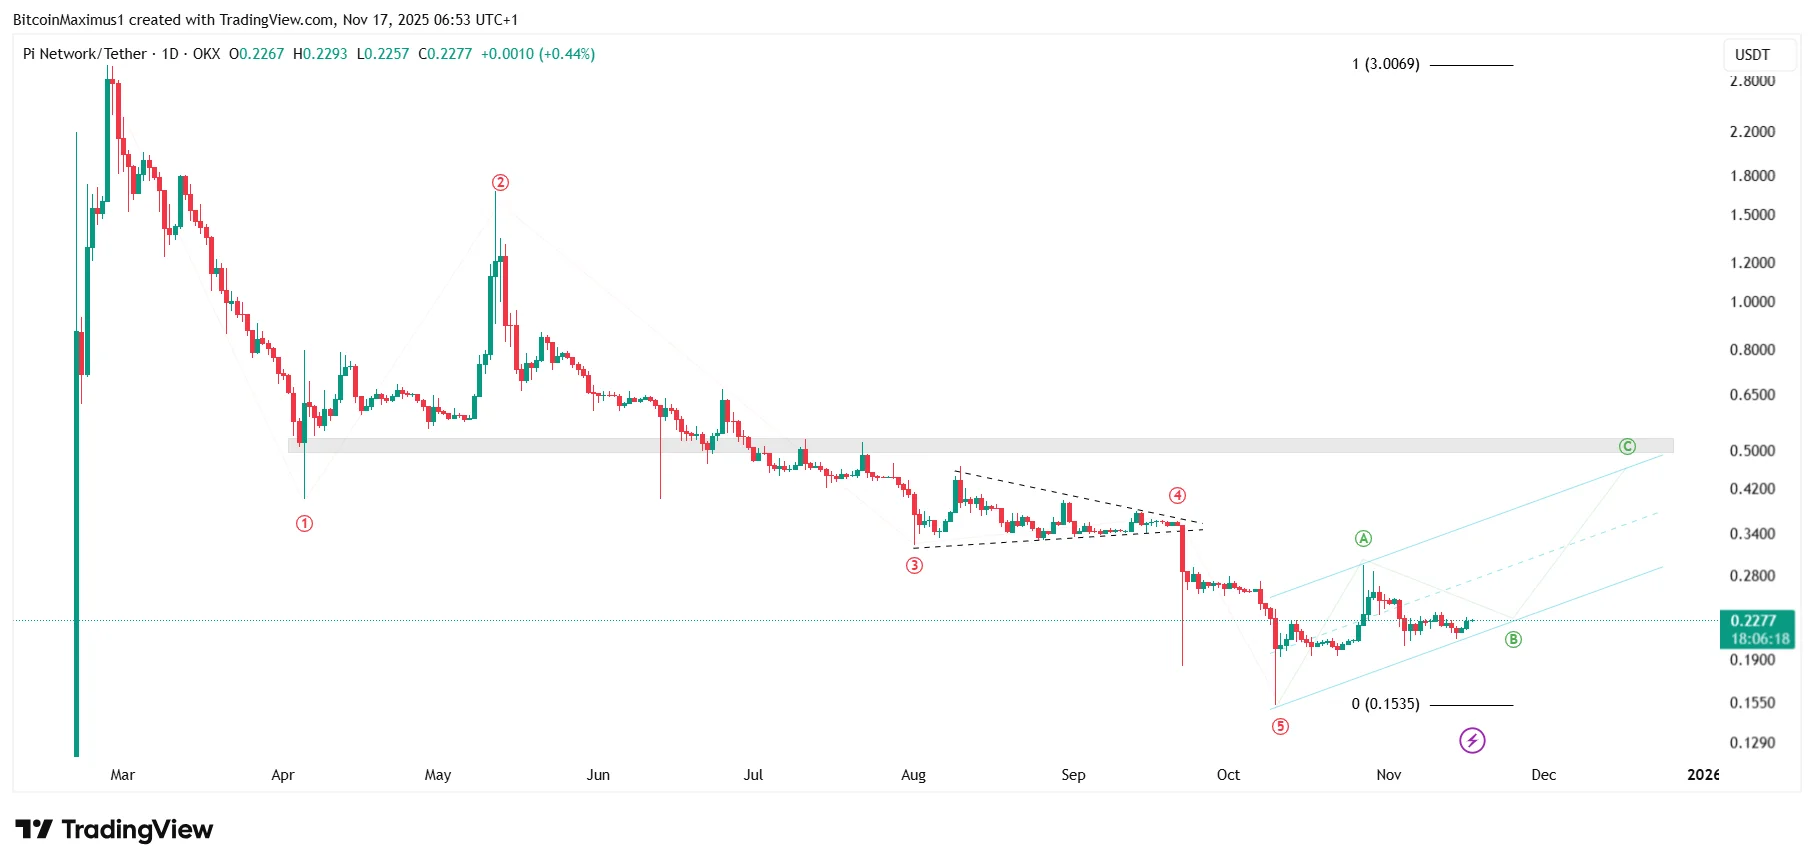
PI has completed a five-wave downward movement.
Is the Pi Network’s downward trend finally over?
Pi Network is showing signs of life after months of grinding lower, breaking above diagonal resistance.
The move comes immediately after the price set an all-time low and began forming its first higher lows, signs of a reversal structure.
With indicators and the wave count shifting bullish, PI could be gearing up for a strong recovery.
Pi Network Price Surge
The daily price analysis shows that Pi Network has finally broken through diagonal resistance since its all-time high.
PI’s decline led to an all-time low of $0.153 on Oct. 10, but the trend reversed afterward.
Get These Top Crypto Casino Offers Now!
Sponsored
Disclosure
We sometimes use affiliate links in our content, when clicking on those we might receive a commission at no extra cost to you. By using this website you agree to our terms and conditions and privacy policy.
After several higher lows and unsuccessful breakout attempts, PI finally moved above the trend line yesterday, and the price is currently attempting to confirm the breakout.
Since the trend line has been in place for such a long time, a breakout above it will likely lead to a sustained rally toward the next resistance level at $0.50.
Momentum indicators support this bullish PI prediction. The Relative Strength Index (RSI) is crossing 50 from below, and the Moving Average Convergence/Divergence (MACD) is nearly positive.
As a result, the PI downward movement could have ended, and the price could begin a rally toward the next resistance at $0.50.
Why is PI Going Up?
The long-term wave count aligns with the bullish price action of the PI, supporting the validity of the breakout.
According to the count, PI has completed a five-wave downward movement (red), where wave four was a symmetrical triangle, the most common pattern in these structures.
If the count is accurate, the Oct. 13 all-time low marked the bottom of the five-wave upward movement.
Disclaimer:
The information provided in this article is for informational purposes only. It is not intended to be, nor should it be construed as, financial advice. We do not make any warranties regarding the completeness, reliability, or accuracy of this information. All investments involve risk, and past performance does not guarantee future results. We recommend consulting a financial advisor before making any investment decisions.
Valdrin Tahiri is a cryptocurrency analyst and reporter at CCN, specializing in technical analysis with a focus on Elliott Wave theory, on-chain metrics, and fundamental research. He brings over seven years of experience in the crypto space as both a trader and writer.
He discovered cryptocurrencies in 2017 while earning his MSc in Financial Markets at the Barcelona School of Economics, which sparked a deep interest in blockchain and market dynamics. Since then, he’s contributed to top crypto outlets like BeInCrypto and CoinGape.
Valdrin also served as Community Manager of BeInCrypto’s Telegram group for three years, helping grow it into one of the largest crypto communities worldwide. His expertise in market structure and price patterns allows him to break down complex trends into clear, actionable insights.
He’s published thousands of articles covering altcoins, Bitcoin cycles, and macro trends.