Shorts have control as funding stays negative; without a demand spike, XRP is more likely to chop lower | Credit: Hameem Sarwar
Share
Key Takeaways
XRP remains structurally weak after a 64% drawdown, with falling volume.
Negative funding rates show aggressive short positioning, but no squeeze.
Momentum indicators show slowing bearish pressure, yet AO remains negative.
XRP remains under pressure after shedding roughly 64% from its all-time high, with market activity showing clear signs of fatigue rather than recovery.
Trading volume has dropped by about 19% over the past 24 hours, highlighting fading participation and weak conviction among both bulls and bears.
Can XRP survive this downtrend? Let’s find out.
XRP Short Sellers Have the Upper Hand
XRP’s funding rate has flipped negative over the past few days, with repeated spikes below -0.01% and even near -0.02%.
Amid this, the price continues grinding lower toward $1.50. This combination signals aggressive short positioning, as traders are paying to stay short during the decline.
Earlier in the move, funding was mostly positive during the push toward the $2.30 region.
However, the transition from sustained positive funding to persistent negative prints confirms a clear sentiment shift.
Longs were squeezed out, and the market has now swung to short-side overcrowding. However, this is not automatically bullish.
If XRP’s price fails to reclaim key resistance levels and funding stays negative during small rallies, it would signal continued structural weakness
As it stands, XRP is currently in a bearish price trend with an extreme short bias building. That creates conditions for volatility and a potential short squeeze rally.
By the look of things, that may not be the case, as long-positioned traders are not gaining given the current XRP funding rate.
Cautious Buyers Limit XRP
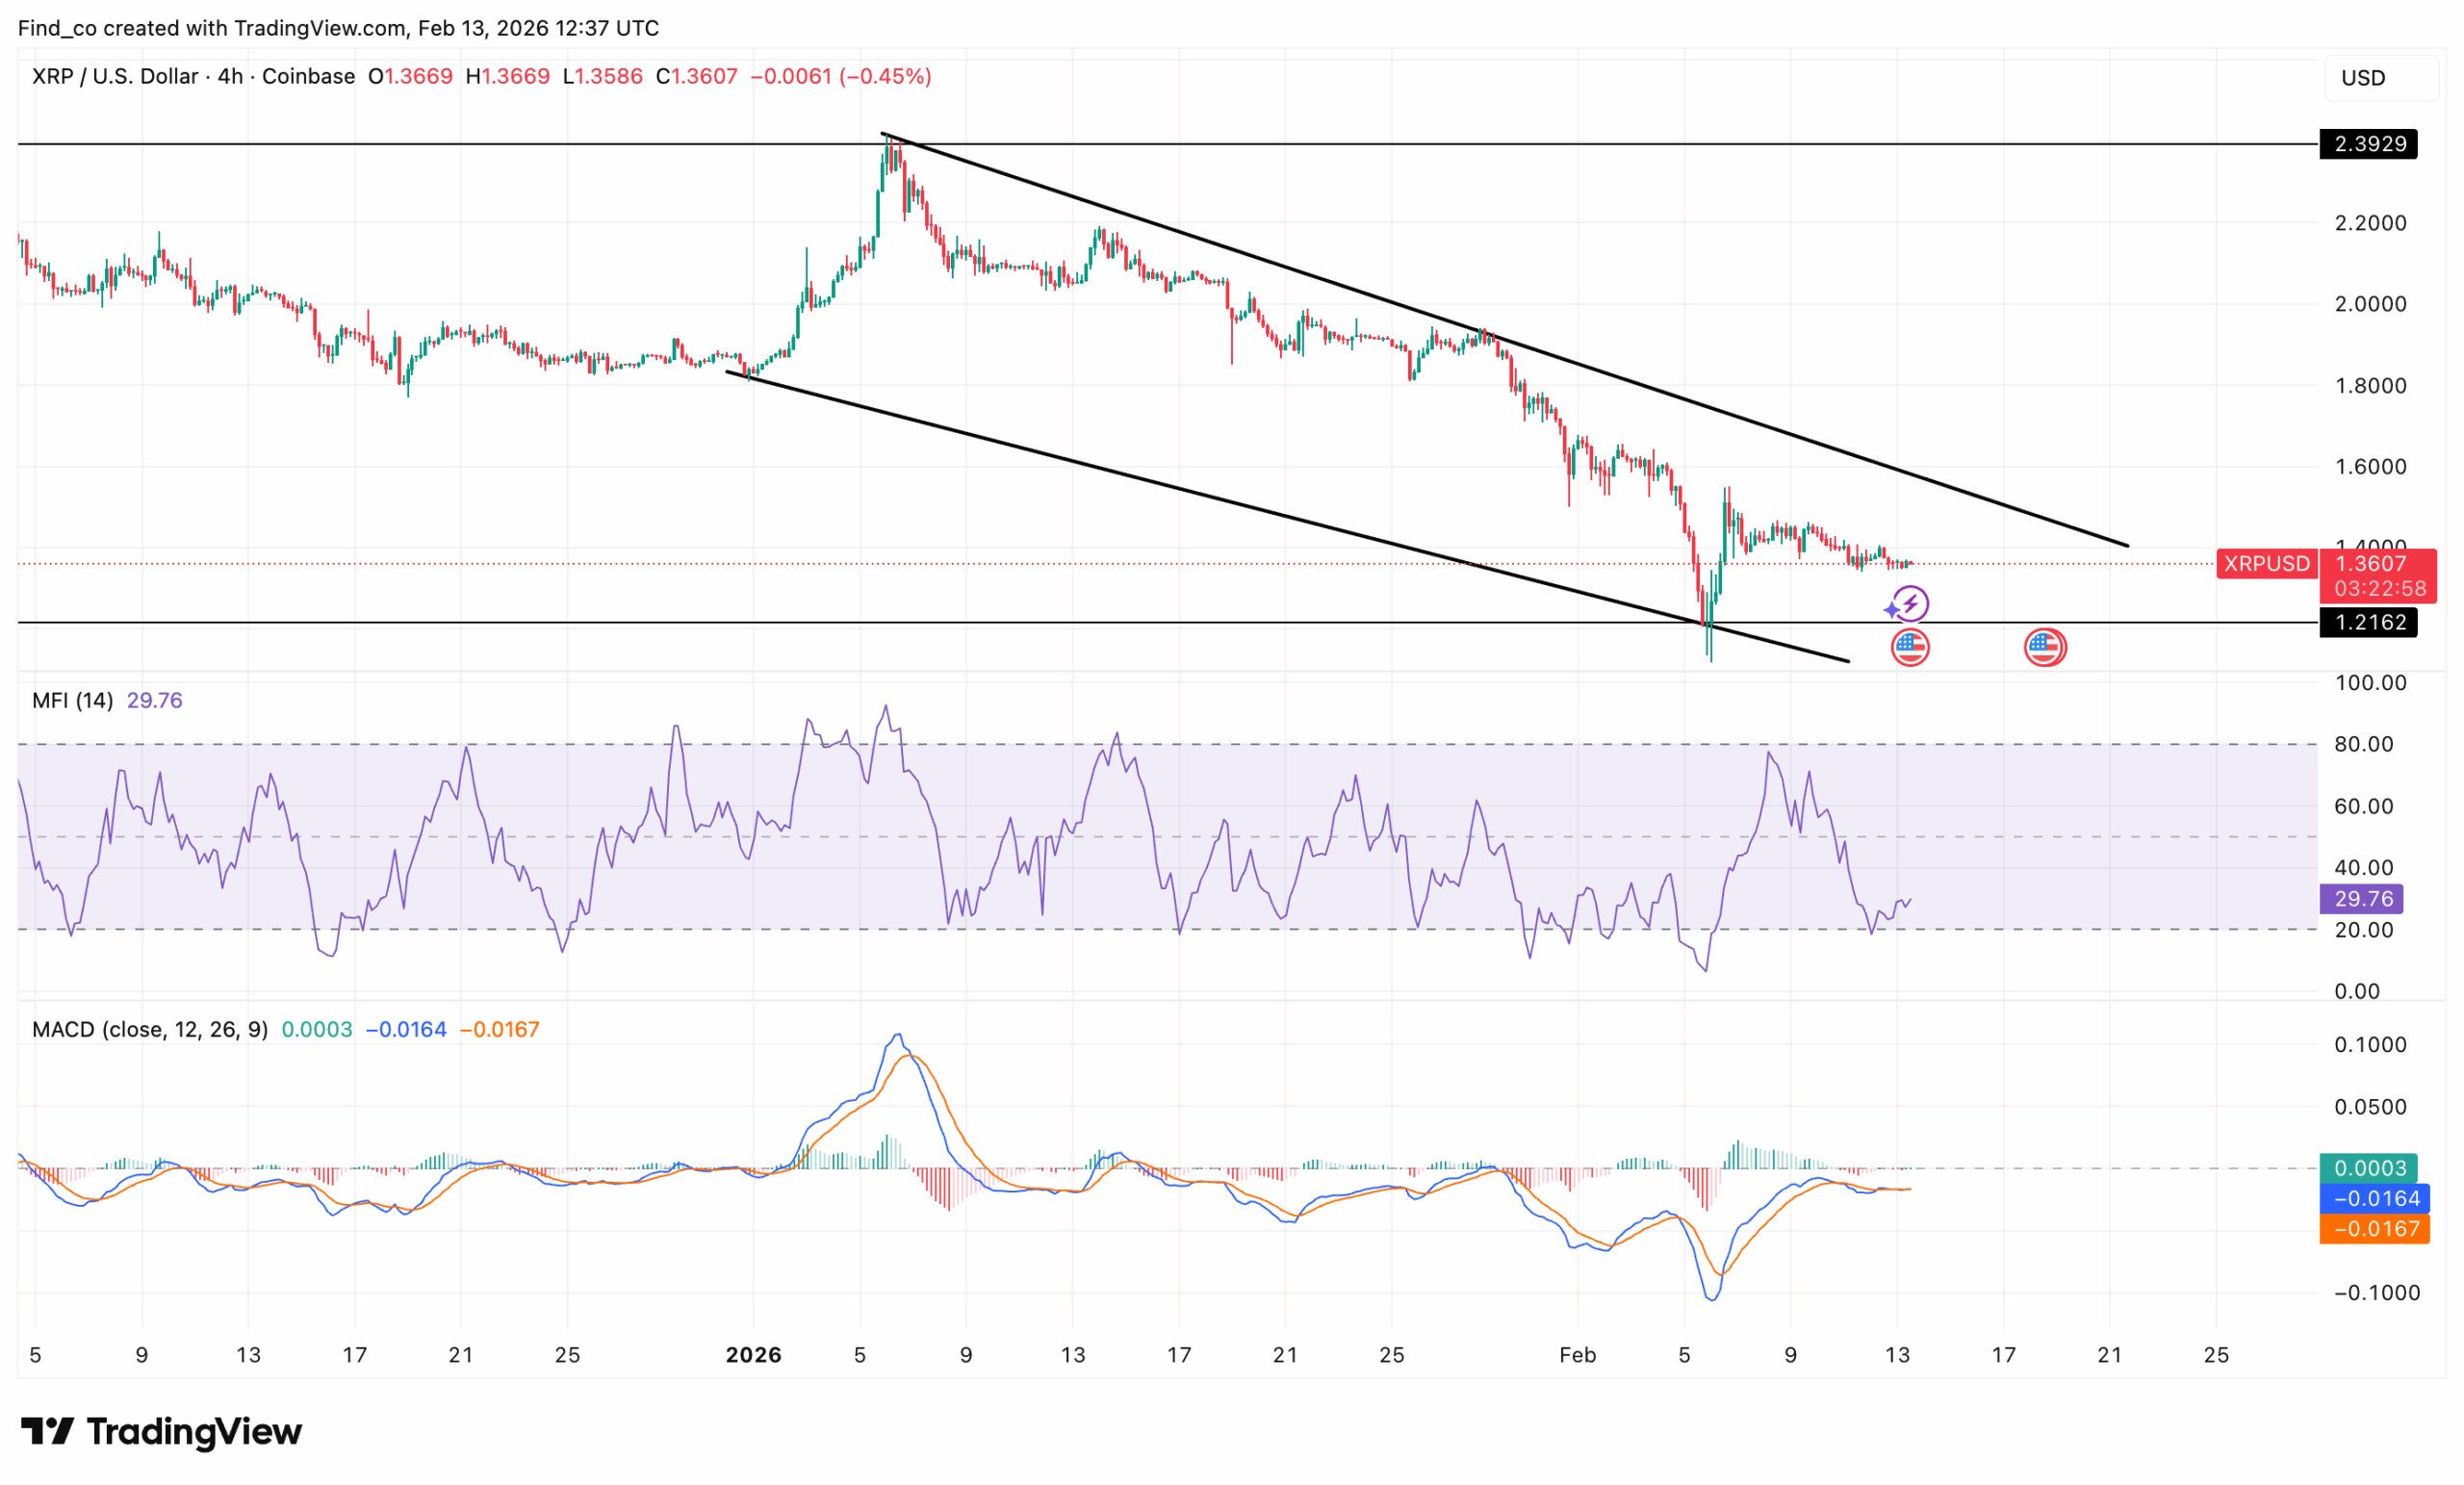
On the 4-hour chart, the Money Flow Index (MFI) hovers near 26.66, just above the oversold boundary.
While this region can sometimes precede short-term rallies, the current reading suggests only marginal buying interest.
Therefore, there is no aggressive accumulation. Without a notable influx of demand, oversold conditions alone are unlikely to trigger a sustained rebound.
Furthermore, the Moving Average Convergence Divergence (MACD) paints a similarly cautious picture.
The 26-period EMA continues to track above the 12-period EMA, confirming that bearish momentum still dominates the short-term trend.
This position signals that XRP’s price might struggle to rally.
Therefore, unless momentum indicators flip bullish and volume aligns with the XRP funding rate, the current structure points more toward consolidation within a broader bearish phase.
XRP Short-Term Trend: Bearish
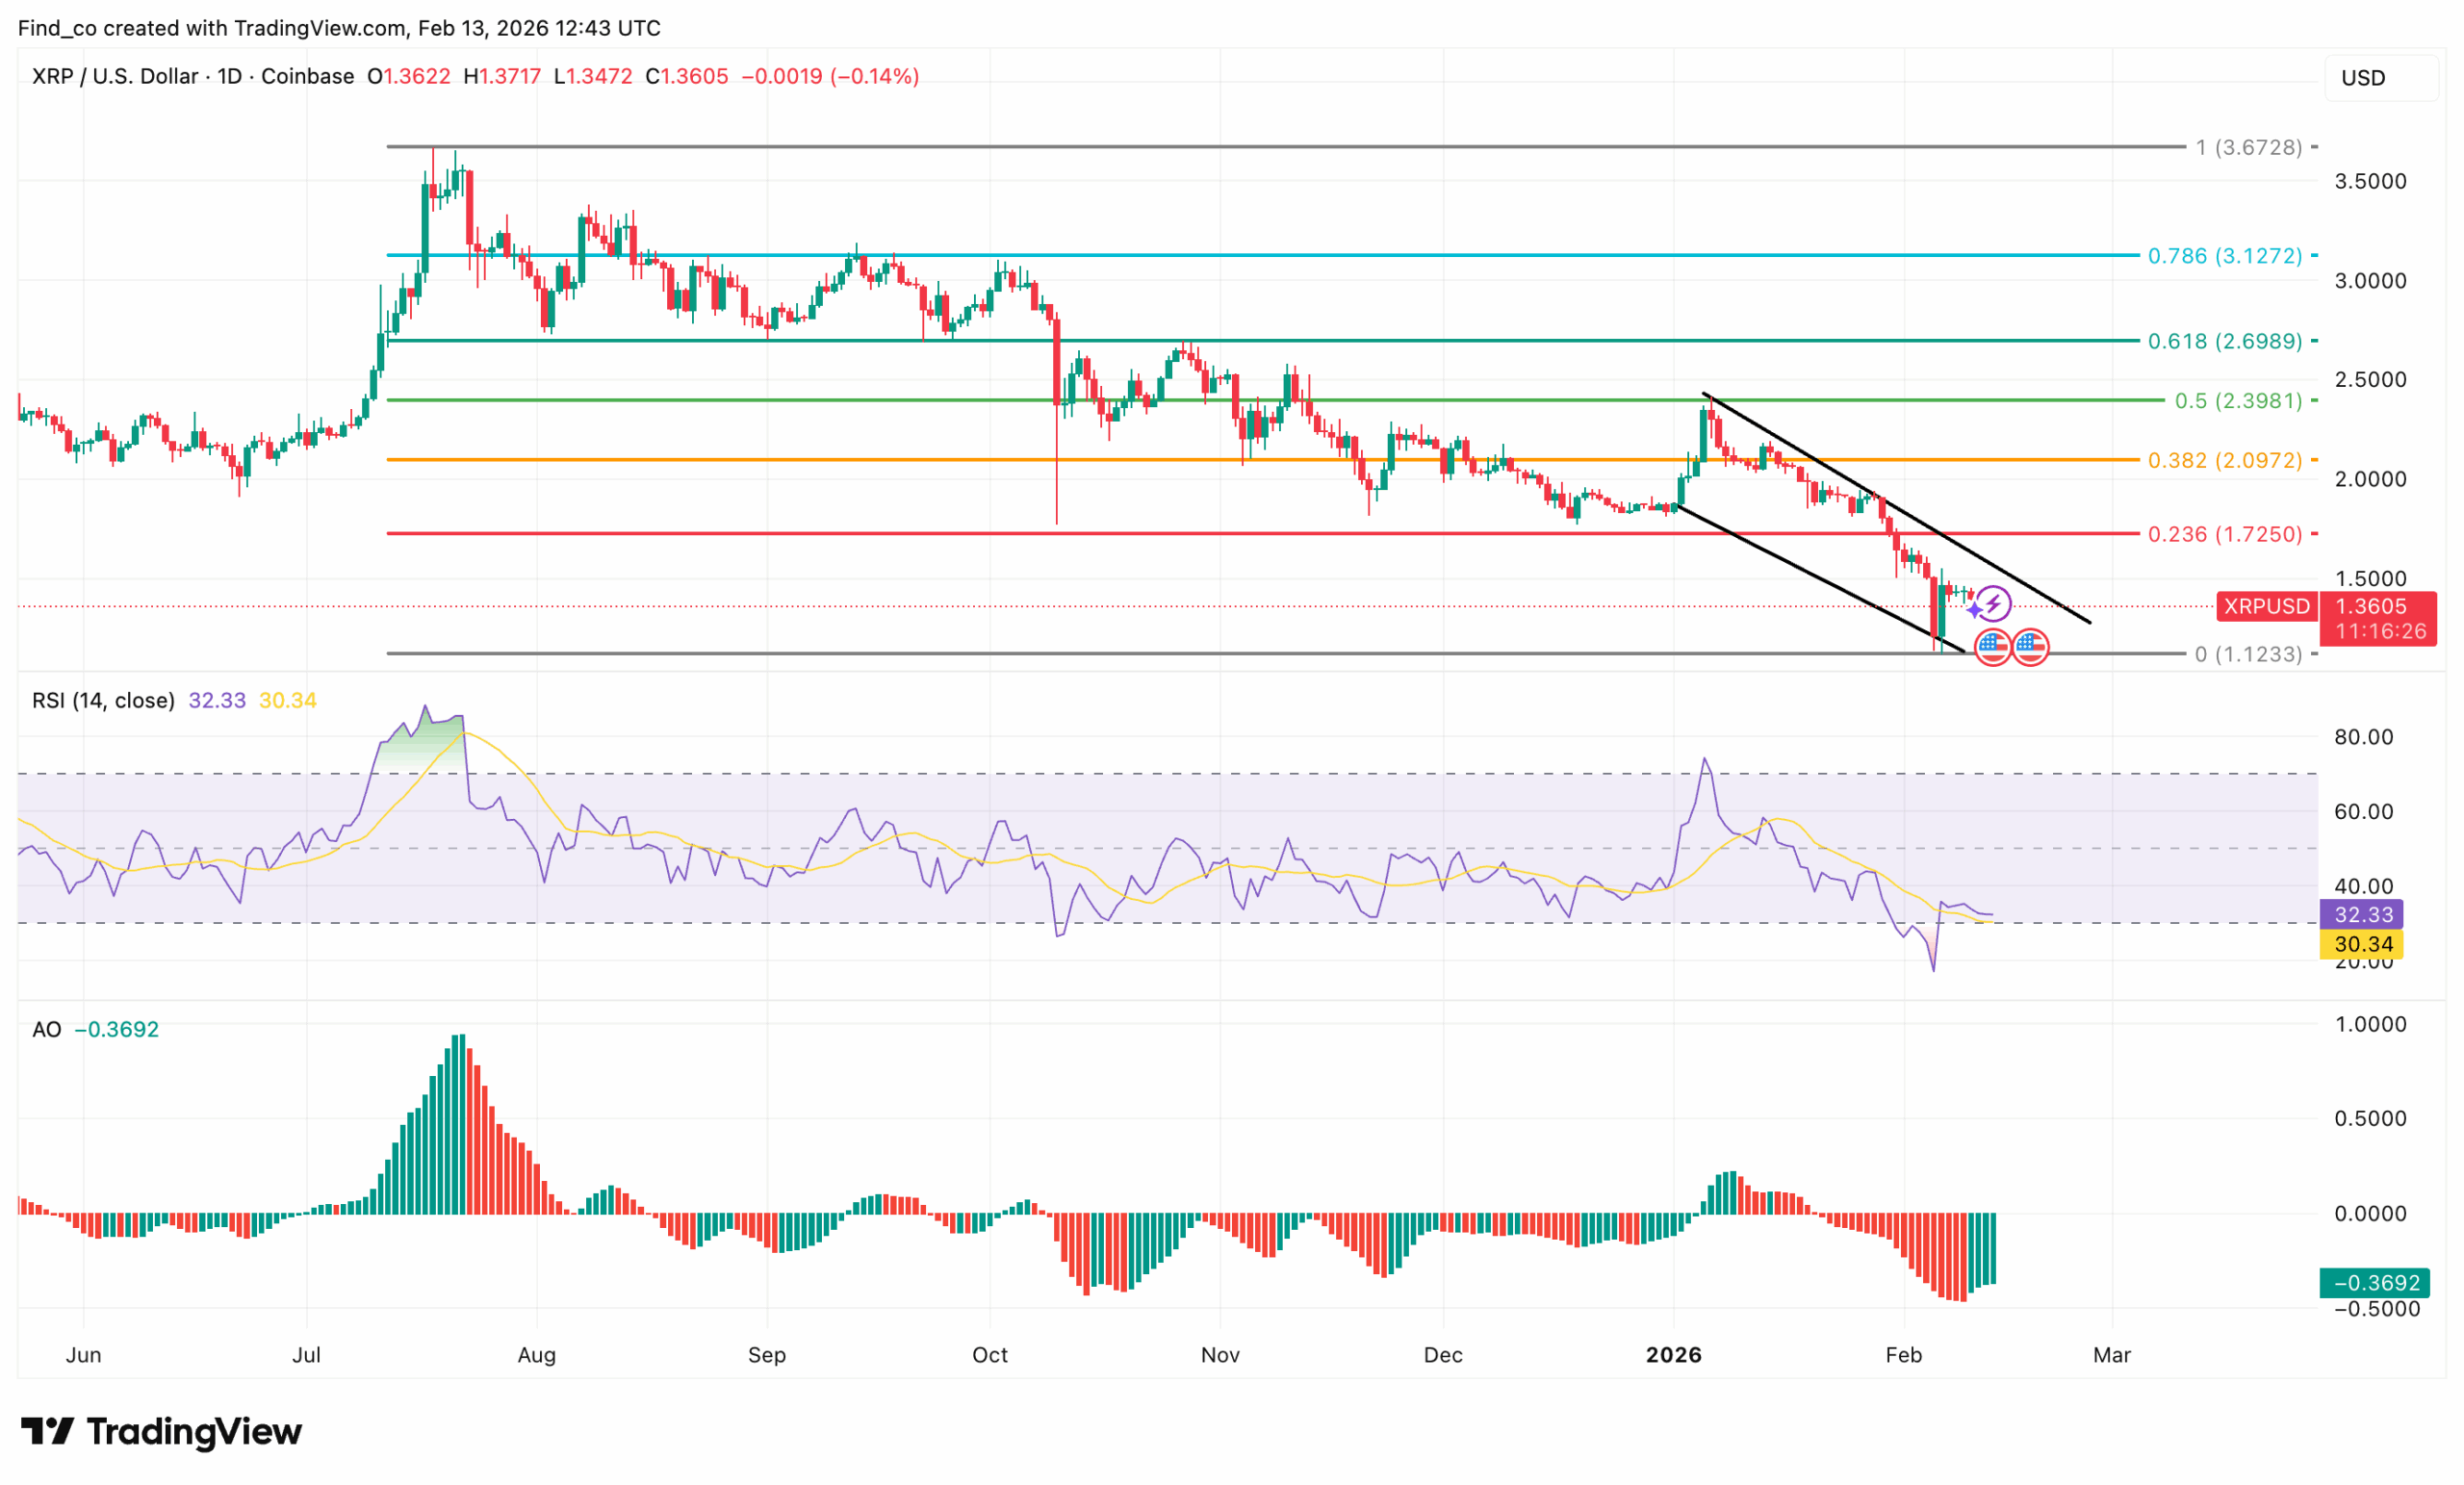
Besides the 4-hour chart, the daily chart reflects XRP’s persistent downtrend.
From the chart below, the price currently hovers around $1.36, a level that previously acted as a minor floor.
The Relative Strength Index (RSI) has moved away from the oversold region and now sits just above it, signaling temporary relief in selling pressure.
The Awesome Oscillator (AO) has printed multiple green histogram bars in negative territory.
This indicates that while bearish momentum may be slowing, bullish strength remains insufficient to flip the trend. S
hort-term attempts at recovery have been consistently capped near the $1.55 zone, highlighting strong resistance at previous supply levels.
Meanwhile, volume remains subdued, down 18.28% over the last 24 hours, suggesting that buyers lack conviction while cautious sellers continue to dominate the market.
XRP sits halfway between the 0.236 Fibonacci level and the zero Fib level, suggesting the market is testing a critical support zone.
If the current level at $1.36 fails to hold, the next key support lies around $1.12, which could trigger bargain hunting or capitulation selling depending on market sentiment.
Unless buyers push the oscillator into positive territory and reclaim key moving averages, XRP’s price remains vulnerable to further downside toward $1.30.
Disclaimer:
The information provided in this article is for informational purposes only. It is not intended to be, nor should it be construed as, financial advice. We do not make any warranties regarding the completeness, reliability, or accuracy of this information. All investments involve risk, and past performance does not guarantee future results. We recommend consulting a financial advisor before making any investment decisions.
Victor Olanrewaju is a crypto analyst and reporter at CCN with deep roots in on-chain research and technical analysis. His crypto journey began in 2017, but it was the 2020 Uniswap airdrop that sparked a full-time pivot into the space.
With a foundation in copywriting, Victor honed his craft creating high-converting content for leading crypto brokers — most notably an XRP price prediction that ranked #1 on Google during the 2021 bull run.
He later joined AMBCrypto in 2022, where he combined storytelling with technical and on-chain analysis to cover key market narratives.
In 2024, he expanded his expertise at BeInCrypto, collaborating with analysts and using tools like Glassnode, Santiment, and IntoTheBlock to break down Bitcoin and altcoin trends.
At CCN, Victor covers the top cryptocurrencies, memecoins, macro shifts, blending real-time insights with deep-dive metrics.
He holds a Bachelor’s degree in Physics from the University of Ibadan, equipping him to simplify complex data for a wide audience. Follow his work or connect on LinkedIn or X.