Has Stellar Finished its Correction? | Credit: Hameem Sarwar
Share
Key Takeaways
Stellar’s (XLM) price is decreasing under a diagonal resistance.
The XLM price trades inside the $0.37 horizontal support area.
Is the XLM correction over, or will the price fall again in September?
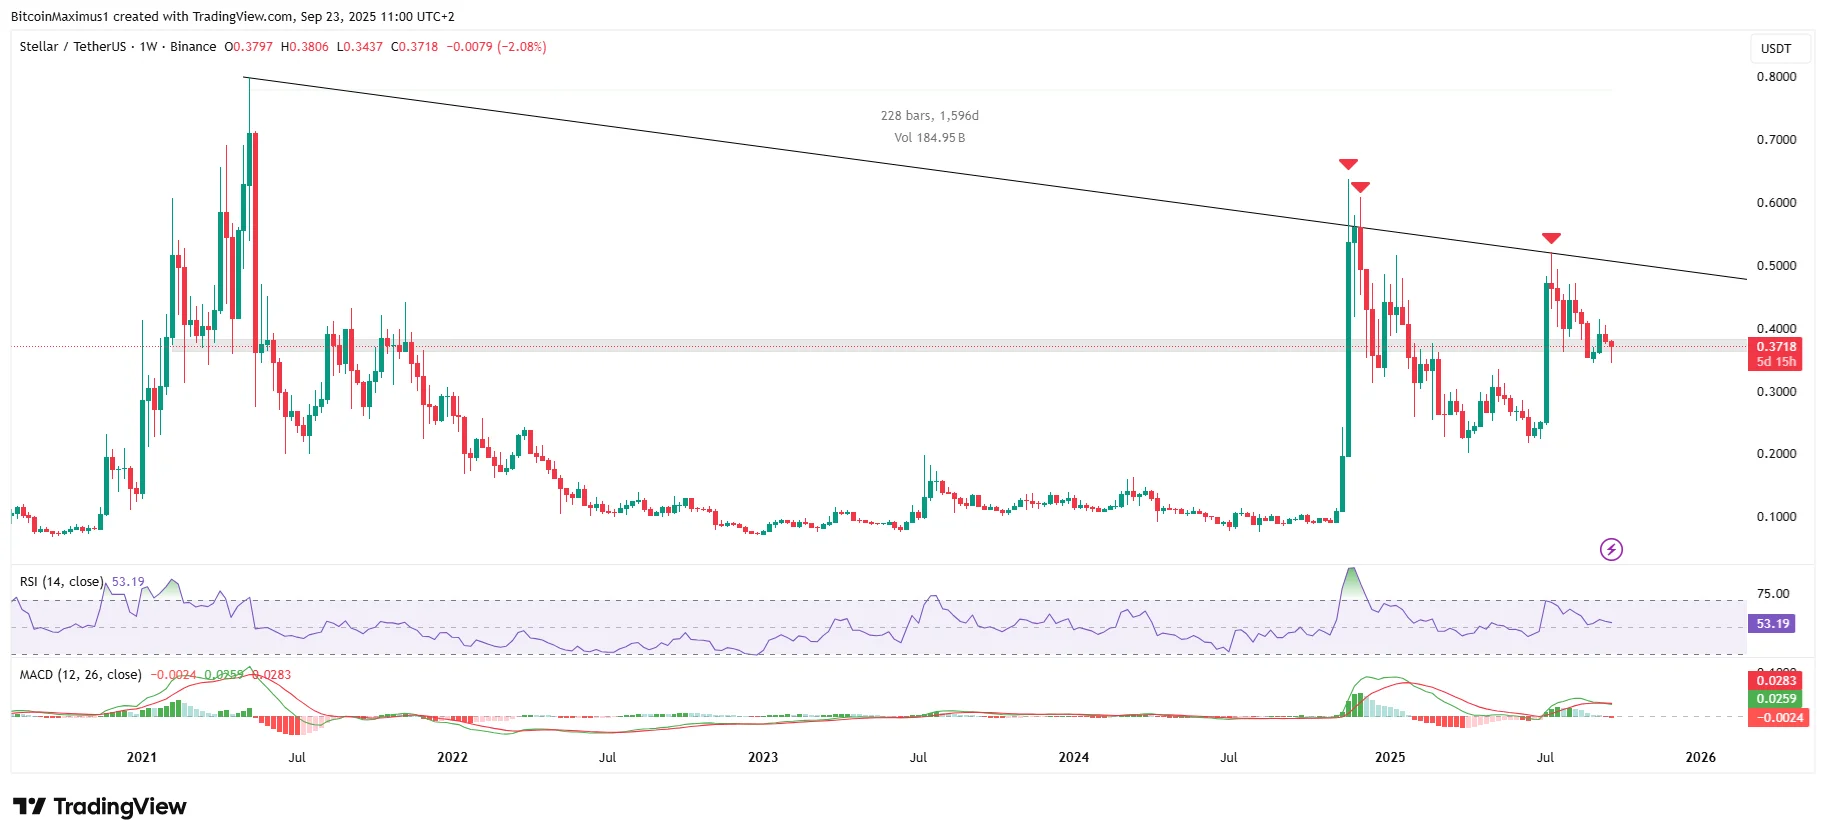
Stellar (XLM) has been stuck beneath a descending resistance trend line for more than 1,600 days, with three failed breakout attempts in the past year.
Now, the token is testing a key long-term horizontal support level—one that could decide whether XLM finally reverses its downtrend or continues to struggle.
XLM Price Analysis
The weekly time frame analysis shows Stellar’s decline under a diagonal resistance since the May 2021 highs.
During this time, the XLM price has also interacted with the $0.37 horizontal area, sometimes acting as both resistance and support.
Today, the Stellar price trades inside the $0.37 horizontal area, attempting to reclaim it with a significant bounce.
Get These Top Crypto Casino Offers Now!
Sponsored
Disclosure
We sometimes use affiliate links in our content, when clicking on those we might receive a commission at no extra cost to you. By using this website you agree to our terms and conditions and privacy policy.
Momentum indicators are undecided. The Relative Strength Index (RSI) is at 50 while the Moving Average Convergence/Divergence (MACD) is barely above 0.
Based on these signs, whether the XLM price prediction is bullish or bearish is unclear. Whether XLM closes above $0.37 or not can determine what the future trend is.
Is the XLM Dip Over?
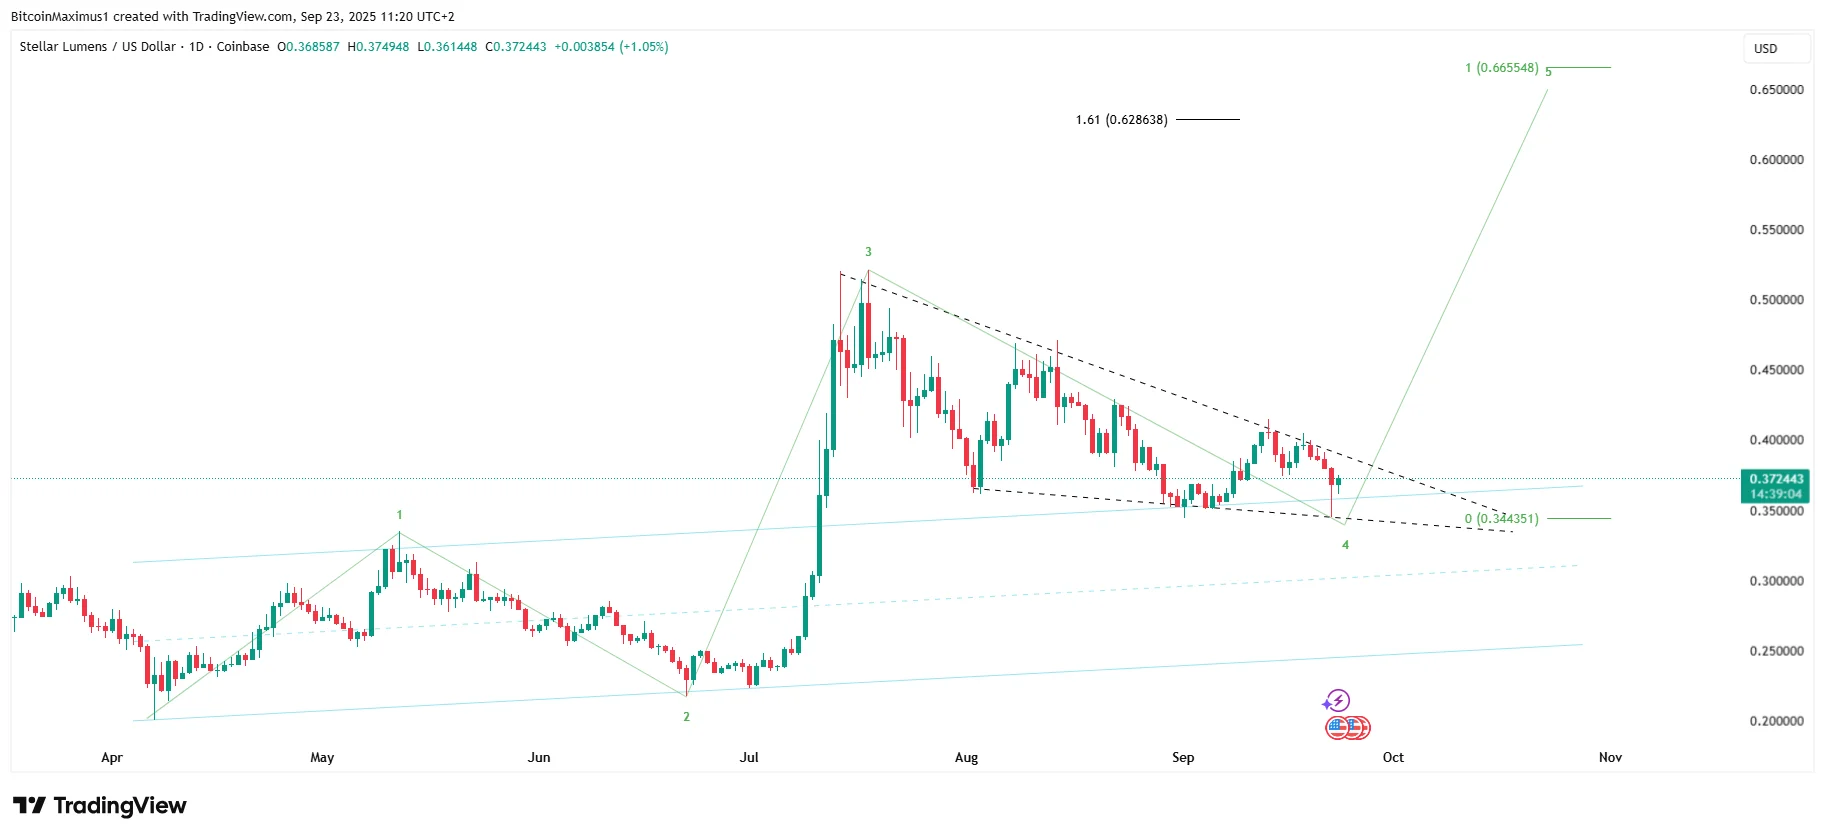
The short-term wave count suggests the XLM dip is most likely over.
While there is a small chance that XLM creates a slightly lower low, chances are that the bottom is in.
According to the count, Stellar is completing or has already completed wave four in a five-wave upward movement (green).
The decline is contained in a descending wedge pattern, and since the wedge is bullish, an eventual XLM breakout from it is likely.
If the count is accurate, the main target for the top of wave five is between $0.628 and $0.665.
The 1.61 external Fibonacci retracement creates the lower limit (black), while the upper limit is created by giving wave five the same length as waves one and three combined.
Stellar Breakout Incoming
If it holds above the $0.37 horizontal support area, XLM will prepare for its strongest upward movement this cycle.
A breakout from the short-term wedge could set the stage for a rally toward $0.628-$0.665.
A successful breakout could catalyze a parabolic Stellar rally toward a new cycle high.
Valdrin Tahiri is a cryptocurrency analyst and reporter at CCN, specializing in technical analysis with a focus on Elliott Wave theory, on-chain metrics, and fundamental research. He brings over seven years of experience in the crypto space as both a trader and writer.
He discovered cryptocurrencies in 2017 while earning his MSc in Financial Markets at the Barcelona School of Economics, which sparked a deep interest in blockchain and market dynamics. Since then, he’s contributed to top crypto outlets like BeInCrypto and CoinGape.
Valdrin also served as Community Manager of BeInCrypto’s Telegram group for three years, helping grow it into one of the largest crypto communities worldwide. His expertise in market structure and price patterns allows him to break down complex trends into clear, actionable insights.
He’s published thousands of articles covering altcoins, Bitcoin cycles, and macro trends.