How Long Will the VIRTUAL Increase Continue? | Credit: Hameem Sarwar
Share
Key Takeaways
Virtuals Protocol (VIRTUAL) has increased by 400% since April.
The price has completed a short-term five-wave upward movement.
Has VIRTUAL reached a local top, and where will it find support if yes?
After bursting onto the scene at the end of 2024 with a massive rally, VIRTUAL crashed in 2025, falling 90% from its all-time high.
However, not all hope is lost. VIRTUAL rallied in April alongside the rest of the crypto market, and the coin crossed $2 in May, reaching its highest price in five months.
Since Virtuals Protocol is only 150% below its all-time high, all eyes are on it to see if it can break its current resistance and surge to a new high.
VIRTUAL Price Crosses $2
The daily time frame analysis shows that the VIRTUAL price has completed a five-wave downward movement since its all-time high in January 2025.
The VIRTUAL price reached a low of $0.41 on April 9, a 91% decline from the all-time high. It fell under a descending resistance trend line.
VIRTUAL has increased since its low, breaking out from the trend line on April 18 and increasing 400%, in another five-wave rally (green) that could be over.
On May 8, the price reached a high of $2.136, well into the $2.10 resistance area, which has existed for over six months.
Whether Virtual Protocol’s price breaks out can determine the direction of future trends.
Technical indicators show some weakness, as is common at the end of a fifth wave.
The Relative Strength Index (RSI) and Moving Average Convergence/Divergence (MACD) generated bearish divergences (orange).
As a result, a short-term correction could be due soon.
Possible Local top
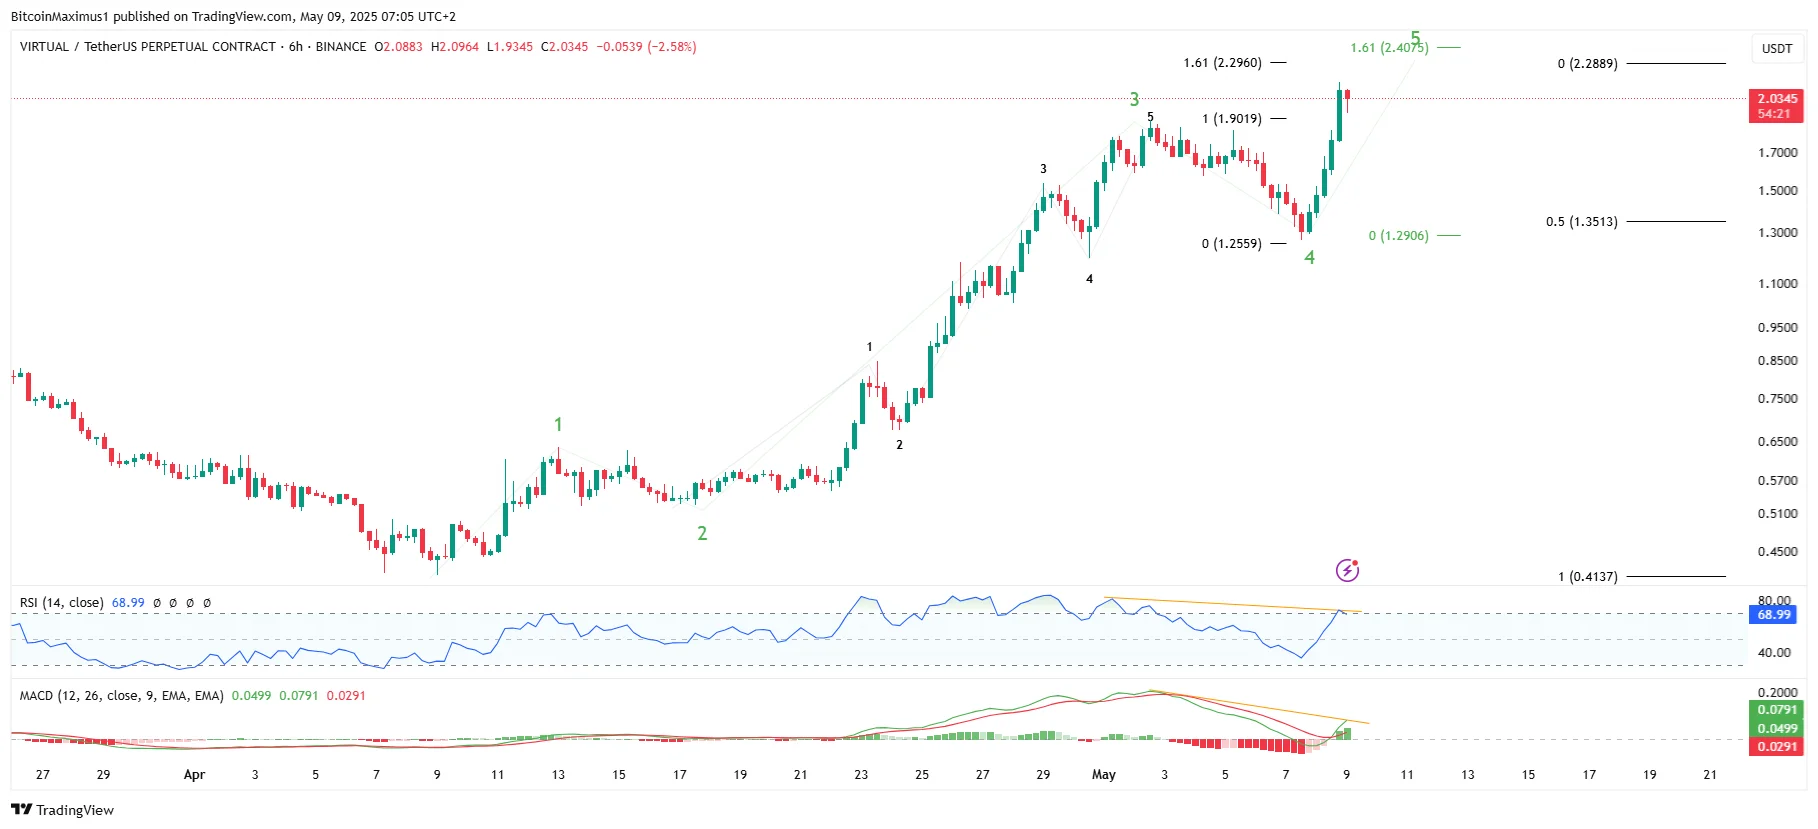
The shorter-term six-hour analysis allows for a VIRTUAL price increase toward $2.30, but confirms that a local top is close.
VIRTUAL’s sub-wave count shows an extended wave three and provides confluence at a target near $2.30-$2.40.
The 1.61 external Fibonacci retracement of wave four created the lower limit of the target, while the upper one is made by giving wave five 1.61 times the length of wave one.
In a third-wave extension, wave five is unlikely to extend; hence, it has a proportion similar to wave one.
The RSI and MACD have generated sharp bearish divergences, aligning with those from the daily time frame.
If a correction happens, VIRTUAL could find support near the 0.5 Fibonacci retracement at $1.35, a horizontal support area that coincides with the wave four bottom.
Disclaimer:
The information provided in this article is for informational purposes only. It is not intended to be, nor should it be construed as, financial advice. We do not make any warranties regarding the completeness, reliability, or accuracy of this information. All investments involve risk, and past performance does not guarantee future results. We recommend consulting a financial advisor before making any investment decisions.
Valdrin Tahiri is a cryptocurrency analyst and reporter at CCN, specializing in technical analysis with a focus on Elliott Wave theory, on-chain metrics, and fundamental research. He brings over seven years of experience in the crypto space as both a trader and writer.
He discovered cryptocurrencies in 2017 while earning his MSc in Financial Markets at the Barcelona School of Economics, which sparked a deep interest in blockchain and market dynamics. Since then, he’s contributed to top crypto outlets like BeInCrypto and CoinGape.
Valdrin also served as Community Manager of BeInCrypto’s Telegram group for three years, helping grow it into one of the largest crypto communities worldwide. His expertise in market structure and price patterns allows him to break down complex trends into clear, actionable insights.
He’s published thousands of articles covering altcoins, Bitcoin cycles, and macro trends.